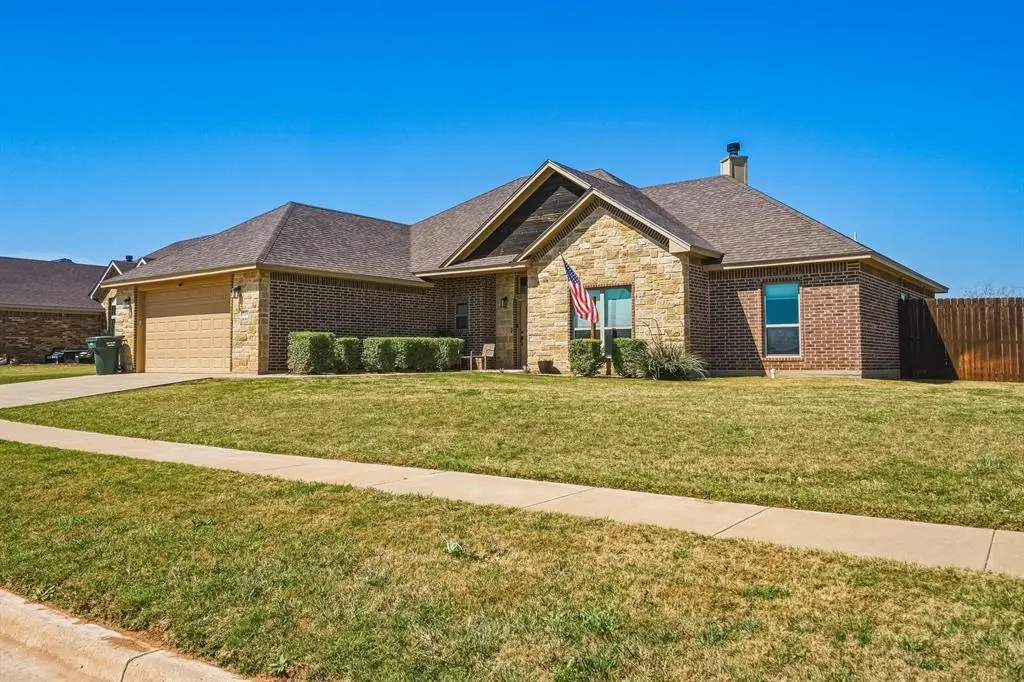
7250 Tuscany Dr · Abilene, TX
Flood risk 1/10 · Minimal
- FEMA flood zone
- X (unshaded)
- Chance of flooding over 30 yrs
- 0.0%
- Est. flood insurance / yr
- $507 – $1,088
Fire risk 9/10 · Severe
- Est. fire insurance / yr
- $1,222 – $2,270
Heat risk 7/10 · Major
- Hot days now (above 103°F)
- 7 days/yr
- Hot days in 30 yrs
- 24 days/yr
Wind risk 4/10 · Minor
- Chance of severe wind over 30 yrs
- 18.0%
Air-quality risk 1/10 · Minimal
- Unhealthy air days now
- 0 days/yr
- Unhealthy air days in 30 yrs
- 0 days/yr
Risk factors via First Street. Map © Google.
Why this score? — see what drove the D grade
The composite is a weighted blend of 9 inputs, each scored 0–100. Each bar is that input's sub-score; the figure is the points it added to the 100-point composite (weight × sub-score).
- ARV discount +10.0/15.0
- Cash flow +9.9/30.0
- Schools +5.6/10.0
- Rent growth +5.0/5.0
- 1% rule +4.0/10.0
- Livability +3.8/5.0
- DSCR +2.8/10.0
- Condition / age +2.5/5.0
- Appreciation +0.0/10.0
$379,900
🖨 Deal sheet (PDF) 📄 Offer letter ✓ Due diligence
Listing remarks MLS
If you want attention to detail then this new Lawson Built home is what you are looking for. 4 bedrooms 2 baths. Spectacular island kitchen with custom painted cabinetry, granite and stone accents set this one off from the rest. Kitchen opens to living room and stone fireplace. Luxurious master suite boasts a garden tub, separate walk in shower and oversized walk in closet. Stained wood ceiling accents. Extra Large covered patio great for entertaining. Wylie Schools. Close to Dyess, hospital, shopping and country club. Move in ready!
Key facts
- In-ground pool
- Rv parking
- Waterfall
Tags
Neighborhood map
What this means for you Summary
Snapshot
- This is a 4-bed/2.0-bath single-family listed at $380k.
Deal economics
- At list price, monthly cash flow is $-235 ($-3k/yr) — negative.
- To cash-flow at today's rent, offer at most $338k (10.9% below list).
- To meet the 1% rule (rent ≥ 1% of price), the offer needs to be $344k (9.5% below list).
- Recommended offer: $338k (10.9% below list) — sets the bar for cash-flow.
Location & tenants
- Location reads 75/100 on livability (#142 in TX, #4,037 nationally) — a middle-class / working-renter tenant base. Strengths: cost of living A+, housing A+, health & safety A+; Watch: crime D, commute F.
- Wylie ISD (rural): math 63% / reading 62% proficiency, ranked #32 of 826 in TX (top 4%) — acceptable for families but not a draw, mixed tenant base, ~2y average lease; only 17% free/reduced lunch — higher-income household profile.
- Zoned schools: Wylie West El (428 students, 21% FRL); Wylie West J H (math 62% / reading 58%, grade B, #158 of 1,662 statewide, top 10%, 972 students, 24% FRL); Wylie H S (math 60% / reading 76%, grade B, #150 of 1,632 statewide, top 10%, 1,467 students, 18% FRL) — zoned schools at 21% FRL track the district average.
- Market conditions: Rents rising fast (+40.7%/yr); 294 active listings in the ZIP; 14 comparable units currently listed for rent nearby; rentals at typical pace (median 15d on market — plan ~3-4 weeks tenant-placement turnaround); solid renter incomes; 508 units permitted in Taylor County in 2024 (0 in 5+ unit buildings).
- At $3,438/mo this rent would consume 52% of the median local household income ($79k/yr) (locally 1181% of renters already pay >50% of income on rent) — very limited rent-growth headroom before tenants either downsize or default.
Forward outlook
- Local home prices are declining (-3.0%/yr); year-one equity from $3k of loan paydown is wiped out by about $11k of value loss. Plan a longer hold.
- Taylor County population projected at +16% by 2050 — long-run rental-demand tailwind backs the buy-and-hold thesis.
Negotiation context
- Only 13 days on market — expect competitive offers; lowballing is unlikely to land.
- 2 sale attempts since 8y ago with the ask held roughly flat each time — persistent listings suggest the price (not the market) is what's stuck; bring a comps-based counter.
Risks & watch-outs
- Watch-outs: property tax is 2.5% of price.
- Climate carrying-cost: severe wildfire risk; extreme-heat days projected 7→24/yr by 2055 (HVAC capex compounding) — expect insurance premiums to compound above CPI over the hold.
Questions for the listing agent
- What do current leases actually rent for vs. the listed asking? Can we see a recent rent roll and the last 12 months of T-12 income?
- Property tax is high relative to price — has the assessment been appealed recently, and will the sale trigger a re-assessment?
- Is there a deadline driving the sale (1031 exchange, divorce, estate, relocation)? That informs how much negotiation room exists.
- Schools are D-rated, which usually means shorter tenancies and higher turnover. Who's the typical renter profile here, and what's been the actual vacancy rate?
- Crime grade is D in this area — have there been break-ins, vandalism, or insurance claims at this property in the last 3 years? What carrier currently insures it and at what premium?
- The area grade is low — what's the realistic commute time and amenity access for the typical tenant pool here? Any planned neighborhood developments (good or bad) we should know about?
- What's the average days-on-market for RENTAL listings here right now (not sales)? A rising rental-DOM trend means longer vacancies and softer asking-rent achievability than the comps imply.
- What's the recent tenant-quality profile in this submarket — average credit score on applications, eviction rate, late-payment / NSF rate, and stable-employment percentage? A property-management company in the area should have these aggregated.
- How much new for-sale + rental construction is in the pipeline within 1–3 miles? Heavy new supply typically softens prices + rents 12–24 months out; constrained supply supports both.
Investment metrics
- 1% rule
- 0.90% ✗
- Cap rate
- 5.55%
- Cash-on-cash
- -2.65%
- DSCR
- 0.88
- GRM
- 9.2
CMA / ARV
- ARV (on-the-fly)
- $402,584
- Comps found
- 12
Show comp detail 12 sales within ~0.75 mi
| Address | Dist | Beds/Ba | Sqft | Sold | Price | $/sf | Match |
|---|---|---|---|---|---|---|---|
| 7250 Tuscany Dr | 0.00mi | 4/2.0 | 2,054 (0%) | 2mo | $379,900 | $185 | 99 |
| 7501 Olive Grove Ave | 0.19mi | 4/2.0 | 1,857 (-10%) | 1mo | $349,900 | $188 | 75 |
| 7225 Tuscany Dr | 0.05mi | 4/2.0 | 1,760 (-14%) | 1mo | $349,000 | $198 | 73 |
| 7553 Tuscany Dr | 0.21mi | 4/2.0 | 1,793 (-13%) | 2mo | $327,500 | $183 | 67 |
| 7555 Salerno Ct | 0.23mi | 3/2.0 (-1) | 1,785 (-13%) | 3mo | $340,000 | $190 | 60 |
| 7702 Florence Dr | 0.40mi | 4/2.5 | 2,292 (+12%) | 1mo | $359,900 | $157 | 59 |
| 6625 Tin Cup Dr | 0.47mi | 4/2.5 | 2,278 (+11%) | 0mo | $469,900 | $206 | 58 |
| 6410 Glen Abbey | 0.68mi | 4/2.0 | 2,159 (+5%) | 3mo | $415,000 | $192 | 57 |
| 3318 Birdie | 0.48mi | 4/3.0 | 2,288 (+11%) | 1mo | $469,000 | $205 | 54 |
| 3318 Front Nine Dr | 0.70mi | 4/3.0 | 2,145 (+4%) | 3mo | $419,900 | $196 | 53 |
| 6433 Tin Cup | 0.58mi | 3/2.0 (-1) | 2,350 (+14%) | 1mo | $479,000 | $204 | 43 |
| 3418 Double Eagle Ln | 0.67mi | 4/3.0 | 2,350 (+14%) | 1mo | $465,000 | $198 | 40 |
Match score weights: distance 35% · size 25% · config 20% · recency 20%. Top-matched comps best support the ARV.
Projected returns pro-forma
-3.0% appreciation · 8.0% rent growth · sell at horizon
- IRR
- -14.5%
- Equity multiple
- 0.45×
- Total profit
- $-58,112
- Equity at exit
- $56,644
- IRR
- 1.5%
- Equity multiple
- 1.13×
- Total profit
- $13,835
- Equity at exit
- $32,847
Cash invested: $106,372 (down + closing). Projections, not guarantees.
Landlord ↔ Tenant lean methodology
- Overall (STATE)
- 87 Strongly Landlord-Friendly
- State Texas
- 87 Strongly Landlord-Friendly · R+5
- County
- — inherits STATE
- City
- — inherits STATE
ZIP-level market 79606
- Rents YoY
- 40.7%
- Active inventory
- 294
- Price-to-rent
- 9.2×
Monthly cashflow live
- Estimated rent
- $3,438 high interval (Pro) →
- Mortgage (P&I)
- −$1,992
- Tax from tax record
- −$801 /mo · $9,607/yr
- Insurance
- −$158
- HOA
- −$0
- Vacancy / Maint / Mgmt
- −$722
- Net cashflow
- $-235
Break-even live
Sensitivity live
| Price | -10% $-20 | -5% $-128 | +0% $-235 | +5% $-343 | +10% $-450 |
|---|---|---|---|---|---|
| Rent | -10% $-507 | -5% $-371 | +0% $-235 | +5% $-99 | +10% $37 |
| Rate | -1.0pp $-44 | -0.5pp $-138 | base $-235 | +0.5pp $-334 | +1.0pp $-434 |
UW: 25.0% down · 7.5% · 30yr · 1.5% tax · 5.0% vac · 8.0% maint · 8.0% mgmt
Financing live
Cash to close
- Down payment
- $94,975
- Closing costs
- $11,397
- Reserves months
- —
- Total cash needed
- —
Loan-product check · same deal, 3 products live
Conventional
25% down · 7.5% · 30yr
- Down + closing
- —
- Monthly P&I
- —
- Monthly cashflow
- —
- DSCR
- —
- Eligible?
- —
Personal DTI + credit; lowest rate.
DSCR
20% down · 8.5% · 30yr
- Down + closing
- —
- Monthly P&I
- —
- Monthly cashflow
- —
- DSCR
- —
- Eligible?
- —
No personal income docs; deal must DSCR.
Hard money
10% down · 12.0% · 12mo
- Down + closing
- —
- Monthly P&I
- —
- Monthly cashflow
- —
- DSCR
- —
- Eligible?
- —
Short-term bridge; refi at stabilization.
Rent comps 14 comps
| Address | Beds | Baths | Sqft | Rent | $/sqft | DOM | Units | Dist |
|---|---|---|---|---|---|---|---|---|
| 7610 Florence Dr Abilene, TX | 3.0 | 2.0 | 1405 | $2,640 | $1.88 | 22d | 1 | 0.29mi |
| 7061 Tin Cup Dr Abilene, TX | 4.0 | 2.0 | 1648 | $3,495 | $2.12 | 13d | 1 | 0.29mi |
| 6901 Glen Abbey St Abilene, TX | 4.0 | 2.0 | 1648 | $3,795 | $2.30 | 22d | 1 | 0.37mi |
| 3626 Yamini Dr Abilene, TX | 4.0 | 2.0 | 1788 | $2,799 | $1.57 | 22d | 1 | 0.52mi |
| 7045 Phoenix Dr Abilene, TX | 4.0 | 2.0 | 1571 | $2,714 | $1.73 | 26d | 1 | 0.55mi |
| 3726 Pensacola Dr Abilene, TX | 4.0 | 2.5 | 2126 | $7,000 | $3.29 | 0d | 1 | 0.85mi |
| 8345 South Rdg Abilene, TX | 4.0 | 2.5 | 2300 | $4,000 | $1.74 | 9d | 1 | 0.92mi |
| 7601 Thompson Pkwy Abilene, TX | 4.0 | 2.0 | 1495 | $2,795 | $1.87 | 15d | 1 | 0.93mi |
| 7534 John Carroll Dr Abilene, TX | 4.0 | 2.0 | 1984 | $2,795 | $1.41 | 5d | 1 | 1.08mi |
| 7933 Hearne Dr Abilene, TX | 3.0 | 2.0 | 1542 | $2,695 | $1.75 | 15d | 1 | 1.23mi |
| 4742 Kevin Ct Abilene, TX | 3.0 | 2.0 | 1630 | $3,400 | $2.09 | 7d | 1 | 1.33mi |
| 4426 Sierra Sunset Abilene, TX | 4.0 | 3.0 | 2697 | $4,500 | $1.67 | 45d | 1 | 1.38mi |
| 6609 Summerwood Trl Abilene, TX | 4.0 | 2.0 | 1851 | $3,195 | $1.73 | 7d | 1 | 1.44mi |
| 5733 Legacy Dr Abilene, TX | 3.0 | 2.0 | 1843 | $5,000 | $2.71 | 6d | 1 | 1.45mi |
Listing history 8 events
-
2026-04-09status Pending
-
2026-03-30historical Active Option Contract
-
2026-03-27$379,900 Active
-
2018-07-18soldstatus
-
2018-07-17soldstatus Sold 546-char remark
Show marketing remark (546 chars)
If you want attention to detail then this new Lawson Built home is what you are looking for. 4 bedrooms 2 baths. Spectacular island kitchen with custom painted cabinetry, granite and stone accents set this one off from the rest. Kitchen opens to living room and stone fireplace. Luxurious master suite boasts a garden tub, separate walk in shower and oversized walk in closet. Stained wood ceiling accents. Extra Large covered patio great for entertaining. Wylie Schools. Close to Dyess, hospital, shopping and country club. Move in ready!
-
2018-05-31status Pending 546-char remark
Show marketing remark (546 chars)
If you want attention to detail then this new Lawson Built home is what you are looking for. 4 bedrooms 2 baths. Spectacular island kitchen with custom painted cabinetry, granite and stone accents set this one off from the rest. Kitchen opens to living room and stone fireplace. Luxurious master suite boasts a garden tub, separate walk in shower and oversized walk in closet. Stained wood ceiling accents. Extra Large covered patio great for entertaining. Wylie Schools. Close to Dyess, hospital, shopping and country club. Move in ready!
-
2018-02-13$274,000 Active 546-char remark
Show marketing remark (546 chars)
If you want attention to detail then this new Lawson Built home is what you are looking for. 4 bedrooms 2 baths. Spectacular island kitchen with custom painted cabinetry, granite and stone accents set this one off from the rest. Kitchen opens to living room and stone fireplace. Luxurious master suite boasts a garden tub, separate walk in shower and oversized walk in closet. Stained wood ceiling accents. Extra Large covered patio great for entertaining. Wylie Schools. Close to Dyess, hospital, shopping and country club. Move in ready!
-
2017-07-31soldstatus
ⓘ Source: listings_history table (triggers on properties + properties_extension) + one-shot
backfill from property_details.listing_events for pre-trigger history.
Tax reassessment forecast TX · Resets to sale price
- Current annual tax
- $9,607 · $801/mo
- Projected year-2 tax
- $9,607 · $801/mo
- Expected delta
- $0/yr ($0/mo · 0.0%)
ⓘ Screening estimate from a state-policy table — verify with the county assessor before closing.
Climate risk First Street
- Flood 1/10 Low FEMA zone X (unshaded) · 0% chance over 30 yrs
- Wildfire 9/10 Extreme
- Heat 7/10 Severe 7 d/yr ≥103°F today · 24 d/yr by 30 yrs out
- Wind 4/10 Moderate 18% chance of damaging wind over 30 yrs
- Air quality 1/10 Low 0 unhealthy d/yr today · 0 by 30 yrs out
Nearby sold comps map
Loading sold comps map…
Walkable amenities ~0.75 mi
Loading nearby amenities…
Taxation est. · year 1
- Rental income
- $41,256
- − Mortgage interest
- −$21,280
- − Property taxes
- −$9,607
- − Insurance
- −$1,900
- − Repairs & maintenance
- −$3,300
- − Management
- −$3,300
- − Depreciation
- −$11,052
- Taxable loss
- −$9,183
- Est. tax savings @ 24.0%
- +$2,204
- After-tax cash flow
- $-617/yr
For passive investors: Depreciation is non-cash, so a rental often shows a tax loss while cash-flowing — sheltering income. Rental losses are passive: they offset passive income freely, and up to $25,000/yr can offset ordinary (W-2) income if you actively participate and your MAGI is under $100k (phasing out to $0 by $150k); unused losses carry forward. On sale, claimed depreciation is recaptured at up to 25%, and gains may owe capital-gains tax (a 1031 exchange can defer both). Figures are a year-1 estimate at your 24.0% rate — not tax advice; consult a CPA.
Schools (NCES district)
- District
- Wylie ISD
- NCES district ID
- 4846500
- Math proficiency
- 63% ▼ -12.00%
- Reading proficiency
- 62% ▼ -4.00%
- Median HH income
- $78,248
- Composite
- 55.86/100
- National rank
- #1206
- State rank
- #32 of 826 in TX
Livability — Abilene
- Score
- 75/100
- State rank
- #142
- US rank
- #4037
Category grades
Schools grade is shown separately in the Schools card above.
Census & demographics
- Census place
- Abilene, TX
- County
- Taylor County · 136,672 people
- City population
- 136,672
- Metro
- Abilene, TX
- Population (ZIP)
- 29,182
- Household income
- $79,196
- Rent vs Own
- Severe rent burden
- 1181.0
Population outlook (Taylor County) Hauer SSP2
- Today (2025)
- 145,270 people
- By 2030
- 150,050 · +3.3%
- By 2040
- 159,417 · +9.7%
- By 2050
- 168,883 · +16.3%
- By 2075
- 194,436 · +33.8%
- By 2100
- 203,163 · +39.9%
Race, ethnicity, and origin ACS 2023
- Neighborhood character
- Predominantly White (69%)
- Race & ethnicity
- White 69% Hispanic / Latino 19% Two or more races 11% Black 6% Asian 4%
- Hispanic origin (detail)
- Mexican 14%
- Common ancestry
- Italian 4% Slovak 2% Serbian 1%
- Foreign-born
- 7% · Canada, Vietnam
- Languages at home
- 86% English-only · Spanish 10% Tagalog/Filipino 1% Other Indo-European 1%
Political lean MEDSL · Taylor
- 2024 margin
- Solid R (+49.8) · D 24.6% · R 74.4% · Other 1.0%
- 2008→2024 swing
- -4.2pp toward R · 2008: -45.6pp · 2024: -49.8pp
- All cycles
- 2024: R+49.8 2020: R+45.3 2016: R+51.1 2012: R+53.6 2008: R+45.6
Not yet ingested
- Civics
- —
Market trends
- HPI YoY
- ▼ -167.33%
- Current HPI
- 179.2555
- Rent YoY
- ▲ 40.73%
- Metro
- Abilene, TX
- State GDP YoY
- ▲ 3.95%
- F500 in state
- 110
Industry mix (Fortune 500 HQ in TX)
| Industry | F500 HQs | Revenue |
|---|---|---|
| Energy | 16 | $1,198B |
|
||
| Technology | 5 | $198B |
|
||
| Engineering / Construction | 4 | $72B |
|
||
| Energy Services | 3 | $60B |
|
||
| Utilities | 3 | $41B |
|
||
| Healthcare | 2 | $330B |
|
||
Price history
+38.6% since first listed8 events — show timeline
- 2026-04-09 Pending — NTREIS
- 2026-03-30 Contingent — NTREIS
- 2026-03-27 Listed $379,900 NTREIS
- 2018-07-18 Sold (Public Records) — Public Records
- 2018-07-17 Sold (MLS) — NTREIS
- 2018-05-31 Pending — NTREIS
- 2018-02-13 Listed $274,000 NTREIS
- 2017-07-31 Sold (Public Records) — Public Records
Property tax history
+42.5%/yrLatest (2025): $9,607 · +9.5% YoY. Source: county tax records.
Cash-flow waterfall
monthlySold comps — $/sqft
last 12 mo · ≤1 miLoading sold comps…