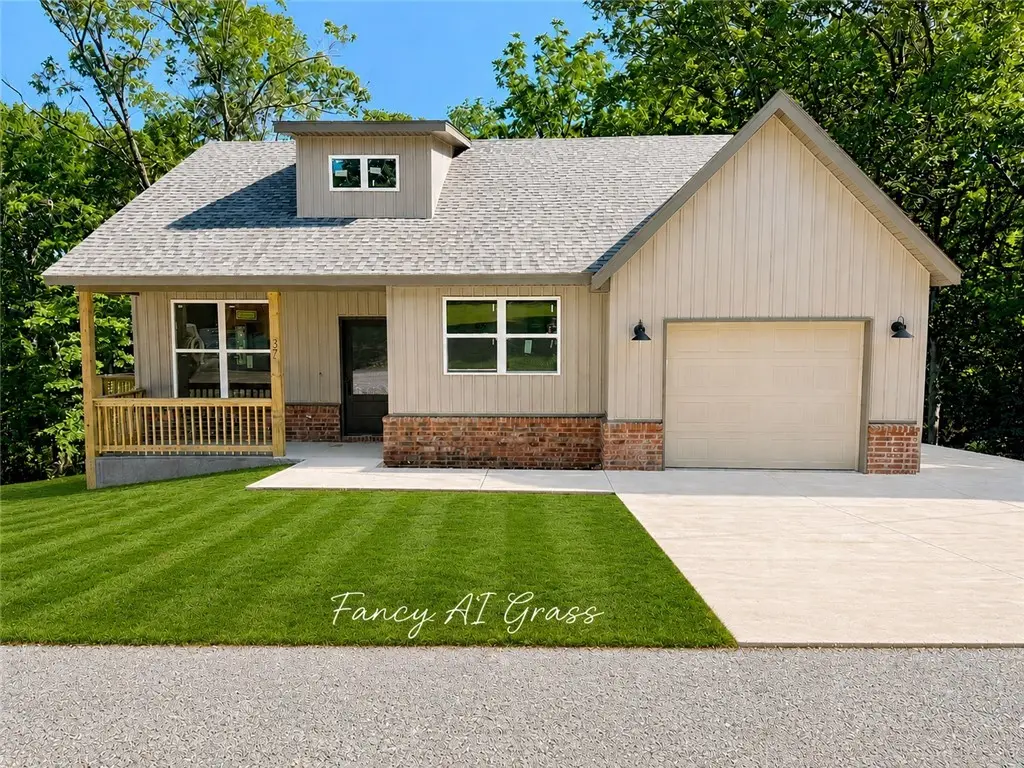
37 Harborough Dr · Bella Vista, AR
Flood risk 1/10 · Minimal
- FEMA flood zone
- X (unshaded)
- Chance of flooding over 30 yrs
- 0.0%
- Est. flood insurance / yr
- $507 – $1,088
Fire risk 3/10 · Minor
- Est. fire insurance / yr
- $1,499 – $2,785
Heat risk 4/10 · Minor
- Hot days now (above 104°F)
- 7 days/yr
- Hot days in 30 yrs
- 21 days/yr
Wind risk 2/10 · Minimal
- Chance of severe wind over 30 yrs
- 2.0%
Air-quality risk 2/10 · Minimal
- Unhealthy air days now
- 0 days/yr
- Unhealthy air days in 30 yrs
- 1 days/yr
Risk factors via First Street. Map © Google.
Why this score? — see what drove the F grade
The composite is a weighted blend of 9 inputs, each scored 0–100. Each bar is that input's sub-score; the figure is the points it added to the 100-point composite (weight × sub-score).
- Cash flow +7.4/30.0
- Appreciation +5.7/10.0
- Schools +5.2/10.0
- Livability +3.4/5.0
- Rent growth +2.5/5.0
- Condition / age +2.5/5.0
- 1% rule +2.1/10.0
- DSCR +1.6/10.0
- ARV discount +0.0/15.0
$295,000
🖨 Deal sheet (PDF) 📄 Offer letter ✓ Due diligence
Listing remarks
Don't let the size fool you—this newly built home is packed with high-end finishes and thoughtful design choices that maximize both function and style. Featuring quartz countertops, luxury vinyl plank flooring throughout, and a bright, open-concept layout, the home offers comfortable everyday living with a polished, modern aesthetic. The spacious kitchen island provides plenty of room for meal prep, entertaining, and additional seating, making it the centerpiece of the home. A one-car garage adds practical storage and convenience, while the location places you just minutes from outdoor adventure, including the Back 40 Trail. Whether you're searching for a low-maintenance primary resid
Key facts
- Quartz countertops
- One-car garage
- Open-concept layout
Tags
Property features AI
Finance
- HOA & community: Monthly association fee
Exterior
- Parking: Attached garage with garage door opener; 1 covered parking space
- Security: Smoke detector(s)
- Utilities: Electricity available; Public water; Septic available (septic tank)
- Home design: Single-story home; New construction; Crawlspace foundation
- Construction: Brick and vinyl siding exterior; Architectural shingle roof
- Exterior features: Concrete driveway; Deck; Landscaped yard; Sloped lot; Paved road access; Smoke detectors
Interior
- Kitchen: Dishwasher; Electric range; Disposal; Microwave
- Flooring: Luxury vinyl plank
- Bathrooms: 2 full bathrooms
- Heating & cooling: Central heating (electric); Central air (electric)
- Interior features: Ceiling fans; Pantry; Quartz counters; Walk-in closets
- Laundry & utility: Washer hookup; Dryer hookup; Electric water heater
Neighborhood map
What this means for you Summary
Snapshot
- This is a 2-bed/2.0-bath single-family listed at $295k.
Deal economics
- At list price, monthly cash flow is $-375 ($-4k/yr) — negative.
- To cash-flow at today's rent, offer at most $241k (18.4% below list).
- To meet the 1% rule (rent ≥ 1% of price), the offer needs to be $211k (28.6% below list).
- Recommended offer: $211k (28.6% below list) — sets the bar for 1% rule.
- Cap rate 4.8% vs local median 3.6% in Bella Vista — top-decile yield for the area; either an underpriced asset or a hidden risk that comps aren't pricing in. Stress-test before assuming the spread holds.
Location & tenants
- Location reads 67/100 on livability (#111 in AR) — a middle-class / working-renter tenant base. Strengths: cost of living A+, housing A+, schools A; Watch: amenities F, commute F, health & safety F.
- Bentonville School District (urban): math 59% / reading 59% proficiency, ranked #3 of 238 in AR (top 1%) — acceptable for families but not a draw, mixed tenant base, ~2y average lease.
- Market conditions: 475 active listings in the ZIP; 2 comparable units currently listed for rent nearby; solid renter incomes; 4,359 units permitted in Benton County in 2024 (402 in 5+ unit buildings).
Forward outlook
- In year one you build about $6k of equity ($2k loan paydown + $4k appreciation (1.4% local appreciation)).
- Benton County population projected at +56% by 2050 — long-run rental-demand tailwind backs the buy-and-hold thesis.
- By year 6, paydown + projected appreciation supports a ~$34k cash-out refi (75% LTV) — recoverable capital for the next deal without selling this one.
Negotiation context
- Only 13 days on market — expect competitive offers; lowballing is unlikely to land.
Questions for the listing agent
- What do current leases actually rent for vs. the listed asking? Can we see a recent rent roll and the last 12 months of T-12 income?
- Is there a deadline driving the sale (1031 exchange, divorce, estate, relocation)? That informs how much negotiation room exists.
- Schools are A-rated — typically a magnet for longer-tenancy family renters. What's the average tenant stay here, and is there a school-zone premium baked into asking?
- The area grade is low — what's the realistic commute time and amenity access for the typical tenant pool here? Any planned neighborhood developments (good or bad) we should know about?
- What's the average days-on-market for RENTAL listings here right now (not sales)? A rising rental-DOM trend means longer vacancies and softer asking-rent achievability than the comps imply.
- What's the recent tenant-quality profile in this submarket — average credit score on applications, eviction rate, late-payment / NSF rate, and stable-employment percentage? A property-management company in the area should have these aggregated.
- How much new for-sale + rental construction is in the pipeline within 1–3 miles? Heavy new supply typically softens prices + rents 12–24 months out; constrained supply supports both.
Investment metrics
- 1% rule
- 0.71% ✗
- Cap rate
- 4.77%
- Cash-on-cash
- -5.44%
- DSCR
- 0.76
- GRM
- 11.7
CMA / ARV
- ARV (on-the-fly)
- $246,375
- Comps found
- 4
Show comp detail 4 sales within ~0.75 mi
| Address | Dist | Beds/Ba | Sqft | Sold | Price | $/sf | Match |
|---|---|---|---|---|---|---|---|
| 45 Granshire Dr | 0.05mi | 2/2.0 | 1,030 (-6%) | 11mo | $232,000 | $225 | 79 |
| 1 Dickenshire Ln | 0.27mi | 3/2.0 (+1) | 1,140 (+4%) | 20mo | $248,000 | $218 | 58 |
| 22 Winchelsea Ln | 0.68mi | 2/2.0 | 1,106 (+1%) | 11mo | $325,000 | $294 | 57 |
| 15 Duxford Cir | 0.75mi | 2/2.0 | 1,230 (+12%) | 16mo | $245,000 | $199 | 31 |
Match score weights: distance 35% · size 25% · config 20% · recency 20%. Top-matched comps best support the ARV.
Projected returns pro-forma
1.38% appreciation · 3.0% rent growth · sell at horizon
- IRR
- -3.0%
- Equity multiple
- 0.85×
- Total profit
- $-12,715
- Equity at exit
- $106,660
- IRR
- 2.0%
- Equity multiple
- 1.25×
- Total profit
- $20,734
- Equity at exit
- $146,463
Cash invested: $82,600 (down + closing). Projections, not guarantees.
Landlord ↔ Tenant lean methodology
- Overall (STATE)
- 92 Strongly Landlord-Friendly
- State Arkansas
- 92 Strongly Landlord-Friendly · R+14
- County
- — inherits STATE
- City
- — inherits STATE
ZIP-level market 72714
- Home prices YoY
- 0.5%
- Active inventory
- 475
- Price-to-rent
- 11.7×
Monthly cashflow live
- Estimated rent
- $2,106 medium interval (Pro) →
- Mortgage (P&I)
- −$1,547
- Tax est. 1.5%
- −$369 /mo · $4,425/yr
- Insurance
- −$123
- HOA
- −$0
- Vacancy / Maint / Mgmt
- −$442
- Net cashflow
- $-375
Break-even live
Sensitivity live
| Price | -10% $-171 | -5% $-273 | +0% $-375 | +5% $-477 | +10% $-578 |
|---|---|---|---|---|---|
| Rent | -10% $-541 | -5% $-458 | +0% $-375 | +5% $-291 | +10% $-208 |
| Rate | -1.0pp $-226 | -0.5pp $-300 | base $-375 | +0.5pp $-451 | +1.0pp $-529 |
UW: 25.0% down · 7.5% · 30yr · 1.5% tax · 5.0% vac · 8.0% maint · 8.0% mgmt
Financing live
Cash to close
- Down payment
- $73,750
- Closing costs
- $8,850
- Reserves months
- —
- Total cash needed
- —
Loan-product check · same deal, 3 products live
Conventional
25% down · 7.5% · 30yr
- Down + closing
- —
- Monthly P&I
- —
- Monthly cashflow
- —
- DSCR
- —
- Eligible?
- —
Personal DTI + credit; lowest rate.
DSCR
20% down · 8.5% · 30yr
- Down + closing
- —
- Monthly P&I
- —
- Monthly cashflow
- —
- DSCR
- —
- Eligible?
- —
No personal income docs; deal must DSCR.
Hard money
10% down · 12.0% · 12mo
- Down + closing
- —
- Monthly P&I
- —
- Monthly cashflow
- —
- DSCR
- —
- Eligible?
- —
Short-term bridge; refi at stabilization.
Rent comps 2 comps
| Address | Beds | Baths | Sqft | Rent | $/sqft | DOM | Units | Dist |
|---|---|---|---|---|---|---|---|---|
| 14 Harrington Ln Unit 1241318P Bella Vista, AR | 2.0 | 2.0 | 1044 | $2,578 | $2.47 | 14d | 1 | 0.75mi |
| 30 Lunsford Ln Unit 1241312P Bella Vista, AR | 2.0 | 2.0 | 1119 | $1,842 | $1.65 | 15d | 1 | 0.94mi |
Listing history 10 events
-
2026-06-18days on market $295,000 Active 13 DOM
-
2026-06-17days on market $295,000 Active 12 DOM
-
2026-06-16days on market $295,000 Active 11 DOM
-
2026-06-15days on market $295,000 Active 10 DOM
-
2026-06-14days on market $295,000 Active 8 DOM
-
2026-06-10days on market $295,000 Active 5 DOM
-
2026-06-09days on market $295,000 Active 4 DOM
-
2026-06-08days on market $295,000 Active 3 DOM
-
2026-06-07remarks 693-char remark
-
2026-06-07$295,000 Active 2 DOM
ⓘ Source: listings_history table (triggers on properties + properties_extension) + one-shot
backfill from property_details.listing_events for pre-trigger history.
Climate risk First Street
- Flood 1/10 Low FEMA zone X (unshaded) · 0% chance over 30 yrs
- Wildfire 3/10 Moderate
- Heat 4/10 Moderate 7 d/yr ≥104°F today · 21 d/yr by 30 yrs out
- Wind 2/10 Low 2% chance of damaging wind over 30 yrs
- Air quality 2/10 Low 0 unhealthy d/yr today · 1 by 30 yrs out
Nearby sold comps map
Loading sold comps map…
Walkable amenities ~0.75 mi
Loading nearby amenities…
Taxation est. · year 1
- Rental income
- $25,277
- − Mortgage interest
- −$16,525
- − Property taxes
- −$4,425
- − Insurance
- −$1,475
- − Repairs & maintenance
- −$2,022
- − Management
- −$2,022
- − Depreciation
- −$8,582
- Taxable loss
- −$9,774
- Est. tax savings @ 24.0%
- +$2,346
- After-tax cash flow
- $-2,150/yr
For passive investors: Depreciation is non-cash, so a rental often shows a tax loss while cash-flowing — sheltering income. Rental losses are passive: they offset passive income freely, and up to $25,000/yr can offset ordinary (W-2) income if you actively participate and your MAGI is under $100k (phasing out to $0 by $150k); unused losses carry forward. On sale, claimed depreciation is recaptured at up to 25%, and gains may owe capital-gains tax (a 1031 exchange can defer both). Figures are a year-1 estimate at your 24.0% rate — not tax advice; consult a CPA.
Schools (NCES district)
- District
- Bentonville School District
- NCES district ID
- 0503060
- Math proficiency
- 59% ▼ -8.00%
- Reading proficiency
- 59% ▼ -6.00%
- Median HH income
- $66,721
- Composite
- 51.85/100
- National rank
- #1661
- State rank
- #3 of 238 in AR
Livability — Bella Vista
- Score
- 67/100
- State rank
- #111
- US rank
- #11129
Category grades
Schools grade is shown separately in the Schools card above.
Census & demographics
- Census place
- Bella Vista, AR
- County
- Benton County · 259,241 people
- City population
- 31,638
- Metro
- Fayetteville-Springdale-Rogers, AR
- Population (ZIP)
- 14,350
- Household income
- $103,125
- Rent vs Own
- Severe rent burden
- 61.0
Population outlook (Benton County) Hauer SSP2
- Today (2025)
- 318,683 people
- By 2030
- 353,481 · +10.9%
- By 2040
- 425,280 · +33.4%
- By 2050
- 497,239 · +56.0%
- By 2075
- 662,114 · +107.8%
- By 2100
- 776,431 · +143.6%
Race, ethnicity, and origin ACS 2023
- Neighborhood character
- Predominantly White (83%)
- Race & ethnicity
- White 83% Two or more races 11% Hispanic / Latino 6%
- Hispanic origin (detail)
- Mexican 2% Dominican 2%
- Common ancestry
- Slovak 4% Lithuanian 3% Italian 3%
- Foreign-born
- 3% · Canada
- Languages at home
- 98% English-only · Spanish 2%
Political lean MEDSL · Benton
- 2024 margin
- Strong R (+27.0) · D 35.2% · R 62.1% · Other 2.7%
- 2008→2024 swing
- +9.6pp toward D · 2008: -36.5pp · 2024: -27.0pp
- All cycles
- 2024: R+27.0 2020: R+26.4 2016: R+34.9 2012: R+40.4 2008: R+36.5
Not yet ingested
- Civics
- —
Market trends
- HPI YoY
- ▲ 1.38%
- Current HPI
- 307.5796
- Rent YoY
- —
- Metro
- Fayetteville-Springdale-Rogers, AR
- State GDP YoY
- ▲ 3.80%
- F500 in state
- 10
Industry mix (Fortune 500 HQ in AR)
| Industry | F500 HQs | Revenue |
|---|---|---|
| Retail | 1 | $681B |
|
||
| Food / Agriculture | 1 | $53B |
|
||
| Retail / Energy | 1 | $22B |
|
||
| Transportation / Logistics | 1 | $12B |
|
||
| Energy | 1 | $4B |
|
||
Price history
1 event — show timeline
- 2026-06-05 Listed $295,000 NWARMLS
Cash-flow waterfall
monthlySold comps — $/sqft
last 12 mo · ≤1 miLoading sold comps…