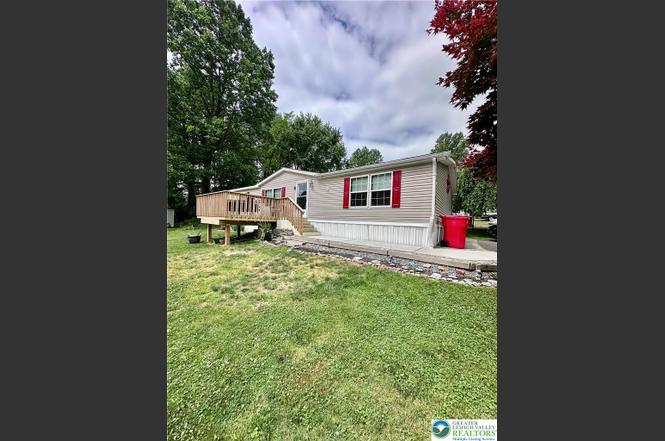
435 Mountain Village Dr · Longswamp, PA
Flood risk 4/10 · Minor
- FEMA flood zone
- X (unshaded)
- Chance of flooding over 30 yrs
- 0.24%
- Est. flood insurance / yr
- $507 – $1,088
Fire risk 5/10 · Moderate
- Est. fire insurance / yr
- $511 – $949
Heat risk 3/10 · Minor
- Hot days now (above 99°F)
- 6 days/yr
- Hot days in 30 yrs
- 13 days/yr
Wind risk 4/10 · Minor
- Chance of severe wind over 30 yrs
- 17.0%
Air-quality risk 3/10 · Minor
- Unhealthy air days now
- 2 days/yr
- Unhealthy air days in 30 yrs
- 3 days/yr
Risk factors via First Street. Map © Google.
Why this score? — see what drove the B- grade
The composite is a weighted blend of 9 inputs, each scored 0–100. Each bar is that input's sub-score; the figure is the points it added to the 100-point composite (weight × sub-score).
- Cash flow +26.2/30.0
- ARV discount +10.8/15.0
- 1% rule +10.0/10.0
- DSCR +8.8/10.0
- Schools +5.2/10.0
- Rent growth +2.5/5.0
- Livability +2.5/5.0
- Condition / age +2.5/5.0
- Appreciation +0.0/10.0
$135,000
🖨 Deal sheet 📄 Offer letter ✓ Due diligence
Listing remarks MLS
Welcome to one-floor living in the community of Mountain Village! This home features an open floor plan with 3 niced-sized bedrooms. The owner's suite boasts 2 walk-in closets and a large bathroom with a soaking tub and separate shower stall. The 2 additional bedrooms have large walk-in closets as well which provide ample storage. There is plenty of room in the kitchen to cook your favorite dishes adjacent to a nice dining area to serve your family or guests. The natural light provided by the many windows is both welcoming and cheery! Outdoors you will find a large shed for added storage and a wide driveway large enough for 2 cars. Within minutes from Bear Creek Ski Resort and close to major routes for easy commuting, this home is absolutely worth viewing!
Key facts
- 2 garage spots
- Built 2009
- Listed 8 days
Property features AI
Finance
- HOA & community: Monthly association fee of $675
Exterior
- Parking: Two-car garage; Driveway
- Utilities: Community/Co-op water; Community/Co-op sewer; Electric water heater
- Home design: Single-story property
- Construction: Vinyl siding; Asphalt/fiberglass roof
- Exterior features: Porch; Shed; Shed(s); Mobile home on the lot
Interior
- Kitchen: Includes refrigerator; Dishwasher
- Bedrooms: Three bedrooms located on the first floor (approx. 11 x 13; 10 x 13; 15 x 13)
- Heating & cooling: Forced air heating; Central air conditioning
- Interior features: Dining area with a separate/formal dining room
- Laundry & utility: Washer and electric dryer (electric dryer hookup); Electric water heater
Neighborhood map
What this means for you Summary
Snapshot
- This is a 3-bed/2.0-bath manufactured listed at $135k.
Deal economics
- At list price, monthly cash flow is $343 ($4k/yr) — positive.
- The deal already cash-flows at list — no discount required.
- Meets the 1% rule at list price ($2k rent vs $135k).
Location & tenants
- Location reads: area grade B — affects rentability + tenant quality, not the cash-flow math above.
- Brandywine Heights Area SD (suburban): math 48% / reading 66% proficiency, ranked #241 of 658 in PA (top 37%) — acceptable for families but not a draw, mixed tenant base, ~2y average lease; only 20% free/reduced lunch — higher-income household profile.
- Market conditions: Rents flat; 157 active listings in the ZIP; high-income renter base; 258 units permitted in Berks County in 2024 (27 in 5+ unit buildings).
Forward outlook
- Local home prices are declining (-3.0%/yr); year-one equity from $933 of loan paydown is wiped out by about $4k of value loss. Plan a longer hold.
- Berks County population projected at +3% by 2050 — modest demand growth; plan on rents tracking national, not racing it.
Negotiation context
- Only 8 days on market — expect competitive offers; lowballing is unlikely to land.
- 7 sale attempts since 10y ago with the ask held roughly flat each time — persistent listings suggest the price (not the market) is what's stuck; bring a comps-based counter.
- Current owner paid $107k; 26% above their basis — modest negotiation headroom, anchor on the comps not their cost.
Risks & watch-outs
- Watch-outs: HOA is 27% of rent.
- Climate carrying-cost: moderate wildfire risk — expect insurance premiums to compound above CPI over the hold.
Questions for the listing agent
- What does the HOA fee cover, when was the last increase, and are there any pending special assessments or reserve-fund shortfalls?
- Is there a deadline driving the sale (1031 exchange, divorce, estate, relocation)? That informs how much negotiation room exists.
- What's the average days-on-market for RENTAL listings here right now (not sales)? A rising rental-DOM trend means longer vacancies and softer asking-rent achievability than the comps imply.
- What's the recent tenant-quality profile in this submarket — average credit score on applications, eviction rate, late-payment / NSF rate, and stable-employment percentage? A property-management company in the area should have these aggregated.
- How much new for-sale + rental construction is in the pipeline within 1–3 miles? Heavy new supply typically softens prices + rents 12–24 months out; constrained supply supports both.
Investment metrics
- 1% rule
- 1.85% ✓
- Cap rate
- 9.34%
- Cash-on-cash
- 10.89%
- DSCR
- 1.48
- GRM
- 4.5
CMA / ARV
- ARV (on-the-fly)
- $145,600
- Comps found
- 1
Show comp detail 1 sale within ~0.75 mi
| Address | Dist | Beds/Ba | Sqft | Sold | Price | $/sf | Match |
|---|---|---|---|---|---|---|---|
| 194 Haddon Dr | 0.26mi | 3/2.0 | 1,344 (-8%) | 2mo | $133,900 | $100 | 73 |
Match score weights: distance 35% · size 25% · config 20% · recency 20%. Top-matched comps best support the ARV.
Projected returns pro-forma
-3.0% appreciation · 0.13% rent growth · sell at horizon
- IRR
- -4.9%
- Equity multiple
- 0.83×
- Total profit
- $-6,576
- Equity at exit
- $20,129
- IRR
- -1.4%
- Equity multiple
- 0.92×
- Total profit
- $-2,870
- Equity at exit
- $11,672
Cash invested: $37,800 (down + closing). Projections, not guarantees.
Landlord ↔ Tenant lean methodology
- Overall (STATE)
- 62 Landlord-Friendly
- State Pennsylvania
- 62 Landlord-Friendly · EVEN
- County
- — inherits STATE
- City
- — inherits STATE
ZIP-level market 18062
- Home prices YoY
- -26.4%
- Rents YoY
- 0.1%
- Active inventory
- 157
- Price-to-rent
- 4.5×
Monthly cashflow live
- Estimated rent
- $2,498 medium interval (Pro) →
- Mortgage (P&I)
- −$708
- Tax from tax record
- −$191 /mo · $2,292/yr
- Insurance
- −$56
- HOA
- −$675
- Vacancy / Maint / Mgmt
- −$525
- Net cashflow
- $343
Break-even live
UW: 25.0% down · 7.5% · 30yr · 1.5% tax · 5.0% vac · 8.0% maint · 8.0% mgmt
Financing live
Cash to close
- Down payment
- $33,750
- Closing costs
- $4,050
- Reserves months
- —
- Total cash needed
- —
Loan-product check · same deal, 3 products live
Conventional
25% down · 7.5% · 30yr
- Down + closing
- —
- Monthly P&I
- —
- Monthly cashflow
- —
- DSCR
- —
- Eligible?
- —
Personal DTI + credit; lowest rate.
DSCR
20% down · 8.5% · 30yr
- Down + closing
- —
- Monthly P&I
- —
- Monthly cashflow
- —
- DSCR
- —
- Eligible?
- —
No personal income docs; deal must DSCR.
Hard money
10% down · 12.0% · 12mo
- Down + closing
- —
- Monthly P&I
- —
- Monthly cashflow
- —
- DSCR
- —
- Eligible?
- —
Short-term bridge; refi at stabilization.
HOA detail
- Monthly dues
- $675 · $8,100/yr
Listing history 7 events
-
2026-06-18days on market $135,000 Active 8 DOM
-
2026-06-17days on market $135,000 Active 7 DOM
-
2026-06-16days on market $135,000 Active 6 DOM
-
2026-06-15days on market $135,000 Active 5 DOM
-
2026-06-14days on market $135,000 Active 3 DOM
-
2026-06-13remarks 699-char remark
-
2026-06-13$135,000 Active 2 DOM
ⓘ Source: listings_history table (triggers on properties + properties_extension) + one-shot
backfill from property_details.listing_events for pre-trigger history.
Tax reassessment forecast PA · Partial reset (capped growth)
- Current annual tax
- $2,292 · $191/mo
- Projected year-2 tax
- $2,292 · $191/mo
- Expected delta
- $0/yr ($0/mo · 0.0%)
ⓘ Screening estimate from a state-policy table — verify with the county assessor before closing.
Climate risk First Street
- Flood 4/10 Moderate FEMA zone X (unshaded) · 24% chance over 30 yrs
- Wildfire 5/10 Major
- Heat 3/10 Moderate 6 d/yr ≥99°F today · 13 d/yr by 30 yrs out
- Wind 4/10 Moderate 17% chance of damaging wind over 30 yrs
- Air quality 3/10 Moderate 2 unhealthy d/yr today · 3 by 30 yrs out
Nearby sold comps map
Loading sold comps map…
Walkable amenities ~0.75 mi
Loading nearby amenities…
Taxation est. · year 1
- Rental income
- $29,973
- − Mortgage interest
- −$7,562
- − Property taxes
- −$2,292
- − Insurance
- −$675
- − Repairs & maintenance
- −$2,398
- − Management
- −$2,398
- − HOA
- −$8,100
- − Depreciation
- −$3,927
- Taxable income
- $2,621
- Est. tax owed @ 24.0%
- −$629
- After-tax cash flow
- $3,487/yr
For passive investors: Depreciation is non-cash, so a rental often shows a tax loss while cash-flowing — sheltering income. Rental losses are passive: they offset passive income freely, and up to $25,000/yr can offset ordinary (W-2) income if you actively participate and your MAGI is under $100k (phasing out to $0 by $150k); unused losses carry forward. On sale, claimed depreciation is recaptured at up to 25%, and gains may owe capital-gains tax (a 1031 exchange can defer both). Figures are a year-1 estimate at your 24.0% rate — not tax advice; consult a CPA.
Schools (NCES district)
- District
- Brandywine Heights Area SD
- NCES district ID
- 4204050
- Math proficiency
- 48% ▲ 1.00%
- Reading proficiency
- 66% ▼ -1.00%
- Median HH income
- $62,904
- Composite
- 51.52/100
- National rank
- #3670
- State rank
- #241 of 658 in PA
Livability — Longswamp
No livability data for this city. (Only ~50 U.S. cities are tracked.)
Census & demographics
- County
- Lehigh County · 333,019 people
- Metro
- Allentown-Bethlehem-Easton, PA-NJ
- Population (ZIP)
- 27,110
- Household income
- $110,675
- Rent vs Own
- Severe rent burden
- 537.0
Population outlook (Berks County) Hauer SSP2
- Today (2025)
- 425,767 people
- By 2030
- 428,814 · +0.7%
- By 2040
- 433,463 · +1.8%
- By 2050
- 439,426 · +3.2%
- By 2075
- 478,647 · +12.4%
- By 2100
- 518,507 · +21.8%
Race, ethnicity, and origin ACS 2023
- Neighborhood character
- Predominantly White (77%)
- Race & ethnicity
- White 77% Hispanic / Latino 10% Two or more races 10% Asian 5% Black 3%
- Hispanic origin (detail)
- Puerto Rican 4% Dominican 2%
- Common ancestry
- Romanian 5% Lithuanian 2% Subsaharan African 2%
- Foreign-born
- 11% · Canada, China, Jamaica
- Languages at home
- 83% English-only · Spanish 7% Other Indo-European 4% French/Haitian/Cajun 2%
Political lean MEDSL · Berks
- 2024 margin
- R (+12.2) · D 43.4% · R 55.6%
- 2008→2024 swing
- -21.4pp toward R · 2008: 9.2pp · 2024: -12.2pp
- All cycles
- 2024: R+12.2 2020: R+8.2 2016: R+10.2 2012: R+0.6 2008: D+9.2
Not yet ingested
- Civics
- —
Market trends
- HPI YoY
- ▼ -91.04%
- Current HPI
- 253.5939
- Rent YoY
- ▲ 0.13%
- Metro
- Allentown-Bethlehem-Easton, PA-NJ
- State GDP YoY
- ▲ 1.68%
- F500 in state
- 34
Industry mix (Fortune 500 HQ in PA)
| Industry | F500 HQs | Revenue |
|---|---|---|
| Healthcare | 2 | $309B |
|
||
| Insurance | 2 | $27B |
|
||
| Telecommunications / Media | 1 | $124B |
|
||
| Industrial Distribution | 1 | $22B |
|
||
| Financial Services | 1 | $20B |
|
||
| Chemicals / Materials | 1 | $18B |
|
||
Price history
+110.9% since first listed19 events — show timeline
- 2026-06-10 Listed $135,000 GLVRMLS
- 2023-12-15 Sold (MLS) $106,900 BRIGHT MLS
- 2023-12-15 Sold (MLS) $106,900 GLVRMLS
- 2023-12-06 Pending — GLVRMLS
- 2023-12-05 Pending — BRIGHT MLS
- 2023-11-14 Contingent — GLVRMLS
- 2023-11-14 Contingent — BRIGHT MLS
- 2023-11-11 Relisted — BRIGHT MLS
- 2023-11-11 Relisted — GLVRMLS
- 2023-11-02 Pending — GLVRMLS
- 2023-11-02 Pending — BRIGHT MLS
- 2023-10-27 Listed $119,900 BRIGHT MLS
- 2023-10-27 Listed $119,900 GLVRMLS
- 2016-08-02 Sold (MLS) $62,000 BRIGHT MLS
- 2016-08-02 Sold (MLS) $62,000 TREND
- 2016-06-16 Pending — TREND
- 2016-05-20 Delisted — TREND
- 2016-03-14 Listed $64,000 TREND
- 2016-03-14 Listed $64,000 BRIGHT MLS
Property tax history
+11.4%/yrLatest (2026): $2,292 · +0.0% YoY. Source: county tax records.
Cash-flow waterfall
monthlySold comps — $/sqft
last 12 mo · ≤1 miLoading sold comps…