 7-Plex
7603 Alcove Ave Unit A-D · Lubbock, TX
Flood risk 6/10 · Moderate
- FEMA flood zone
- X (unshaded)
- Chance of flooding over 30 yrs
- 0.67%
- Est. flood insurance / yr
- $507 – $1,088
Fire risk 7/10 · Major
- Est. fire insurance / yr
- $1,222 – $2,270
Heat risk 5/10 · Moderate
- Hot days now (above 99°F)
- 6 days/yr
- Hot days in 30 yrs
- 18 days/yr
Wind risk 2/10 · Minimal
- Chance of severe wind over 30 yrs
- 0.0%
Air-quality risk 2/10 · Minimal
- Unhealthy air days now
- 1 days/yr
- Unhealthy air days in 30 yrs
- 1 days/yr
Risk factors via First Street. Map © Google.
Why this score? — see what drove the C grade
The composite is a weighted blend of 9 inputs, each scored 0–100. Each bar is that input's sub-score; the figure is the points it added to the 100-point composite (weight × sub-score).
- Cash flow +22.8/30.0
- ARV discount +7.5/15.0
- DSCR +7.3/10.0
- 1% rule +5.9/10.0
- Schools +4.4/10.0
- Livability +4.0/5.0
- Rent growth +2.5/5.0
- Condition / age +1.0/5.0
- Appreciation +0.0/10.0
$1,100,000
🖨 Deal sheet 📄 Offer letter ✓ Due diligence
Multi-family units
County records classify this as Multi-Family (5+ Unit). Listing-text estimate: 7 units. confirmed
5+ unit building — per-unit beds/baths from public records are typically unavailable; the breakdown below (if shown) is an estimate from the listing text.
Listing remarks MLS
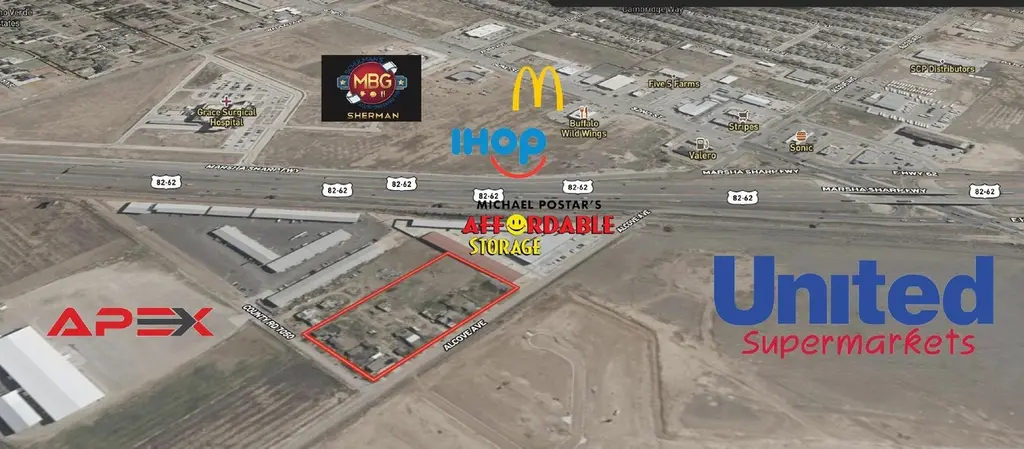
Prime 4± acres on Alcove Ave with immediate access to US-82/62 (Marsha Sharp Fwy) in a fast-growing corridor. United Supermarkets is planned across the street, and Alcove Ave is scheduled to be widened, enhancing visibility and access. The property is currently improved with nine rental houses producing approximately \ $8,450 per month, providing reliable income while you design and entitle your project. Surrounded by established retail and dining, this site is well-positioned for future retail pads, a neighborhood center, restaurants, or other service-oriented commercial uses. Redevelop on your timeline and let the existing cash flow carry the site until you're ready.
Key facts
- 4 acre lot
- Built 1956
- Listed 258 days
Neighborhood map
What this means for you Summary
Snapshot
- This is a 7 × 3-bed/?-bath units multifamily listed at $1.10M. Condition is rated poor.
Deal economics
- At list price, monthly cash flow is $2k ($23k/yr) — positive. Per door: $272/mo.
- The deal already cash-flows at list — no discount required.
- Meets the 1% rule at list price ($12k rent vs $1.10M).
- Recommended offer: $968k (12.0% below list) — sets the bar for market timing.
Location & tenants
- Location reads 80/100 on livability (#37 in TX, #1,749 nationally) — a professional / high-income tenant draw. Strengths: commute A+, cost of living A+, housing A+; Watch: employment C-, schools D+, crime F.
- Frenship ISD (urban): math 47% / reading 54% proficiency, ranked #162 of 826 in TX (top 20%) — acceptable for families but not a draw, mixed tenant base, ~2y average lease.
- Market conditions: Rents soft (-0.1%/yr); 610 active listings in the ZIP; 2,219 units permitted in Lubbock County in 2024 (252 in 5+ unit buildings).
- At $12,034/mo this rent would consume 235% of the median local household income ($62k/yr) (locally 1914% of renters already pay >50% of income on rent) — very limited rent-growth headroom before tenants either downsize or default.
Forward outlook
- Local home prices are declining (-3.0%/yr); year-one equity from $8k of loan paydown is wiped out by about $33k of value loss. Plan a longer hold.
- Lubbock County population projected at +39% by 2050 — long-run rental-demand tailwind backs the buy-and-hold thesis.
Negotiation context
- It's been on market 258 days — a 12% lower offer ($968k) is reasonable based on typical stale-listing flexibility.
Risks & watch-outs
- Watch-outs: built in 1956 — expect roof / HVAC / electrical / plumbing capex.
- Climate carrying-cost: major flood risk; major wildfire risk; extreme-heat days projected 6→18/yr by 2055 (HVAC capex compounding) — expect insurance premiums to compound above CPI over the hold.
Questions for the listing agent
- It's been on market 258 days. Have you received any prior offers? Is the seller open to a 12% concession, seller financing, or rate buy-down credit?
- Can we see the unit-by-unit rent roll, current vacancy, and any below-market leases? What's the average tenancy length?
- What capital expenditures (roof, boiler, parking lot, exteriors) have been made in the last 5 years, and what's planned in the next 2?
- Have any recent inspections been done? Can we get a copy of the seller's disclosures and any deferred-maintenance estimates?
- Built in 1956 — when were the roof, HVAC, electrical panel, plumbing, and water heater last replaced?
- Why hasn't it sold? Are there any deal-killer items the seller is aware of (foundation, flood, title, zoning, code violations)?
- Is there a deadline driving the sale (1031 exchange, divorce, estate, relocation)? That informs how much negotiation room exists.
- Schools are D-rated, which usually means shorter tenancies and higher turnover. Who's the typical renter profile here, and what's been the actual vacancy rate?
- Crime grade is F in this area — have there been break-ins, vandalism, or insurance claims at this property in the last 3 years? What carrier currently insures it and at what premium?
- What's the average days-on-market for RENTAL listings here right now (not sales)? A rising rental-DOM trend means longer vacancies and softer asking-rent achievability than the comps imply.
- What's the recent tenant-quality profile in this submarket — average credit score on applications, eviction rate, late-payment / NSF rate, and stable-employment percentage? A property-management company in the area should have these aggregated.
- How much new apartment / multifamily construction is in the pipeline within 1–3 miles? Heavy new supply (>2% of stock underway) typically softens rents 12–24 months out; light construction supports rent growth.
Investment metrics
- 1% rule
- 1.09% ✓
- Cap rate
- 8.37%
- Cash-on-cash
- 7.42%
- DSCR
- 1.33
- GRM
- 7.6
CMA / ARV
No comps found within radius.
Projected returns pro-forma
-3.0% appreciation · 0.0% rent growth · sell at horizon
- IRR
- -8.4%
- Equity multiple
- 0.70×
- Total profit
- $-92,002
- Equity at exit
- $164,014
- IRR
- -3.3%
- Equity multiple
- 0.81×
- Total profit
- $-59,436
- Equity at exit
- $95,108
Cash invested: $308,000 (down + closing). Projections, not guarantees.
Landlord ↔ Tenant lean methodology
- Overall (STATE)
- 87 Strongly Landlord-Friendly
- State Texas
- 87 Strongly Landlord-Friendly · R+5
- County
- — inherits STATE
- City
- — inherits STATE
ZIP-level market 79407
- Home prices YoY
- -16.3%
- Rents YoY
- -0.1%
- Active inventory
- 610
- Price-to-rent
- 53.3×
Monthly cashflow live
- Estimated rent
- $12,034 high interval (Pro) →
- Mortgage (P&I)
- −$5,769
- Tax est. 1.5%
- −$1,375 /mo · $16,500/yr
- Insurance
- −$458
- HOA
- −$0
- Vacancy / Maint / Mgmt
- −$2,527
- Net cashflow
- $1,905
Break-even live
7-unit breakdown (identical units grouped — click to expand)
| Units | Beds | Baths | Est. rent |
|---|---|---|---|
| 7× units | 3 | — | $12,033 |
| #1 | 3 | — | $1,719 |
| #2 | 3 | — | $1,719 |
| #3 | 3 | — | $1,719 |
| #4 | 3 | — | $1,719 |
| #5 | 3 | — | $1,719 |
| #6 | 3 | — | $1,719 |
| #7 | 3 | — | $1,719 |
| Total (7 units) | $12,034 | ||
UW: 25.0% down · 7.5% · 30yr · 1.5% tax · 5.0% vac · 8.0% maint · 8.0% mgmt
Financing live
Cash to close
- Down payment
- $275,000
- Closing costs
- $33,000
- Reserves months
- —
- Total cash needed
- —
Loan-product check · same deal, 3 products live
Conventional
25% down · 7.5% · 30yr
- Down + closing
- —
- Monthly P&I
- —
- Monthly cashflow
- —
- DSCR
- —
- Eligible?
- —
Personal DTI + credit; lowest rate.
DSCR
20% down · 8.5% · 30yr
- Down + closing
- —
- Monthly P&I
- —
- Monthly cashflow
- —
- DSCR
- —
- Eligible?
- —
No personal income docs; deal must DSCR.
Hard money
10% down · 12.0% · 12mo
- Down + closing
- —
- Monthly P&I
- —
- Monthly cashflow
- —
- DSCR
- —
- Eligible?
- —
Short-term bridge; refi at stabilization.
Listing history 16 events
-
2026-06-18days on market $1,100,000 Active 258 DOM
-
2026-06-17days on market $1,100,000 Active 257 DOM
-
2026-06-16days on market $1,100,000 Active 256 DOM
-
2026-06-15days on market $1,100,000 Active 255 DOM
-
2026-06-13days on market $1,100,000 Active 252 DOM
-
2026-06-10days on market $1,100,000 Active 250 DOM
-
2026-06-09days on market $1,100,000 Active 249 DOM
-
2026-06-08days on market $1,100,000 Active 248 DOM
-
2026-06-07days on market $1,100,000 Active 247 DOM
-
2026-06-05days on market $1,100,000 Active 244 DOM
-
2026-06-03days on market $1,100,000 Active 243 DOM
-
2026-06-02days on market $1,100,000 Active 242 DOM
-
2026-06-01days on market $1,100,000 Active 241 DOM
-
2026-05-31days on market $1,100,000 Active 240 DOM
-
2026-05-30days on market $1,100,000 Active 239 DOM
-
2025-10-03$1,100,000 Active 685-char remark
Show marketing remark (685 chars)
Prime 4± acres on Alcove Ave with immediate access to US-82/62 (Marsha Sharp Fwy) in a fast-growing corridor. United Supermarkets is planned across the street, and Alcove Ave is scheduled to be widened, enhancing visibility and access. The property is currently improved with nine rental houses producing approximately \ $8,450 per month, providing reliable income while you design and entitle your project. Surrounded by established retail and dining, this site is well-positioned for future retail pads, a neighborhood center, restaurants, or other service-oriented commercial uses. Redevelop on your timeline and let the existing cash flow carry the site until you're ready.
ⓘ Source: listings_history table (triggers on properties + properties_extension) + one-shot
backfill from property_details.listing_events for pre-trigger history.
Climate risk First Street
- Flood 6/10 Major FEMA zone X (unshaded) · 67% chance over 30 yrs
- Wildfire 7/10 Severe
- Heat 5/10 Major 6 d/yr ≥99°F today · 18 d/yr by 30 yrs out
- Wind 2/10 Low 0% chance of damaging wind over 30 yrs
- Air quality 2/10 Low 1 unhealthy d/yr today · 1 by 30 yrs out
Nearby sold comps map
Loading sold comps map…
Walkable amenities ~0.75 mi
Loading nearby amenities…
Taxation est. · year 1
- Rental income
- $144,408
- − Mortgage interest
- −$61,617
- − Property taxes
- −$16,500
- − Insurance
- −$5,500
- − Repairs & maintenance
- −$11,553
- − Management
- −$11,553
- − Depreciation
- −$32,000
- Taxable income
- $5,686
- Est. tax owed @ 24.0%
- −$1,365
- After-tax cash flow
- $21,496/yr
For passive investors: Depreciation is non-cash, so a rental often shows a tax loss while cash-flowing — sheltering income. Rental losses are passive: they offset passive income freely, and up to $25,000/yr can offset ordinary (W-2) income if you actively participate and your MAGI is under $100k (phasing out to $0 by $150k); unused losses carry forward. On sale, claimed depreciation is recaptured at up to 25%, and gains may owe capital-gains tax (a 1031 exchange can defer both). Figures are a year-1 estimate at your 24.0% rate — not tax advice; consult a CPA.
Condition & rehab AI · 2 photos
This multi-family property requires extensive repairs and maintenance, including roof replacement and exterior siding repair, to improve its condition and value.
Repairs flagged
- Major roof — Significant damage and potential leaks.
- Major exterior siding — Visible damage and wear.
- Major HVAC/mechanicals — No photos available, but likely in poor condition.
- Major interior walls/paint — No photos available, but likely in poor condition.
- Major landscaping — Overgrown and in need of maintenance.
- Major windows — No photos available, but likely in poor condition.
Value-add opportunities
- Both roof replacement — Critical to the structural integrity and safety of the property.
- Both exterior siding repair — Improves the property's appearance and value.
- Both HVAC system upgrade — Enhances comfort and energy efficiency, attracting tenants.
- Both interior paint and repairs — Improves the property's appearance and value.
- Both landscaping and curb appeal improvements — Enhances the property's curb appeal and value.
- Both window repairs or replacements — Improves the property's appearance and value.
Renovation cost estimate screening
| Repair item | Severity | Est. cost |
|---|---|---|
| roof · Significant damage and potential leaks. | Major | $15,000–50,000 |
| exterior siding · Visible damage and wear. | Major | $15,000–50,000 |
| HVAC/mechanicals · No photos available, but likely in poor condition. | Major | $15,000–50,000 |
| interior walls/paint · No photos available, but likely in poor condition. | Major | $15,000–50,000 |
| landscaping · Overgrown and in need of maintenance. | Major | $15,000–50,000 |
| windows · No photos available, but likely in poor condition. | Major | $15,000–50,000 |
| Total estimated repair cost · 6 items | $90,000–300,000 |
Value-add ROI direction
- Both roof replacement — Critical to the structural integrity and safety of the property. ↑
- Both exterior siding repair — Improves the property's appearance and value. ↑
- Both HVAC system upgrade — Enhances comfort and energy efficiency, attracting tenants. ↑
- Both interior paint and repairs — Improves the property's appearance and value. ↑
- Both landscaping and curb appeal improvements — Enhances the property's curb appeal and value. ↑
- Both window repairs or replacements — Improves the property's appearance and value. ↑
ⓘ Cost ranges are severity-bucket heuristics (US national rule-of-thumb). Get contractor quotes + a written scope before underwriting a rehab budget.
Schools (NCES district)
- District
- Frenship ISD
- NCES district ID
- 4819830
- Math proficiency
- 47% ▼ -8.00%
- Reading proficiency
- 54% ▬ 0.00%
- Median HH income
- $54,376
- Composite
- 43.59/100
- National rank
- #2976
- State rank
- #162 of 826 in TX
Livability — Lubbock
- Score
- 80/100
- State rank
- #37
- US rank
- #1749
Category grades
Schools grade is shown separately in the Schools card above.
Census & demographics
- Census place
- Lubbock, TX
- County
- Lubbock County · 293,542 people
- City population
- 283,030
- Metro
- Lubbock, TX
- Population (ZIP)
- 24,000
- Household income
- $61,509
- Rent vs Own
- Severe rent burden
- 1914.0
Population outlook (Lubbock County) Hauer SSP2
- Today (2025)
- 345,960 people
- By 2030
- 371,449 · +7.4%
- By 2040
- 424,539 · +22.7%
- By 2050
- 481,150 · +39.1%
- By 2075
- 633,467 · +83.1%
- By 2100
- 746,853 · +115.9%
Race, ethnicity, and origin ACS 2023
- Neighborhood character
- Diverse neighborhood (Simpson 0.56)
- Race & ethnicity
- White 58% Hispanic / Latino 31% Two or more races 17% Black 4% Asian 3%
- Hispanic origin (detail)
- Mexican 27%
- Common ancestry
- Italian 2% Lithuanian 1% Slovak 1%
- Foreign-born
- 5% · Canada, South Korea, China
- Languages at home
- 83% English-only · Spanish 13% Other Asian/Pacific 1% Chinese 1%
Political lean MEDSL · Lubbock
- 2024 margin
- Solid R (+39.5) · D 29.7% · R 69.2% · Other 1.0%
- 2008→2024 swing
- -2.8pp toward R · 2008: -36.7pp · 2024: -39.5pp
- All cycles
- 2024: R+39.5 2020: R+32.2 2016: R+38.4 2012: R+40.9 2008: R+36.7
Not yet ingested
- Civics
- —
Market trends
- HPI YoY
- ▼ -44.87%
- Current HPI
- 229.9895
- Rent YoY
- ▼ -0.07%
- Metro
- Lubbock, TX
- State GDP YoY
- ▲ 3.95%
- F500 in state
- 110
Industry mix (Fortune 500 HQ in TX)
| Industry | F500 HQs | Revenue |
|---|---|---|
| Energy | 16 | $1,198B |
|
||
| Technology | 5 | $198B |
|
||
| Engineering / Construction | 4 | $72B |
|
||
| Energy Services | 3 | $60B |
|
||
| Utilities | 3 | $41B |
|
||
| Healthcare | 2 | $330B |
|
||
Price history
1 event — show timeline
- 2025-10-03 Listed $1,100,000 LARMLS
Cash-flow waterfall
monthlySold comps — $/sqft
last 12 mo · ≤1 miLoading sold comps…