 Triplex
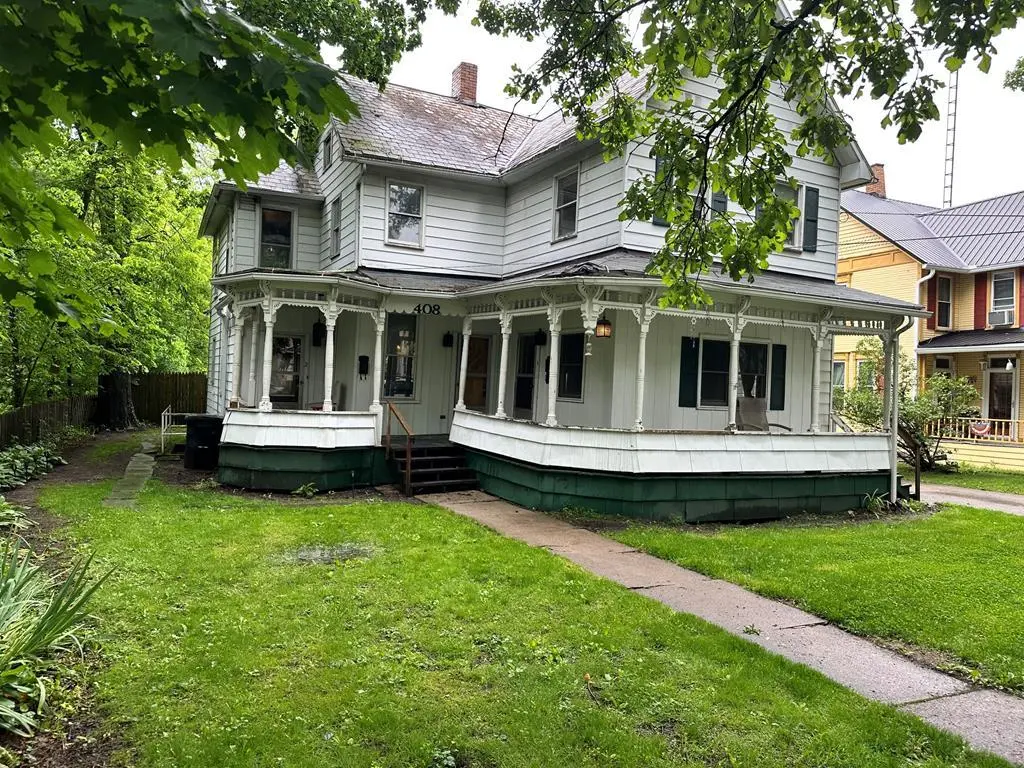
408 N Columbus St · Galion, OH
Flood risk 5/10 · Moderate
- FEMA flood zone
- X (unshaded)
- Chance of flooding over 30 yrs
- 0.24%
- Est. flood insurance / yr
- $473 – $860
Fire risk 1/10 · Minimal
- Est. fire insurance / yr
- $713 – $1,323
Heat risk 3/10 · Minor
- Hot days now (above 98°F)
- 7 days/yr
- Hot days in 30 yrs
- 17 days/yr
Wind risk 2/10 · Minimal
- Chance of severe wind over 30 yrs
- —
Air-quality risk 2/10 · Minimal
- Unhealthy air days now
- 1 days/yr
- Unhealthy air days in 30 yrs
- 1 days/yr
Risk factors via First Street. Map © Google.
Why this score? — see what drove the B- grade
The composite is a weighted blend of 9 inputs, each scored 0–100. Each bar is that input's sub-score; the figure is the points it added to the 100-point composite (weight × sub-score).
- Cash flow +30.0/30.0
- 1% rule +10.0/10.0
- DSCR +10.0/10.0
- ARV discount +7.5/15.0
- Schools +3.8/10.0
- Livability +3.2/5.0
- Rent growth +2.5/5.0
- Condition / age +2.5/5.0
- Appreciation +0.0/10.0
$89,900
🖨 Deal sheet (PDF) 📄 Offer letter ✓ Due diligence
Multi-family units
County records classify this as Multi-Family (2-4 Unit). Listing-text estimate: 3 units. confirmed
Listing remarks
Multi-family property featuring 2 income-producing units: Unit 1: Spacious 6-bedroom, 2-story unit 2bath Unit 2: 1-bedroom lower-level 1bath Current tenant income: $14,400 annually Approximate yearly expenses: $1,953.71 Great potential for investors looking to expand their portfolio with strong rental space.
Key facts
- Built 1890
- Listed 6 days
Property features AI
Finance
- Other: Directions: Take Sherman Street to North Columbus.
Exterior
- Parking: Concrete parking; On-street parking
- Utilities: Public water; Public sewer
- Home design: Multi-family residential income property; 2 stories
- Construction: Aluminum siding construction
- Exterior features: Aluminum siding
Interior
- Heating & cooling: Forced air heating; Property has heating
- Interior features: Full basement
Neighborhood map
What this means for you Summary
Snapshot
- This is a 3 × 1-bed/?-bath units multifamily listed at $90k.
Deal economics
- At list price, monthly cash flow is $1k ($14k/yr) — positive. Per door: $397/mo.
- The deal already cash-flows at list — no discount required.
- Meets the 1% rule at list price ($2k rent vs $90k).
- Cap rate 22.2% vs local median 4.8% in Galion — top-decile yield for the area; either an underpriced asset or a hidden risk that comps aren't pricing in. Stress-test before assuming the spread holds.
Location & tenants
- Location reads 63/100 on livability (#833 in OH) — a middle-class / working-renter tenant base. Strengths: cost of living A+, housing A+, crime A-; Watch: schools C-, amenities F, commute F.
- Galion City (town): math 36% / reading 56% proficiency, ranked #499 of 656 in OH (top 76%) — families likely to look elsewhere, expect single-tenant / working-renter base with shorter leases.
- Market conditions: 76 active listings in the ZIP; 8 units permitted in Crawford County in 2024 (0 in 5+ unit buildings).
- At $2,266/mo this rent would consume 48% of the median local household income ($57k/yr) — very limited rent-growth headroom before tenants either downsize or default.
Forward outlook
- Local home prices are declining (-3.0%/yr); year-one equity from $622 of loan paydown is wiped out by about $3k of value loss. Plan a longer hold.
- Crawford County population projected at -22% by 2050 — secular population decline; favor cash flow + early exit over multi-decade hold.
- At projected returns (-3.0% appreciation + 3.0% rent growth), your $25k cash investment doubles in ~2 years — after that, you're playing with house money.
Negotiation context
- Only 6 days on market — expect competitive offers; lowballing is unlikely to land.
- Current owner paid $58k; list at $90k implies a 54% gain — meaningful room to come down on a strong offer.
Risks & watch-outs
- Watch-outs: built in 1890 — expect roof / HVAC / electrical / plumbing capex.
- Climate carrying-cost: moderate flood risk — expect insurance premiums to compound above CPI over the hold.
Questions for the listing agent
- Can we see the unit-by-unit rent roll, current vacancy, and any below-market leases? What's the average tenancy length?
- What capital expenditures (roof, boiler, parking lot, exteriors) have been made in the last 5 years, and what's planned in the next 2?
- Built in 1890 — when were the roof, HVAC, electrical panel, plumbing, and water heater last replaced?
- Is there a deadline driving the sale (1031 exchange, divorce, estate, relocation)? That informs how much negotiation room exists.
- What's the average days-on-market for RENTAL listings here right now (not sales)? A rising rental-DOM trend means longer vacancies and softer asking-rent achievability than the comps imply.
- What's the recent tenant-quality profile in this submarket — average credit score on applications, eviction rate, late-payment / NSF rate, and stable-employment percentage? A property-management company in the area should have these aggregated.
- How much new apartment / multifamily construction is in the pipeline within 1–3 miles? Heavy new supply (>2% of stock underway) typically softens rents 12–24 months out; light construction supports rent growth.
Investment metrics
- 1% rule
- 2.52% ✓
- Cap rate
- 22.20%
- Cash-on-cash
- 56.83%
- DSCR
- 3.53
- GRM
- 3.3
CMA / ARV
No comps found within radius.
Projected returns pro-forma
-3.0% appreciation · 3.0% rent growth · sell at horizon
- IRR
- 55.3%
- Equity multiple
- 3.44×
- Total profit
- $61,372
- Equity at exit
- $13,404
- IRR
- 60.3%
- Equity multiple
- 7.01×
- Total profit
- $151,281
- Equity at exit
- $7,773
Cash invested: $25,172 (down + closing). Projections, not guarantees.
Landlord ↔ Tenant lean methodology
- Overall (STATE)
- 73 Landlord-Friendly
- State Ohio
- 73 Landlord-Friendly · R+6
- County
- — inherits STATE
- City
- — inherits STATE
ZIP-level market 44833
- Home prices YoY
- -27.9%
- Active inventory
- 76
- Price-to-rent
- 9.9×
Monthly cashflow live
- Estimated rent
- $2,266 medium interval (Pro) →
- Mortgage (P&I)
- −$471
- Tax from tax record
- −$89 /mo · $1,071/yr
- Insurance
- −$37
- HOA
- −$0
- Vacancy / Maint / Mgmt
- −$476
- Net cashflow
- $1,192
Break-even live
Sensitivity live
| Price | -10% $1,243 | -5% $1,217 | +0% $1,192 | +5% $1,167 | +10% $1,141 |
|---|---|---|---|---|---|
| Rent | -10% $1,013 | -5% $1,102 | +0% $1,192 | +5% $1,282 | +10% $1,371 |
| Rate | -1.0pp $1,237 | -0.5pp $1,215 | base $1,192 | +0.5pp $1,169 | +1.0pp $1,145 |
3-unit breakdown (identical units grouped — click to expand)
| Units | Beds | Baths | Est. rent |
|---|---|---|---|
| 3× units | 1 | — | $2,265 |
| #1 | 1 | — | $755 |
| #2 | 1 | — | $755 |
| #3 | 1 | — | $755 |
| Total (3 units) | $2,266 | ||
UW: 25.0% down · 7.5% · 30yr · 1.5% tax · 5.0% vac · 8.0% maint · 8.0% mgmt
Financing live
Cash to close
- Down payment
- $22,475
- Closing costs
- $2,697
- Reserves months
- —
- Total cash needed
- —
Loan-product check · same deal, 3 products live
Conventional
25% down · 7.5% · 30yr
- Down + closing
- —
- Monthly P&I
- —
- Monthly cashflow
- —
- DSCR
- —
- Eligible?
- —
Personal DTI + credit; lowest rate.
DSCR
20% down · 8.5% · 30yr
- Down + closing
- —
- Monthly P&I
- —
- Monthly cashflow
- —
- DSCR
- —
- Eligible?
- —
No personal income docs; deal must DSCR.
Hard money
10% down · 12.0% · 12mo
- Down + closing
- —
- Monthly P&I
- —
- Monthly cashflow
- —
- DSCR
- —
- Eligible?
- —
Short-term bridge; refi at stabilization.
Listing history 6 events
-
2026-06-01statusdays on market $89,900 Pending 6 DOM
-
2026-05-31days on market $89,900 Active 5 DOM
-
2026-05-30days on market $89,900 Active 4 DOM
-
2026-05-26$89,900 Active
-
2001-08-24soldstatus $58,500
-
1999-09-08soldstatus $47,000
ⓘ Source: listings_history table (triggers on properties + properties_extension) + one-shot
backfill from property_details.listing_events for pre-trigger history.
Tax reassessment forecast OH · Partial reset (capped growth)
- Current annual tax
- $1,071 · $89/mo
- Projected year-2 tax
- $1,237 · $103/mo
- Expected delta
- +$166/yr (+$14/mo · 15.5%)
ⓘ Screening estimate from a state-policy table — verify with the county assessor before closing.
Climate risk First Street
- Flood 5/10 Major FEMA zone X (unshaded) · 24% chance over 30 yrs
- Wildfire 1/10 Low
- Heat 3/10 Moderate 7 d/yr ≥98°F today · 17 d/yr by 30 yrs out
- Wind 2/10 Low
- Air quality 2/10 Low 1 unhealthy d/yr today · 1 by 30 yrs out
Nearby sold comps map
Loading sold comps map…
Walkable amenities ~0.75 mi
Loading nearby amenities…
Taxation est. · year 1
- Rental income
- $27,192
- − Mortgage interest
- −$5,036
- − Property taxes
- −$1,071
- − Insurance
- −$450
- − Repairs & maintenance
- −$2,175
- − Management
- −$2,175
- − Depreciation
- −$2,615
- Taxable income
- $13,670
- Est. tax owed @ 24.0%
- −$3,281
- After-tax cash flow
- $11,023/yr
For passive investors: Depreciation is non-cash, so a rental often shows a tax loss while cash-flowing — sheltering income. Rental losses are passive: they offset passive income freely, and up to $25,000/yr can offset ordinary (W-2) income if you actively participate and your MAGI is under $100k (phasing out to $0 by $150k); unused losses carry forward. On sale, claimed depreciation is recaptured at up to 25%, and gains may owe capital-gains tax (a 1031 exchange can defer both). Figures are a year-1 estimate at your 24.0% rate — not tax advice; consult a CPA.
Schools (NCES district)
- District
- Galion City
- NCES district ID
- 3904402
- Math proficiency
- 36% ▼ -12.00%
- Reading proficiency
- 56% ▬ 0.00%
- Median HH income
- $36,331
- Composite
- 38.08/100
- National rank
- #4279
- State rank
- #499 of 656 in OH
Livability — Galion
- Score
- 63/100
- State rank
- #833
- US rank
- #15587
Category grades
Schools grade is shown separately in the Schools card above.
Census & demographics
- Census place
- Galion, OH
- County
- Morrow · 41,908 people
- City population
- 16,641
- Metro
- Columbus, OH
- Population (ZIP)
- 16,641
- Household income
- $57,234
- Rent vs Own
- Severe rent burden
- 3.8
Population outlook (Crawford County) Hauer SSP2
- Today (2025)
- 39,421 people
- By 2030
- 37,656 · -4.5%
- By 2040
- 34,043 · -13.6%
- By 2050
- 30,617 · -22.3%
- By 2075
- 23,652 · -40.0%
- By 2100
- 17,786 · -54.9%
Race, ethnicity, and origin ACS 2023
- Neighborhood character
- Predominantly White (96%)
- Race & ethnicity
- White 96% Two or more races 2% Hispanic / Latino 2%
- Common ancestry
- Slovak 2% Romanian 2% Lithuanian 2%
- Foreign-born
- 1% · Canada
- Languages at home
- 98% English-only · Spanish 1% German/W. Germanic 1%
Political lean MEDSL · Crawford
- 2024 margin
- Solid R (+53.0) · D 23.1% · R 76.1%
- 2008→2024 swing
- -33.9pp toward R · 2008: -19.0pp · 2024: -53.0pp
- All cycles
- 2024: R+53.0 2020: R+50.9 2016: R+46.8 2012: R+22.7 2008: R+19.0
Not yet ingested
- Civics
- —
Market trends
- HPI YoY
- ▼ -84.57%
- Current HPI
- 218.195
- Rent YoY
- —
- Metro
- —
- State GDP YoY
- ▲ 1.98%
- F500 in state
- 48
Industry mix (Fortune 500 HQ in OH)
| Industry | F500 HQs | Revenue |
|---|---|---|
| Insurance | 3 | $145B |
|
||
| Industrial Machinery | 3 | $49B |
|
||
| Financial Services | 3 | $24B |
|
||
| Consumer Goods | 2 | $93B |
|
||
| Aerospace / Defense | 2 | $47B |
|
||
| Utilities | 2 | $33B |
|
||
Price history
+91.3% since first listed3 events — show timeline
- 2026-05-26 Listed $89,900 MARMLS
- 2001-08-24 Sold (Public Records) $58,500 Public Records
- 1999-09-08 Sold (Public Records) $47,000 Public Records
Property tax history
-0.0%/yrLatest (2025): $1,071 · -0.3% YoY. Source: county tax records.
Cash-flow waterfall
monthlySold comps — $/sqft
last 12 mo · ≤1 miLoading sold comps…