146 Duvall Rd · Hillsville, VA
Flood risk 1/10 · Minimal
- FEMA flood zone
- X (unshaded)
- Chance of flooding over 30 yrs
- 0.0%
- Est. flood insurance / yr
- $507 – $1,088
Fire risk 4/10 · Minor
- Est. fire insurance / yr
- $666 – $1,236
Heat risk 2/10 · Minimal
- Hot days now (above 91°F)
- 7 days/yr
- Hot days in 30 yrs
- 20 days/yr
Wind risk 2/10 · Minimal
- Chance of severe wind over 30 yrs
- 1.0%
Air-quality risk 1/10 · Minimal
- Unhealthy air days now
- 0 days/yr
- Unhealthy air days in 30 yrs
- 0 days/yr
Risk factors via First Street. Map © Google.
Why this score? — see what drove the C grade
The composite is a weighted blend of 9 inputs, each scored 0–100. Each bar is that input's sub-score; the figure is the points it added to the 100-point composite (weight × sub-score).
- ARV discount +15.0/15.0
- Cash flow +14.4/30.0
- Appreciation +8.9/10.0
- Schools +5.4/10.0
- DSCR +4.4/10.0
- Livability +3.2/5.0
- 1% rule +2.7/10.0
- Rent growth +2.5/5.0
- Condition / age +2.5/5.0
$155,000
🖨 Deal sheet (PDF) 📄 Offer letter ✓ Due diligence
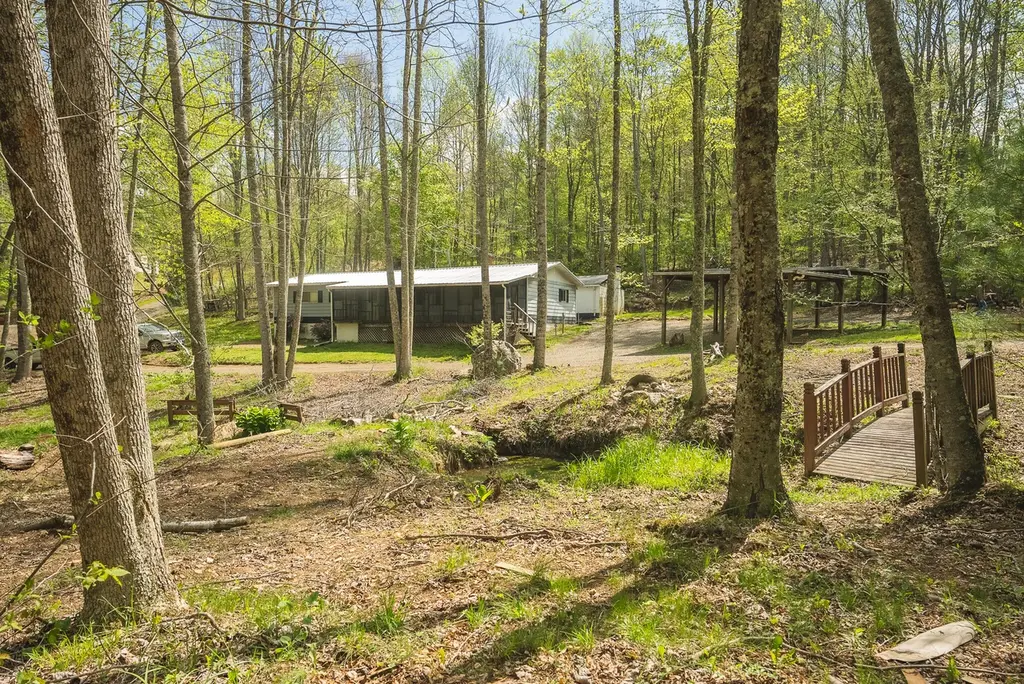
Listing remarks
Tucked away in the hills of Carroll County yet only 5 miles to 221 access is this residence on 8.6 acres. Great location, as it is just over the Floyd County line. 20 minutes in either direction to the Town of Floyd or the center of Hillsville. Residence is a 4 bedroom 2 bathroom home with large screened-in porch, ready for your personal touch. Roof 5 years old. Well pump 2-3 years old. 2 accessory buildings and 2-car carport provide storage or garage space. Large block workshop has electricity. 16 x 20 garage has electricity and provides storage for tools and equipment. Property also offers a spring-fed pond with reservoir that at one time was the water source for the residence. Carroll Co
Key facts
- Spring-fed pond
- Large block workshop
- 8.61 acre lot
Tags
Property features AI
Finance
- Financial info: Annual tax amount reported
Exterior
- Parking: 2 covered parking spaces
- Home design: Residential property; Built in 1968
- Exterior features: Approximately 8.61-acre lot
Interior
- Bedrooms: 4 bedrooms (all on the main level)
- Bathrooms: 2 full bathrooms (both on the main level)
- Heating & cooling: Heat pump electric heating; Has heating and cooling
- Interior features: Crawl space basement
Neighborhood map
What this means for you Summary
Snapshot
- This is a 4-bed/2.0-bath single-family listed at $155k.
Deal economics
- At list price, monthly cash flow is $31 ($366/yr) — positive.
- The deal already cash-flows at list — no discount required.
- To meet the 1% rule (rent ≥ 1% of price), the offer needs to be $120k (22.9% below list).
- Recommended offer: $120k (22.9% below list) — sets the bar for 1% rule.
- Cap rate 6.5% vs local median 2.6% in Hillsville — top-decile yield for the area; either an underpriced asset or a hidden risk that comps aren't pricing in. Stress-test before assuming the spread holds.
Location & tenants
- Location reads 65/100 on livability (#339 in VA) — a middle-class / working-renter tenant base. Strengths: cost of living A+, schools A, crime A; Watch: amenities F, commute F, employment F.
- Carroll County Public School District (rural): math 60% / reading 70% proficiency, ranked #46 of 131 in VA (top 35%) — acceptable for families but not a draw, mixed tenant base, ~2y average lease.
- Market conditions: 34 active listings in the ZIP; 80 units permitted in Carroll County in 2024 (0 in 5+ unit buildings).
Forward outlook
- In year one you build about $13k of equity ($1k loan paydown + $12k appreciation (7.7% local appreciation)).
- Carroll County population projected at -18% by 2050 — secular population decline; favor cash flow + early exit over multi-decade hold.
- At projected returns (7.7% appreciation + 3.0% rent growth), your $43k cash investment doubles in ~3 years — after that, you're playing with house money.
- By year 3, paydown + projected appreciation supports a ~$32k cash-out refi (75% LTV) — recoverable capital for the next deal without selling this one.
Negotiation context
- It's been on market 40 days — a 3% lower offer ($150k) is reasonable based on typical stale-listing flexibility.
- Current owner paid $75k; list at $155k implies a 107% gain — meaningful room to come down on a strong offer.
Questions for the listing agent
- It's been on market 40 days. Have you received any prior offers? Is the seller open to a 23% concession, seller financing, or rate buy-down credit?
- Built in 1968 — when were the roof, HVAC, electrical panel, plumbing, and water heater last replaced?
- Is there a deadline driving the sale (1031 exchange, divorce, estate, relocation)? That informs how much negotiation room exists.
- Schools are A-rated — typically a magnet for longer-tenancy family renters. What's the average tenant stay here, and is there a school-zone premium baked into asking?
- What's the average days-on-market for RENTAL listings here right now (not sales)? A rising rental-DOM trend means longer vacancies and softer asking-rent achievability than the comps imply.
- What's the recent tenant-quality profile in this submarket — average credit score on applications, eviction rate, late-payment / NSF rate, and stable-employment percentage? A property-management company in the area should have these aggregated.
- How much new for-sale + rental construction is in the pipeline within 1–3 miles? Heavy new supply typically softens prices + rents 12–24 months out; constrained supply supports both.
Investment metrics
- 1% rule
- 0.77% ✗
- Cap rate
- 6.53%
- Cash-on-cash
- 0.84%
- DSCR
- 1.04
- GRM
- 10.8
CMA / ARV
- ARV (on-the-fly)
- $288,400
- Comps found
- 2
Show comp detail 2 sales within ~0.75 mi
| Address | Dist | Beds/Ba | Sqft | Sold | Price | $/sf | Match |
|---|---|---|---|---|---|---|---|
| 1095 Kanawha Ridge Rd | 0.63mi | 3/2.0 (-1) | 1,376 (-2%) | 2mo | $279,000 | $203 | 61 |
| 952 Kanawha Ridge Rd | 0.63mi | 4/3.0 | 1,512 (+8%) | 8mo | $312,000 | $206 | 47 |
Match score weights: distance 35% · size 25% · config 20% · recency 20%. Top-matched comps best support the ARV.
Projected returns pro-forma
7.71% appreciation · 3.0% rent growth · sell at horizon
- IRR
- 20.0%
- Equity multiple
- 2.45×
- Total profit
- $62,845
- Equity at exit
- $114,701
- IRR
- 18.6%
- Equity multiple
- 5.16×
- Total profit
- $180,679
- Equity at exit
- $224,826
Cash invested: $43,400 (down + closing). Projections, not guarantees.
Landlord ↔ Tenant lean methodology
- Overall (STATE)
- 55 Moderately Landlord-Leaning
- State Virginia
- 55 Moderately Landlord-Leaning · D+2
- County
- — inherits STATE
- City
- — inherits STATE
ZIP-level market 24380
- Home prices YoY
- 3.8%
- Active inventory
- 34
- Price-to-rent
- 10.8×
Monthly cashflow live
- Estimated rent
- $1,196 medium interval (Pro) →
- Mortgage (P&I)
- −$813
- Tax from tax record
- −$37 /mo · $440/yr
- Insurance
- −$65
- HOA
- −$0
- Vacancy / Maint / Mgmt
- −$251
- Net cashflow
- $31
Break-even live
Sensitivity live
| Price | -10% $118 | -5% $74 | +0% $31 | +5% $-13 | +10% $-57 |
|---|---|---|---|---|---|
| Rent | -10% $-64 | -5% $-17 | +0% $31 | +5% $78 | +10% $125 |
| Rate | -1.0pp $109 | -0.5pp $70 | base $31 | +0.5pp $-10 | +1.0pp $-50 |
UW: 25.0% down · 7.5% · 30yr · 1.5% tax · 5.0% vac · 8.0% maint · 8.0% mgmt
Financing live
Cash to close
- Down payment
- $38,750
- Closing costs
- $4,650
- Reserves months
- —
- Total cash needed
- —
Loan-product check · same deal, 3 products live
Conventional
25% down · 7.5% · 30yr
- Down + closing
- —
- Monthly P&I
- —
- Monthly cashflow
- —
- DSCR
- —
- Eligible?
- —
Personal DTI + credit; lowest rate.
DSCR
20% down · 8.5% · 30yr
- Down + closing
- —
- Monthly P&I
- —
- Monthly cashflow
- —
- DSCR
- —
- Eligible?
- —
No personal income docs; deal must DSCR.
Hard money
10% down · 12.0% · 12mo
- Down + closing
- —
- Monthly P&I
- —
- Monthly cashflow
- —
- DSCR
- —
- Eligible?
- —
Short-term bridge; refi at stabilization.
Listing history 19 events
-
2026-06-21days on market $155,000 Active 40 DOM
-
2026-06-19days on market $155,000 Active 38 DOM
-
2026-06-18days on market $155,000 Active 37 DOM
-
2026-06-17days on market $155,000 Active 36 DOM
-
2026-06-16days on market $155,000 Active 35 DOM
-
2026-06-15days on market $155,000 Active 34 DOM
-
2026-06-14days on market $155,000 Active 32 DOM
-
2026-06-12days on market $155,000 Active 31 DOM
-
2026-06-09days on market $155,000 Active 28 DOM
-
2026-06-08days on market $155,000 Active 27 DOM
-
2026-06-07days on market $155,000 Active 26 DOM
-
2026-06-05days on market $155,000 Active 23 DOM
-
2026-06-02days on market $155,000 Active 21 DOM
-
2026-06-01days on market $155,000 Active 20 DOM
-
2026-05-31price $155,000 Active 19 DOM
-
2026-05-31days on market $170,000 Active 19 DOM
-
2026-05-30days on market $170,000 Active 18 DOM
-
2026-05-12$170,000 Active
-
2007-12-19soldstatus $75,000
ⓘ Source: listings_history table (triggers on properties + properties_extension) + one-shot
backfill from property_details.listing_events for pre-trigger history.
Tax reassessment forecast VA · Resets to sale price
- Current annual tax
- $440 · $37/mo
- Projected year-2 tax
- $1,271 · $106/mo
- Expected delta
- +$831/yr (+$69/mo · 188.9%)
ⓘ Screening estimate from a state-policy table — verify with the county assessor before closing.
Climate risk First Street
- Flood 1/10 Low FEMA zone X (unshaded) · 0% chance over 30 yrs
- Wildfire 4/10 Moderate
- Heat 2/10 Low 7 d/yr ≥91°F today · 20 d/yr by 30 yrs out
- Wind 2/10 Low 100% chance of damaging wind over 30 yrs
- Air quality 1/10 Low 0 unhealthy d/yr today · 0 by 30 yrs out
Nearby sold comps map
Loading sold comps map…
Walkable amenities ~0.75 mi
Loading nearby amenities…
Taxation est. · year 1
- Rental income
- $14,349
- − Mortgage interest
- −$8,682
- − Property taxes
- −$440
- − Insurance
- −$775
- − Repairs & maintenance
- −$1,148
- − Management
- −$1,148
- − Depreciation
- −$4,509
- Taxable loss
- −$2,354
- Est. tax savings @ 24.0%
- +$565
- After-tax cash flow
- $931/yr
For passive investors: Depreciation is non-cash, so a rental often shows a tax loss while cash-flowing — sheltering income. Rental losses are passive: they offset passive income freely, and up to $25,000/yr can offset ordinary (W-2) income if you actively participate and your MAGI is under $100k (phasing out to $0 by $150k); unused losses carry forward. On sale, claimed depreciation is recaptured at up to 25%, and gains may owe capital-gains tax (a 1031 exchange can defer both). Figures are a year-1 estimate at your 24.0% rate — not tax advice; consult a CPA.
Schools (NCES district)
- District
- Carroll County Public School District
- NCES district ID
- 5100690
- Math proficiency
- 60% ▼ -25.00%
- Reading proficiency
- 70% ▼ -10.00%
- Median HH income
- $36,359
- Composite
- 53.88/100
- National rank
- #1406
- State rank
- #46 of 131 in VA
Livability — Hillsville
- Score
- 65/100
- State rank
- #339
- US rank
- #13358
Category grades
Schools grade is shown separately in the Schools card above.
Census & demographics
- City population
- 8,942
- Population (ZIP)
- 2,998
Population outlook (Carroll County) Hauer SSP2
- Today (2025)
- 28,768 people
- By 2030
- 27,909 · -3.0%
- By 2040
- 25,788 · -10.4%
- By 2050
- 23,522 · -18.2%
- By 2075
- 19,045 · -33.8%
- By 2100
- 14,801 · -48.6%
Race, ethnicity, and origin ACS 2023
- Neighborhood character
- Predominantly White (89%)
- Race & ethnicity
- White 89% Two or more races 6% Black 4% Hispanic / Latino 4% Asian 1%
- Common ancestry
- Serbian 6% Romanian 2% Subsaharan African 1%
- Foreign-born
- 3% · Canada, China
- Languages at home
- 95% English-only · Spanish 4% Chinese 1%
Political lean MEDSL · Carroll
- 2024 margin
- Solid R (+63.3) · D 18.1% · R 81.4%
- 2008→2024 swing
- -30.9pp toward R · 2008: -32.4pp · 2024: -63.3pp
- All cycles
- 2024: R+63.3 2020: R+62.7 2016: R+59.6 2012: R+39.4 2008: R+32.4
Not yet ingested
- Civics
- —
Market trends
- HPI YoY
- ▲ 7.71%
- Current HPI
- 210.4559
- Rent YoY
- —
- Metro
- —
- State GDP YoY
- ▲ 2.40%
- F500 in state
- 50
Industry mix (Fortune 500 HQ in VA)
| Industry | F500 HQs | Revenue |
|---|---|---|
| Aerospace / Defense | 4 | $236B |
|
||
| Technology / Defense | 3 | $32B |
|
||
| Financial Services | 2 | $176B |
|
||
| Utilities | 2 | $27B |
|
||
| Insurance | 2 | $25B |
|
||
| Technology | 2 | $15B |
|
||
Price history
+126.7% since first listed2 events — show timeline
- 2026-05-12 Listed $170,000 MLSRV
- 2007-12-19 Sold (Public Records) $75,000 Public Records
Property tax history
+1.1%/yrLatest (2025): $440 · +24.1% YoY. Source: county tax records.
Cash-flow waterfall
monthlySold comps — $/sqft
last 12 mo · ≤1 miLoading sold comps…