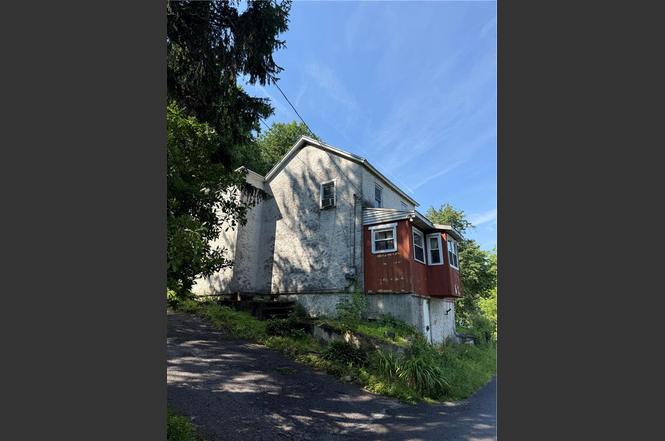
2102 Nemeth Dr · Lower Saucon, PA
Flood risk 1/10 · Minimal
- FEMA flood zone
- X (unshaded)
- Chance of flooding over 30 yrs
- 0.0%
- Est. flood insurance / yr
- $473 – $860
Fire risk 3/10 · Minor
- Est. fire insurance / yr
- $511 – $949
Heat risk 4/10 · Minor
- Hot days now (above 100°F)
- 6 days/yr
- Hot days in 30 yrs
- 13 days/yr
Wind risk 4/10 · Minor
- Chance of severe wind over 30 yrs
- 21.0%
Air-quality risk 3/10 · Minor
- Unhealthy air days now
- 3 days/yr
- Unhealthy air days in 30 yrs
- 4 days/yr
Risk factors via First Street. Map © Google.
Why this score? — see what drove the B- grade
The composite is a weighted blend of 9 inputs, each scored 0–100. Each bar is that input's sub-score; the figure is the points it added to the 100-point composite (weight × sub-score).
- Cash flow +23.8/30.0
- ARV discount +15.0/15.0
- DSCR +7.7/10.0
- 1% rule +6.2/10.0
- Schools +5.4/10.0
- Rent growth +4.3/5.0
- Livability +2.5/5.0
- Condition / age +2.5/5.0
- Appreciation +0.0/10.0
$209,000
🖨 Deal sheet 📄 Offer letter ✓ Due diligence
Listing remarks MLS
Welcome to 2102 Nemeth Drive! If you like seclusion, this is the property for you! This single family home is situated on an acre of land, has beautiful views, and is located in Saucon Valley School District. On the first floor of this home, you will find a large kitchen, open concept dining area and living room, full bathroom, pantry, and bonus area currently used as an office. Upstairs is an all purpose room, two bedrooms, and a walk-up attic.
Key facts
- Lovely view
- Acre of land
- Newer septic
Tags
Property features AI
Exterior
- Parking: No garage
- Utilities: Public water; Septic tank sewer; Electric service with circuit breakers
- Home design: 2-story home; Has a view; Above-grade finished living area present
- Construction: Stucco exterior; Asphalt, fiberglass, and rubber roofing
- Exterior features: Patio; Not in a subdivision; Sloped lot; Wooded; Public road frontage; Paved road
Interior
- Kitchen: Dishwasher; Electric oven; Electric range; Microwave; Refrigerator
- Bedrooms: Total rooms: 6
- Flooring: Carpet; Hardwood; Linoleum; Tile
- Bathrooms: 1 full bathroom
- Heating & cooling: Hot water heating (oil); Wall/window cooling units
- Interior features: Dining area; Separate/formal dining room; Eat-in kitchen; Full basement
- Laundry & utility: Washer hookup; Dryer hookup; Laundry on lower level; Electric water heater
Neighborhood map
What this means for you Summary
Snapshot
- This is a 3-bed/1.0-bath single-family listed at $209k.
Deal economics
- At list price, monthly cash flow is $401 ($5k/yr) — positive.
- The deal already cash-flows at list — no discount required.
- Meets the 1% rule at list price ($2k rent vs $209k).
Location & tenants
- Location reads: area grade B — affects rentability + tenant quality, not the cash-flow math above.
- Saucon Valley SD (suburban): math 57% / reading 66% proficiency, ranked #58 of 539 in PA (top 11%) — acceptable for families but not a draw, mixed tenant base, ~2y average lease; only 18% free/reduced lunch — higher-income household profile.
- Market conditions: Rents rising fast (+7.2%/yr); 156 active listings in the ZIP; 7 comparable units currently listed for rent nearby; rentals at typical pace (median 14d on market — plan ~3-4 weeks tenant-placement turnaround); 567 units permitted in Northampton County in 2024 (151 in 5+ unit buildings).
- At $2,346/mo this rent would consume 46% of the median local household income ($61k/yr) (locally 1525% of renters already pay >50% of income on rent) — very limited rent-growth headroom before tenants either downsize or default.
Forward outlook
- Local home prices are declining (-3.0%/yr); year-one equity from $1k of loan paydown is wiped out by about $6k of value loss. Plan a longer hold.
- At projected returns (-3.0% appreciation + 7.2% rent growth), your $59k cash investment doubles in ~9 years — after that, you're playing with house money.
Negotiation context
- Only 1 days on market — expect competitive offers; lowballing is unlikely to land.
- 2 sale attempts since 5y ago with the ask held roughly flat each time — persistent listings suggest the price (not the market) is what's stuck; bring a comps-based counter.
- Current owner paid $175k; 19% above their basis — modest negotiation headroom, anchor on the comps not their cost.
Risks & watch-outs
- Watch-outs: built in 1900 — expect roof / HVAC / electrical / plumbing capex.
Questions for the listing agent
- Built in 1900 — when were the roof, HVAC, electrical panel, plumbing, and water heater last replaced?
- Is there a deadline driving the sale (1031 exchange, divorce, estate, relocation)? That informs how much negotiation room exists.
- What's the average days-on-market for RENTAL listings here right now (not sales)? A rising rental-DOM trend means longer vacancies and softer asking-rent achievability than the comps imply.
- What's the recent tenant-quality profile in this submarket — average credit score on applications, eviction rate, late-payment / NSF rate, and stable-employment percentage? A property-management company in the area should have these aggregated.
- How much new for-sale + rental construction is in the pipeline within 1–3 miles? Heavy new supply typically softens prices + rents 12–24 months out; constrained supply supports both.
Investment metrics
- 1% rule
- 1.12% ✓
- Cap rate
- 8.59%
- Cash-on-cash
- 8.22%
- DSCR
- 1.37
- GRM
- 7.4
CMA / ARV
- ARV (on-the-fly)
- $330,720
- Comps found
- 5
Show comp detail 5 sales within ~0.75 mi
| Address | Dist | Beds/Ba | Sqft | Sold | Price | $/sf | Match |
|---|---|---|---|---|---|---|---|
| 2100 Schwab Ave | 0.31mi | 3/1.0 | 1,755 (+10%) | 8mo | $365,000 | $208 | 62 |
| 462 Main St | 0.43mi | 3/2.0 | 1,722 (+8%) | 3mo | $241,500 | $140 | 60 |
| 2078 Saucon Ave | 0.12mi | 4/3.0 (+1) | 1,476 (-7%) | 15mo | $415,000 | $281 | 57 |
| 319 Main St | 0.33mi | 3/1.5 | 1,384 (-13%) | 19mo | $275,000 | $199 | 45 |
| 1421 7th St | 0.72mi | 3/1.5 | 1,820 (+14%) | 11mo | $399,000 | $219 | 31 |
Match score weights: distance 35% · size 25% · config 20% · recency 20%. Top-matched comps best support the ARV.
Projected returns pro-forma
-3.0% appreciation · 7.18% rent growth · sell at horizon
- IRR
- 0.8%
- Equity multiple
- 1.03×
- Total profit
- $1,983
- Equity at exit
- $31,163
- IRR
- 14.3%
- Equity multiple
- 2.38×
- Total profit
- $80,750
- Equity at exit
- $18,071
Cash invested: $58,520 (down + closing). Projections, not guarantees.
Landlord ↔ Tenant lean methodology
- Overall (STATE)
- 62 Landlord-Friendly
- State Pennsylvania
- 62 Landlord-Friendly · EVEN
- County
- — inherits STATE
- City
- — inherits STATE
ZIP-level market 18015
- Home prices YoY
- -30.7%
- Rents YoY
- 7.2%
- Active inventory
- 156
- Price-to-rent
- 7.4×
Monthly cashflow live
- Estimated rent
- $2,346 high interval (Pro) →
- Mortgage (P&I)
- −$1,096
- Tax from tax record
- −$269 /mo · $3,229/yr
- Insurance
- −$87
- HOA
- −$0
- Vacancy / Maint / Mgmt
- −$493
- Net cashflow
- $401
Break-even live
UW: 25.0% down · 7.5% · 30yr · 1.5% tax · 5.0% vac · 8.0% maint · 8.0% mgmt
Financing live
Cash to close
- Down payment
- $52,250
- Closing costs
- $6,270
- Reserves months
- —
- Total cash needed
- —
Loan-product check · same deal, 3 products live
Conventional
25% down · 7.5% · 30yr
- Down + closing
- —
- Monthly P&I
- —
- Monthly cashflow
- —
- DSCR
- —
- Eligible?
- —
Personal DTI + credit; lowest rate.
DSCR
20% down · 8.5% · 30yr
- Down + closing
- —
- Monthly P&I
- —
- Monthly cashflow
- —
- DSCR
- —
- Eligible?
- —
No personal income docs; deal must DSCR.
Hard money
10% down · 12.0% · 12mo
- Down + closing
- —
- Monthly P&I
- —
- Monthly cashflow
- —
- DSCR
- —
- Eligible?
- —
Short-term bridge; refi at stabilization.
Rent comps 7 comps
| Address | Beds | Baths | Sqft | Rent | $/sqft | DOM | Units | Dist |
|---|---|---|---|---|---|---|---|---|
| 440 New St Freemansburg, PA | 3.0 | 1.5 | 1744 | $2,400 | $1.38 | 2d | 1 | 0.48mi |
| 305 S Oak St Unit 305 Freemansburg, PA | 3.0 | 4.0 | 2088 | $2,750 | $1.32 | 14d | 1 | 0.55mi |
| 1471 2nd St Bethlehem, PA | 4.0 | 1.5 | 1800 | $3,145 | $1.75 | 2d | 1 | 0.74mi |
| 1416 Livingston St Bethlehem, PA | 1.0–4.0 | 1.0–2.0 | 1002 | $2,147 | $2.14 | 2d | 20 | 0.95mi |
| 3638 Washington St Bethlehem, PA | 3.0 | 2.0 | 1881 | $2,450 | $1.30 | 23d | 1 | 1.06mi |
| 1240 Pembroke Rd #1 Bethlehem, PA | 3.0 | 1.0 | 1249 | $1,795 | $1.44 | 43d | 1 | 1.15mi |
| 1240 Pembroke Rd #2 Bethlehem, PA | 2.0 | 1.0 | 1300 | $1,495 | $1.15 | 43d | 1 | 1.15mi |
Listing history 3 events
-
2026-06-18remarks 258-char remark
-
2026-06-17remarks 142-char remark
-
2026-06-17$209,000 Active 1 DOM
ⓘ Source: listings_history table (triggers on properties + properties_extension) + one-shot
backfill from property_details.listing_events for pre-trigger history.
Tax reassessment forecast PA · Partial reset (capped growth)
- Current annual tax
- $3,229 · $269/mo
- Projected year-2 tax
- $3,265 · $272/mo
- Expected delta
- +$37/yr (+$3/mo · 1.1%)
ⓘ Screening estimate from a state-policy table — verify with the county assessor before closing.
Climate risk First Street
- Flood 1/10 Low FEMA zone X (unshaded) · 0% chance over 30 yrs
- Wildfire 3/10 Moderate
- Heat 4/10 Moderate 6 d/yr ≥100°F today · 13 d/yr by 30 yrs out
- Wind 4/10 Moderate 21% chance of damaging wind over 30 yrs
- Air quality 3/10 Moderate 3 unhealthy d/yr today · 4 by 30 yrs out
Nearby sold comps map
Loading sold comps map…
Walkable amenities ~0.75 mi
Loading nearby amenities…
Taxation est. · year 1
- Rental income
- $28,147
- − Mortgage interest
- −$11,707
- − Property taxes
- −$3,229
- − Insurance
- −$1,045
- − Repairs & maintenance
- −$2,252
- − Management
- −$2,252
- − Depreciation
- −$6,080
- Taxable income
- $1,583
- Est. tax owed @ 24.0%
- −$380
- After-tax cash flow
- $4,430/yr
For passive investors: Depreciation is non-cash, so a rental often shows a tax loss while cash-flowing — sheltering income. Rental losses are passive: they offset passive income freely, and up to $25,000/yr can offset ordinary (W-2) income if you actively participate and your MAGI is under $100k (phasing out to $0 by $150k); unused losses carry forward. On sale, claimed depreciation is recaptured at up to 25%, and gains may owe capital-gains tax (a 1031 exchange can defer both). Figures are a year-1 estimate at your 24.0% rate — not tax advice; consult a CPA.
Schools (NCES district)
- District
- Saucon Valley SD
- NCES district ID
- 4211730
- Math proficiency
- 57% ▬ 0.00%
- Reading proficiency
- 66% ▼ -9.00%
- Median HH income
- $67,374
- Composite
- 53.95/100
- National rank
- #1401
- State rank
- #58 of 539 in PA
Livability — Lower Saucon
No livability data for this city. (Only ~50 U.S. cities are tracked.)
Census & demographics
- County
- Northampton County · 236,814 people
- Metro
- Allentown-Bethlehem-Easton, PA-NJ
- Population (ZIP)
- 34,852
- Household income
- $60,800
- Rent vs Own
- Severe rent burden
- 1525.0
Population outlook (Northampton County) Hauer SSP2
- Today (2025)
- 312,227 people
- By 2030
- 314,769 · +0.8%
- By 2040
- 316,914 · +1.5%
- By 2050
- 318,037 · +1.9%
- By 2075
- 334,003 · +7.0%
- By 2100
- 344,696 · +10.4%
Race, ethnicity, and origin ACS 2023
- Neighborhood character
- Diverse neighborhood (Simpson 0.62)
- Race & ethnicity
- White 53% Hispanic / Latino 29% Two or more races 14% Black 10% Asian 5%
- Hispanic origin (detail)
- Mexican 2% Puerto Rican 19% Dominican 3%
- Common ancestry
- Romanian 4% Danish 1% Iranian 1%
- Foreign-born
- 12% · Canada, China, Jamaica
- Languages at home
- 73% English-only · Spanish 21% Chinese 2% Other Indo-European 2%
Political lean MEDSL · Northampton
- 2024 margin
- Toss-up / Even · D 48.6% · R 50.4%
- 2008→2024 swing
- -14.1pp toward R · 2008: 12.3pp · 2024: -1.8pp
- All cycles
- 2024: R+1.8 2020: D+0.7 2016: R+3.8 2012: D+4.6 2008: D+12.3
Not yet ingested
- Civics
- —
Market trends
- HPI YoY
- ▼ -122.95%
- Current HPI
- 277.4721
- Rent YoY
- ▲ 7.18%
- Metro
- Allentown-Bethlehem-Easton, PA-NJ
- State GDP YoY
- ▲ 1.68%
- F500 in state
- 34
Industry mix (Fortune 500 HQ in PA)
| Industry | F500 HQs | Revenue |
|---|---|---|
| Healthcare | 2 | $309B |
|
||
| Insurance | 2 | $27B |
|
||
| Telecommunications / Media | 1 | $124B |
|
||
| Industrial Distribution | 1 | $22B |
|
||
| Financial Services | 1 | $20B |
|
||
| Chemicals / Materials | 1 | $18B |
|
||
Price history
+198.6% since first listed9 events — show timeline
- 2026-06-17 Listed $209,000 GLVRMLS
- 2022-02-21 Sold (Public Records) $174,900 Public Records
- 2022-02-11 Sold (MLS) $174,900 GLVRMLS
- 2022-01-11 Pending — GLVRMLS
- 2021-12-08 Price Changed $174,900 GLVRMLS
- 2021-12-01 Price Changed $185,000 GLVRMLS
- 2021-11-22 Listed $199,900 GLVRMLS
- 1996-12-31 Sold (Public Records) $70,000 Public Records
- 1996-12-01 Sold (Public Records) $70,000 Public Records
Property tax history
+0.4%/yrLatest (2026): $3,229 · +0.8% YoY. Source: county tax records.
Cash-flow waterfall
monthlySold comps — $/sqft
last 12 mo · ≤1 miLoading sold comps…