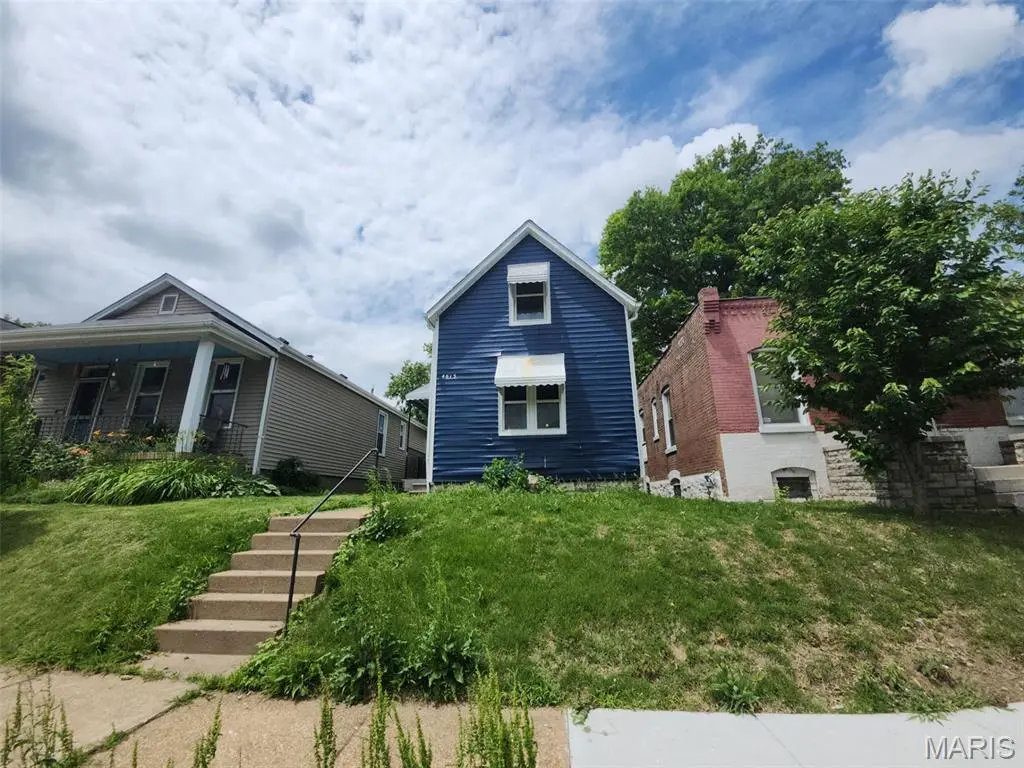
4615 Newport Ave · St. Louis, MO
Flood risk 1/10 · Minimal
- FEMA flood zone
- X (unshaded)
- Chance of flooding over 30 yrs
- 0.0%
- Est. flood insurance / yr
- $473 – $860
Fire risk 1/10 · Minimal
- Est. fire insurance / yr
- $1,054 – $1,958
Heat risk 6/10 · Moderate
- Hot days now (above 108°F)
- 7 days/yr
- Hot days in 30 yrs
- 21 days/yr
Wind risk 2/10 · Minimal
- Chance of severe wind over 30 yrs
- 1.0%
Air-quality risk 3/10 · Minor
- Unhealthy air days now
- 3 days/yr
- Unhealthy air days in 30 yrs
- 4 days/yr
Risk factors via First Street. Map © Google.
Why this score? — see what drove the B- grade
The composite is a weighted blend of 9 inputs, each scored 0–100. Each bar is that input's sub-score; the figure is the points it added to the 100-point composite (weight × sub-score).
- Cash flow +27.2/30.0
- ARV discount +15.0/15.0
- DSCR +9.5/10.0
- 1% rule +8.9/10.0
- Rent growth +3.2/5.0
- Livability +2.5/5.0
- Condition / age +2.5/5.0
- Schools +1.2/10.0
- Appreciation +0.0/10.0
$72,700
🖨 Deal sheet (PDF) 📄 Offer letter ✓ Due diligence
Listing remarks MLS
Newly renovated home!!!!!!! This home has a new kitchen with appliances, new bathrooms with new fixtures, new plumbing, new electrical, a new high efficency furnace, a new hot-water-heater, new flooring, some new windows and fresh painting throughout. The back room addition adds extra storage space and easy access to the basement. Come view this one today before it's gone!
Key facts
- Close to dining
- Private outdoor area
- Close to local parks
Tags
Property features AI
Exterior
- Utilities: Public water; Public sewer; Electric service by Ameren
- Home design: Single family residence; Two levels
- Construction: Constructed with other materials
- Exterior features: Front yard; Back yard
Interior
- Bedrooms: Three bedrooms total; One bedroom on the main level; Two bedrooms on the upper level
- Bathrooms: One full bathroom; One half bathroom; Main and upper levels combine for two bathrooms; Upper level includes a half bath
- Heating & cooling: Forced air heating; Central air conditioning
- Interior features: Partial unfinished basement; Eight total rooms
Neighborhood map
What this means for you Summary
Snapshot
- This is a 3-bed/1.0-bath single-family listed at $73k.
Deal economics
- At list price, monthly cash flow is $208 ($2k/yr) — positive.
- The deal already cash-flows at list — no discount required.
- Meets the 1% rule at list price ($1k rent vs $73k).
- Recommended offer: $72k (1.5% below list) — sets the bar for market timing.
- Cap rate 9.7% vs local median 5.0% in St. Louis — top-decile yield for the area; either an underpriced asset or a hidden risk that comps aren't pricing in. Stress-test before assuming the spread holds.
Location & tenants
- Location reads: area grade B — affects rentability + tenant quality, not the cash-flow math above.
- St. Louis City (urban): math 10% / reading 18% proficiency, ranked #312 of 324 in MO (top 96%) — low school quality limits family demand, transient renter base, plan for 1-2y turnover; 80% free/reduced lunch — lower-income household profile, screen leases tightly.
- Zoned schools: Oak Hill Elem. (math 12% / reading 12%, grade F, #1,016 of 1,115 statewide, top 92%, 238 students, 99% FRL); Gateway Middle (math 0% / reading 8%, grade F, #389 of 391 statewide, top 100%, 506 students, 99% FRL); Roosevelt High (math 2% / reading 8%, grade F, #517 of 521 statewide, top 100%, 460 students, 99% FRL) — zoned schools average 99% FRL vs 80% district-wide (19 pts higher); higher-poverty schools than district average — tighter screening recommended.
- Market conditions: Rents rising (+2.6%/yr); 261 active listings in the ZIP; 14 comparable units currently listed for rent nearby; rentals at typical pace (median 20d on market — plan ~3-4 weeks tenant-placement turnaround); 294 units permitted in St. Louis city in 2024 (227 in 5+ unit buildings).
Forward outlook
- Local home prices are declining (-3.0%/yr); year-one equity from $503 of loan paydown is wiped out by about $2k of value loss. Plan a longer hold.
- St. Louis County population projected to shrink 6% by 2050 — rents likely to lag national; underwrite the cash flow, not the appreciation.
- At projected returns (-3.0% appreciation + 2.6% rent growth), your $20k cash investment doubles in ~10 years — after that, you're playing with house money.
Negotiation context
- It's been on market 18 days — a 2% lower offer ($72k) is reasonable based on typical stale-listing flexibility.
- 5 sale attempts since 15y ago with the ask held roughly flat each time — persistent listings suggest the price (not the market) is what's stuck; bring a comps-based counter.
Risks & watch-outs
- Watch-outs: property tax is 3.0% of price; built in 1907 — expect roof / HVAC / electrical / plumbing capex.
- Climate carrying-cost: extreme-heat days projected 7→21/yr by 2055 (HVAC capex compounding) — expect insurance premiums to compound above CPI over the hold.
Questions for the listing agent
- Built in 1907 — when were the roof, HVAC, electrical panel, plumbing, and water heater last replaced?
- Property tax is high relative to price — has the assessment been appealed recently, and will the sale trigger a re-assessment?
- Is there a deadline driving the sale (1031 exchange, divorce, estate, relocation)? That informs how much negotiation room exists.
- What's the average days-on-market for RENTAL listings here right now (not sales)? A rising rental-DOM trend means longer vacancies and softer asking-rent achievability than the comps imply.
- What's the recent tenant-quality profile in this submarket — average credit score on applications, eviction rate, late-payment / NSF rate, and stable-employment percentage? A property-management company in the area should have these aggregated.
- How much new for-sale + rental construction is in the pipeline within 1–3 miles? Heavy new supply typically softens prices + rents 12–24 months out; constrained supply supports both.
Investment metrics
- 1% rule
- 1.39% ✓
- Cap rate
- 9.72%
- Cash-on-cash
- 12.26%
- DSCR
- 1.55
- GRM
- 6.0
CMA / ARV
- ARV (on-the-fly)
- $102,448
- Comps found
- 12
Show comp detail 12 sales within ~0.75 mi
| Address | Dist | Beds/Ba | Sqft | Sold | Price | $/sf | Match |
|---|---|---|---|---|---|---|---|
| 4327 Jessica Ave | 0.39mi | 2/1.0 (-1) | 656 (-3%) | 3mo | $100,000 | $152 | 70 |
| 3931 Delor St | 0.37mi | 2/1.0 (-1) | 620 (-8%) | 3mo | $89,000 | $144 | 62 |
| 3976 Eichelberger St | 0.50mi | 2/1.0 (-1) | 720 (+7%) | 1mo | $10,000 | $14 | 60 |
| 3857 Neosho St | 0.46mi | 2/1.0 (-1) | 720 (+7%) | 6mo | $89,900 | $125 | 57 |
| 4616 S Spring Ave | 0.51mi | 2/1.0 (-1) | 690 (+2%) | 15mo | $147,500 | $214 | 54 |
| 4416 S Spring Ave | 0.55mi | 4/3.0 (+1) | 703 (+4%) | 5mo | $199,000 | $283 | 50 |
| 4035 Schiller Pl | 0.46mi | 2/1.0 (-1) | 762 (+13%) | 2mo | $114,900 | $151 | 50 |
| 4610 Leona St | 0.25mi | 2/2.0 (-1) | 747 (+11%) | 14mo | $150,000 | $201 | 50 |
| 3838 Neosho | 0.49mi | 2/1.0 (-1) | 616 (-9%) | 11mo | $80,000 | $130 | 49 |
| 5134 Cologne Ave | 0.65mi | 2/1.0 (-1) | 720 (+7%) | 9mo | $84,100 | $117 | 45 |
| 4470 Bingham Ave | 0.71mi | 2/1.0 (-1) | 770 (+14%) | 4mo | $129,900 | $169 | 35 |
| 4418 S 38th St | 0.62mi | 2/1.0 (-1) | 759 (+13%) | 14mo | $115,000 | $152 | 34 |
Match score weights: distance 35% · size 25% · config 20% · recency 20%. Top-matched comps best support the ARV.
Projected returns pro-forma
-3.0% appreciation · 2.62% rent growth · sell at horizon
- IRR
- 1.5%
- Equity multiple
- 1.06×
- Total profit
- $1,146
- Equity at exit
- $10,840
- IRR
- 10.7%
- Equity multiple
- 1.82×
- Total profit
- $16,764
- Equity at exit
- $6,286
Cash invested: $20,356 (down + closing). Projections, not guarantees.
Landlord ↔ Tenant lean methodology
- Overall (STATE)
- 81 Strongly Landlord-Friendly
- State Missouri
- 81 Strongly Landlord-Friendly · R+10
- County
- — inherits STATE
- City
- — inherits STATE
ZIP-level market 63116
- Rents YoY
- 2.6%
- Active inventory
- 261
- Price-to-rent
- 6.0×
Monthly cashflow live
- Estimated rent
- $1,010 high interval (Pro) →
- Mortgage (P&I)
- −$381
- Tax from tax record
- −$179 /mo · $2,145/yr
- Insurance
- −$30
- HOA
- −$0
- Vacancy / Maint / Mgmt
- −$212
- Net cashflow
- $208
Break-even live
Sensitivity live
| Price | -10% $249 | -5% $228 | +0% $208 | +5% $187 | +10% $167 |
|---|---|---|---|---|---|
| Rent | -10% $128 | -5% $168 | +0% $208 | +5% $248 | +10% $288 |
| Rate | -1.0pp $245 | -0.5pp $226 | base $208 | +0.5pp $189 | +1.0pp $170 |
UW: 25.0% down · 7.5% · 30yr · 1.5% tax · 5.0% vac · 8.0% maint · 8.0% mgmt
Financing live
Cash to close
- Down payment
- $18,175
- Closing costs
- $2,181
- Reserves months
- —
- Total cash needed
- —
Loan-product check · same deal, 3 products live
Conventional
25% down · 7.5% · 30yr
- Down + closing
- —
- Monthly P&I
- —
- Monthly cashflow
- —
- DSCR
- —
- Eligible?
- —
Personal DTI + credit; lowest rate.
DSCR
20% down · 8.5% · 30yr
- Down + closing
- —
- Monthly P&I
- —
- Monthly cashflow
- —
- DSCR
- —
- Eligible?
- —
No personal income docs; deal must DSCR.
Hard money
10% down · 12.0% · 12mo
- Down + closing
- —
- Monthly P&I
- —
- Monthly cashflow
- —
- DSCR
- —
- Eligible?
- —
Short-term bridge; refi at stabilization.
Rent comps 14 comps
| Address | Beds | Baths | Sqft | Rent | $/sqft | DOM | Units | Dist |
|---|---|---|---|---|---|---|---|---|
| 4215 Neosho St Unit 101 St. Louis, MO | 2.0 | 1.0 | 750 | $825 | $1.10 | 45d | 1 | 0.24mi |
| 4446 Itaska St Saint Louis, MO | 2.0 | 1.0 | 732 | $1,195 | $1.63 | 0d | 1 | 0.56mi |
| 3860 Bamberger Ave Unit 3N St. Louis, MO | 2.0 | 1.0 | 700 | $799 | $1.14 | 19d | 1 | 0.70mi |
| 4451 Grace Ave Saint Louis, MO | 2.0 | 1.0 | 700 | $750 | $1.07 | 19d | 1 | 0.74mi |
| 3702 Meramec St Unit 1e St. Louis, MO | 2.0 | 1.0 | 725 | $950 | $1.31 | 0d | 1 | 0.79mi |
| 3702 Meramec St Unit 1e St. Louis, MO | 2.0 | 1.0 | 725 | $950 | $1.31 | 9d | 1 | 0.79mi |
| 3534 Morgan Ford Rd Unit 3534-C St. Louis, MO | 2.0 | 1.0 | 650 | $1,150 | $1.77 | 45d | 1 | 0.80mi |
| 4617 Virginia Ave St. Louis, MO | 2.0 | 1.0 | 700 | $825 | $1.18 | 25d | 1 | 1.13mi |
| 3255 Delor St Unit 2E St. Louis, MO | 2.0 | 1.0 | 700 | $895 | $1.28 | 0d | 1 | 1.23mi |
| 3601 Holly Hills Blvd Apt 19 St. Louis, MO | 2.0 | 1.0 | 700 | $875 | $1.25 | 5d | 1 | 1.32mi |
| 6725 Wanda Ave Saint Louis, MO | 2.0 | 1.0 | 700 | $1,100 | $1.57 | 45d | 1 | 1.36mi |
| 440 Eichelberger St Saint Louis, MO | 2.0 | 1.0 | 750 | $850 | $1.13 | 5d | 1 | 1.39mi |
| 5305 S Compton Ave St. Louis, MO | 2.0 | 1.0 | 750 | $825 | $1.10 | 45d | 1 | 1.40mi |
| 3839 Pennsylvania Ave Saint Louis, MO | 2.0 | 1.0 | 725 | $1,000 | $1.38 | 22d | 1 | 1.42mi |
Listing history 11 events
-
2026-06-21days on market $72,700 Active 18 DOM
-
2026-06-18days on market $72,700 Active 15 DOM
-
2026-06-17days on market $72,700 Active 14 DOM
-
2026-06-16days on market $72,700 Active 13 DOM
-
2026-06-15days on market $72,700 Active 12 DOM
-
2026-06-13days on market $72,700 Active 10 DOM
-
2026-06-09days on market $72,700 Active 6 DOM
-
2026-06-08days on market $72,700 Active 5 DOM
-
2026-06-07days on market $72,700 Active 4 DOM
-
2026-06-05remarks 570-char remark
-
2026-06-05$72,700 Active 1 DOM
ⓘ Source: listings_history table (triggers on properties + properties_extension) + one-shot
backfill from property_details.listing_events for pre-trigger history.
Tax reassessment forecast MO · Resets to sale price
- Current annual tax
- $2,145 · $179/mo
- Projected year-2 tax
- $2,145 · $179/mo
- Expected delta
- $0/yr ($0/mo · 0.0%)
ⓘ Screening estimate from a state-policy table — verify with the county assessor before closing.
Climate risk First Street
- Flood 1/10 Low FEMA zone X (unshaded) · 0% chance over 30 yrs
- Wildfire 1/10 Low
- Heat 6/10 Major 7 d/yr ≥108°F today · 21 d/yr by 30 yrs out
- Wind 2/10 Low 100% chance of damaging wind over 30 yrs
- Air quality 3/10 Moderate 3 unhealthy d/yr today · 4 by 30 yrs out
Nearby sold comps map
Loading sold comps map…
Walkable amenities ~0.75 mi
Loading nearby amenities…
Taxation est. · year 1
- Rental income
- $12,125
- − Mortgage interest
- −$4,072
- − Property taxes
- −$2,145
- − Insurance
- −$364
- − Repairs & maintenance
- −$970
- − Management
- −$970
- − Depreciation
- −$2,115
- Taxable income
- $1,489
- Est. tax owed @ 24.0%
- −$357
- After-tax cash flow
- $2,138/yr
For passive investors: Depreciation is non-cash, so a rental often shows a tax loss while cash-flowing — sheltering income. Rental losses are passive: they offset passive income freely, and up to $25,000/yr can offset ordinary (W-2) income if you actively participate and your MAGI is under $100k (phasing out to $0 by $150k); unused losses carry forward. On sale, claimed depreciation is recaptured at up to 25%, and gains may owe capital-gains tax (a 1031 exchange can defer both). Figures are a year-1 estimate at your 24.0% rate — not tax advice; consult a CPA.
Schools (NCES district)
- District
- St. Louis City
- NCES district ID
- 2929280
- Math proficiency
- 10% ▼ -6.00%
- Reading proficiency
- 18% ▼ -3.00%
- Median HH income
- $35,685
- Composite
- 11.54/100
- National rank
- #9699
- State rank
- #312 of 324 in MO
Livability — St. Louis
No livability data for this city. (Only ~50 U.S. cities are tracked.)
Census & demographics
- Census place
- St. Louis, MO
- County
- Saint Louis City · 254,015 people
- City population
- 283,259
- Metro
- St. Louis, MO-IL
- Population (ZIP)
- 42,170
- Household income
- $61,433
- Rent vs Own
- Severe rent burden
- 1923.0
Population outlook (St. Louis County) Hauer SSP2
- Today (2025)
- 315,737 people
- By 2030
- 313,865 · -0.6%
- By 2040
- 305,439 · -3.3%
- By 2050
- 296,529 · -6.1%
- By 2075
- 271,028 · -14.2%
- By 2100
- 255,359 · -19.1%
Race, ethnicity, and origin ACS 2023
- Neighborhood character
- Diverse neighborhood (Simpson 0.63)
- Race & ethnicity
- White 54% Black 27% Hispanic / Latino 10% Two or more races 8% Asian 5%
- Hispanic origin (detail)
- Mexican 7%
- Common ancestry
- Lithuanian 4% Romanian 2% Italian 2%
- Foreign-born
- 11% · Canada, Vietnam, Philippines
- Languages at home
- 85% English-only · Spanish 6% Vietnamese 2% Arabic 2%
Political lean MEDSL · St. Louis
- 2024 margin
- Solid D (+64.7) · D 81.4% · R 16.7% · Other 2.0%
- 2008→2024 swing
- -3.5pp toward R · 2008: 68.2pp · 2024: 64.7pp
- All cycles
- 2024: D+64.7 2020: D+66.2 2016: D+63.7 2012: D+66.6 2008: D+68.2
Not yet ingested
- Civics
- —
Market trends
- HPI YoY
- ▼ -271.19%
- Current HPI
- 215.7108
- Rent YoY
- ▲ 2.62%
- Metro
- St. Louis, MO-IL
- State GDP YoY
- ▲ 1.84%
- F500 in state
- 20
Industry mix (Fortune 500 HQ in MO)
| Industry | F500 HQs | Revenue |
|---|---|---|
| Healthcare | 1 | $163B |
|
||
| Insurance | 1 | $21B |
|
||
| Industrial Technology | 1 | $17B |
|
||
| Retail | 1 | $16B |
|
||
| Industrial Distribution | 1 | $10B |
|
||
| Utilities | 1 | $9B |
|
||
Price history
+150.7% since first listed19 events — show timeline
- 2026-06-03 Listed $72,700 MARIS as Distributed by MLS Grid
- 2023-06-30 Sold (Public Records) $157,000 Public Records
- 2023-06-26 Sold (MLS) — MARIS as Distributed by MLS Grid
- 2023-05-20 Pending — MARIS as Distributed by MLS Grid
- 2023-05-12 Price Changed $150,000 MARIS as Distributed by MLS Grid
- 2023-04-29 Price Changed $154,900 MARIS as Distributed by MLS Grid
- 2023-04-29 Price Changed $144,900 MARIS as Distributed by MLS Grid
- 2023-04-16 Listed $159,900 MARIS as Distributed by MLS Grid
- 2022-12-06 Sold (Public Records) $42,000 Public Records
- 2022-11-23 Sold (MLS) — MARIS as Distributed by MLS Grid
- 2022-11-12 Pending — MARIS as Distributed by MLS Grid
- 2022-11-09 Relisted — MARIS as Distributed by MLS Grid
- 2022-11-06 Pending — MARIS as Distributed by MLS Grid
- 2022-11-04 Listed $39,000 MARIS as Distributed by MLS Grid
- 2019-12-02 Sold (Public Records) $32,000 Public Records
- 2012-05-11 Sold (Public Records) $24,500 Public Records
- 2012-05-11 Sold (Public Records) $21,000 Public Records
- 2012-05-04 Sold (MLS) — MARIS as Distributed by MLS Grid
- 2011-06-13 Listed $29,000 MARIS as Distributed by MLS Grid
Property tax history
+17.5%/yrLatest (2024): $2,145 · +197.1% YoY. Source: county tax records.
Cash-flow waterfall
monthlySold comps — $/sqft
last 12 mo · ≤1 miLoading sold comps…