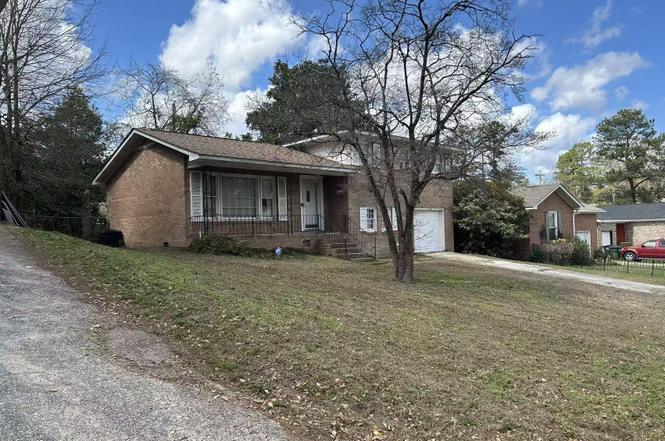
305 Park Ln · Oak Grove, SC
Flood risk 1/10 · Minimal
- FEMA flood zone
- X (unshaded)
- Chance of flooding over 30 yrs
- 0.0%
- Est. flood insurance / yr
- $507 – $1,088
Fire risk 2/10 · Minimal
- Est. fire insurance / yr
- $783 – $1,453
Heat risk 6/10 · Moderate
- Hot days now (above 108°F)
- 7 days/yr
- Hot days in 30 yrs
- 16 days/yr
Wind risk 6/10 · Moderate
- Chance of severe wind over 30 yrs
- 67.0%
Air-quality risk 3/10 · Minor
- Unhealthy air days now
- 2 days/yr
- Unhealthy air days in 30 yrs
- 2 days/yr
Risk factors via First Street. Map © Google.
Why this score? — see what drove the C+ grade
The composite is a weighted blend of 9 inputs, each scored 0–100. Each bar is that input's sub-score; the figure is the points it added to the 100-point composite (weight × sub-score).
- Cash flow +27.3/30.0
- DSCR +9.5/10.0
- ARV discount +7.5/15.0
- 1% rule +6.4/10.0
- Schools +4.2/10.0
- Rent growth +3.6/5.0
- Livability +3.3/5.0
- Condition / age +2.5/5.0
- Appreciation +0.0/10.0
$168,000
🖨 Deal sheet (PDF) 📄 Offer letter ✓ Due diligence
Listing remarks
Priced to sell. Great opportunity for investors or buyers looking to build equity! Welcome to this solid all-brick home in the desirable Oak Grove area of West Columbia. Conveniently located just minutes from Highway 1 and Interstate 26, the property offers quick access to downtown Lexington (about 10 minutes) and downtown Columbia (approximately 17 minutes), combining convenience with everyday accessibility. Hardwood and tile flooring run throughout the home, adding durability and character. The lower level features a second living area with French doors leading to the backyard, along with a full bathroom. The extra-deep garage (about 26.8’) provides excellent storage space with buil
Key facts
- Full bathroom
- Second living area
- French doors
Tags
Property features AI
Exterior
- Parking: Attached 1-car garage
- Utilities: Public water; Public sewer
- Home design: Attached garage; Garage located on lower level
- Construction: Crawlspace foundation
- Exterior features: Brick exterior above foundation; Paved road access; Approximately 0.14 acre lot
Interior
- Kitchen: Bar; Formica countertops; Painted cabinets; Tile floor; Ceiling fan
- Bedrooms: Master bedroom on second level with private bath, separate shower, and ceiling fan; Second bedroom on second level with shared bath and ceiling fan; Third bedroom on second level with shared bath and ceiling fan
- Flooring: Hardwood floors in great room and bedrooms; Tile floor in kitchen
- Bathrooms: Two full bathrooms (one full bath on lower level, one full second bath)
- Heating & cooling: Central heating; Central air conditioning
- Interior features: French doors in living room; Ceiling fans in living room, kitchen, and bedrooms; Hardwood floors in great room and bedrooms; Great room on main level; Bar and painted cabinets in kitchen; Formica countertops and tile floor in kitchen
Neighborhood map
What this means for you Summary
Snapshot
- This is a 4-bed/2.0-bath single-family listed at $168k.
Deal economics
- At list price, monthly cash flow is $488 ($6k/yr) — positive.
- The deal already cash-flows at list — no discount required.
- Meets the 1% rule at list price ($2k rent vs $168k).
- Recommended offer: $153k (9.0% below list) — sets the bar for market timing.
Location & tenants
- Location reads 66/100 on livability (#114 in SC) — a middle-class / working-renter tenant base. Strengths: cost of living A+, housing A+, health & safety B; Watch: crime D, amenities F, commute F.
- Lexington 01 (suburban): math 42% / reading 53% proficiency, ranked #11 of 80 in SC (top 14%) — families likely to look elsewhere, expect single-tenant / working-renter base with shorter leases.
- Zoned schools: Oak Grove Elementary (math 37% / reading 39%, grade F, #308 of 597 statewide, top 52%, 738 students, 35% FRL); White Knoll Middle (math 19% / reading 31%, grade F, #165 of 229 statewide, top 72%, 816 students, 52% FRL); White Knoll High (math 47% / reading 85%, grade B, #81 of 196 statewide, top 42%, 2,204 students, 45% FRL).
- Market conditions: Rents rising fast (+4.6%/yr); 193 active listings in the ZIP; 2 comparable units currently listed for rent nearby; 1,712 units permitted in Lexington County in 2024 (0 in 5+ unit buildings).
- This rent runs 31% of the median local income ($75k/yr) — at the standard rent-burdened threshold; future hikes will face affordability resistance.
Forward outlook
- Local home prices are declining (-3.0%/yr); year-one equity from $1k of loan paydown is wiped out by about $5k of value loss. Plan a longer hold.
- Lexington County population projected at +26% by 2050 — long-run rental-demand tailwind backs the buy-and-hold thesis.
- At projected returns (-3.0% appreciation + 4.6% rent growth), your $47k cash investment doubles in ~9 years — after that, you're playing with house money.
Negotiation context
- It's been on market 104 days — a 9% lower offer ($153k) is reasonable based on typical stale-listing flexibility.
- 2 sale attempts since 6y ago; this cycle's ask has dropped $27k (14%) from the opening price — seller is motivated, your offer sets the floor, not the list.
- Current owner paid $142k; 18% above their basis — modest negotiation headroom, anchor on the comps not their cost.
Risks & watch-outs
- Climate carrying-cost: major wind risk, 67% chance of damaging wind over 30y; extreme-heat days projected 7→16/yr by 2055 (HVAC capex compounding) — expect insurance premiums to compound above CPI over the hold.
Questions for the listing agent
- It's been on market 104 days. Have you received any prior offers? Is the seller open to a 9% concession, seller financing, or rate buy-down credit?
- Built in 1974 — when were the roof, HVAC, electrical panel, plumbing, and water heater last replaced?
- Why hasn't it sold? Are there any deal-killer items the seller is aware of (foundation, flood, title, zoning, code violations)?
- Is there a deadline driving the sale (1031 exchange, divorce, estate, relocation)? That informs how much negotiation room exists.
- Schools are D-rated, which usually means shorter tenancies and higher turnover. Who's the typical renter profile here, and what's been the actual vacancy rate?
- Crime grade is D in this area — have there been break-ins, vandalism, or insurance claims at this property in the last 3 years? What carrier currently insures it and at what premium?
- What's the average days-on-market for RENTAL listings here right now (not sales)? A rising rental-DOM trend means longer vacancies and softer asking-rent achievability than the comps imply.
- What's the recent tenant-quality profile in this submarket — average credit score on applications, eviction rate, late-payment / NSF rate, and stable-employment percentage? A property-management company in the area should have these aggregated.
- How much new for-sale + rental construction is in the pipeline within 1–3 miles? Heavy new supply typically softens prices + rents 12–24 months out; constrained supply supports both.
Investment metrics
- 1% rule
- 1.14% ✓
- Cap rate
- 9.78%
- Cash-on-cash
- 12.45%
- DSCR
- 1.55
- GRM
- 7.3
CMA / ARV
No comps found within radius.
Projected returns pro-forma
-3.0% appreciation · 4.57% rent growth · sell at horizon
- IRR
- 3.7%
- Equity multiple
- 1.15×
- Total profit
- $6,877
- Equity at exit
- $25,049
- IRR
- 14.5%
- Equity multiple
- 2.25×
- Total profit
- $58,785
- Equity at exit
- $14,526
Cash invested: $47,040 (down + closing). Projections, not guarantees.
Landlord ↔ Tenant lean methodology
- Overall (STATE)
- 90 Strongly Landlord-Friendly
- State South Carolina
- 90 Strongly Landlord-Friendly · R+6
- County
- — inherits STATE
- City
- — inherits STATE
ZIP-level market 29170
- Home prices YoY
- -16.9%
- Rents YoY
- 4.6%
- Active inventory
- 193
- Price-to-rent
- 7.3×
Monthly cashflow live
- Estimated rent
- $1,911 medium interval (Pro) →
- Mortgage (P&I)
- −$881
- Tax from tax record
- −$71 /mo · $848/yr
- Insurance
- −$70
- HOA
- −$0
- Vacancy / Maint / Mgmt
- −$401
- Net cashflow
- $488
Break-even live
Sensitivity live
| Price | -10% $583 | -5% $536 | +0% $488 | +5% $441 | +10% $393 |
|---|---|---|---|---|---|
| Rent | -10% $337 | -5% $413 | +0% $488 | +5% $564 | +10% $639 |
| Rate | -1.0pp $573 | -0.5pp $531 | base $488 | +0.5pp $445 | +1.0pp $400 |
UW: 25.0% down · 7.5% · 30yr · 1.5% tax · 5.0% vac · 8.0% maint · 8.0% mgmt
Financing live
Cash to close
- Down payment
- $42,000
- Closing costs
- $5,040
- Reserves months
- —
- Total cash needed
- —
Loan-product check · same deal, 3 products live
Conventional
25% down · 7.5% · 30yr
- Down + closing
- —
- Monthly P&I
- —
- Monthly cashflow
- —
- DSCR
- —
- Eligible?
- —
Personal DTI + credit; lowest rate.
DSCR
20% down · 8.5% · 30yr
- Down + closing
- —
- Monthly P&I
- —
- Monthly cashflow
- —
- DSCR
- —
- Eligible?
- —
No personal income docs; deal must DSCR.
Hard money
10% down · 12.0% · 12mo
- Down + closing
- —
- Monthly P&I
- —
- Monthly cashflow
- —
- DSCR
- —
- Eligible?
- —
Short-term bridge; refi at stabilization.
Rent comps 2 comps
| Address | Beds | Baths | Sqft | Rent | $/sqft | DOM | Units | Dist |
|---|---|---|---|---|---|---|---|---|
| 105 Landford Ct Lexington, SC | 3.0 | 2.0 | 1260 | $1,450 | $1.15 | 4d | 1 | 0.90mi |
| 600 Ermine Rd Lot 620 West Columbia, SC | 4.0 | 2.0 | 1216 | $1,875 | $1.54 | 20d | 1 | 1.35mi |
Listing history 28 events
-
2026-06-22days on market $168,000 Active 104 DOM
-
2026-06-18days on market $168,000 Active 101 DOM
-
2026-06-17days on market $168,000 Active 100 DOM
-
2026-06-16days on market $168,000 Active 99 DOM
-
2026-06-15price $168,000 Active 98 DOM
-
2026-06-15days on market $173,000 Active 98 DOM
-
2026-06-14days on market $173,000 Active 96 DOM
-
2026-06-10days on market $173,000 Active 93 DOM
-
2026-06-09days on market $173,000 Active 92 DOM
-
2026-06-08days on market $173,000 Active 91 DOM
-
2026-06-07days on market $173,000 Active 90 DOM
-
2026-06-03days on market $173,000 Active 86 DOM
-
2026-06-03days on market $173,000 Active 85 DOM
-
2026-06-02days on market $173,000 Active 84 DOM
-
2026-05-31days on market $173,000 Active 83 DOM
-
2026-05-13price $173,000
-
2026-04-15price $178,000
-
2026-03-28price $183,000
-
2026-03-21price $189,900
-
2026-03-16price $192,000
-
2026-03-09$195,000 Active
-
2020-06-04soldstatus $142,000
-
2020-04-07historical
-
2020-03-19$149,900 Active
-
2016-12-01soldstatus $96,000
-
1997-05-01soldstatus $24,095
-
1997-05-01soldstatus $48,915
-
1994-11-01soldstatus $74,000
ⓘ Source: listings_history table (triggers on properties + properties_extension) + one-shot
backfill from property_details.listing_events for pre-trigger history.
Tax reassessment forecast SC · Resets to sale price
- Current annual tax
- $848 · $71/mo
- Projected year-2 tax
- $958 · $80/mo
- Expected delta
- +$109/yr (+$9/mo · 12.9%)
ⓘ Screening estimate from a state-policy table — verify with the county assessor before closing.
Climate risk First Street
- Flood 1/10 Low FEMA zone X (unshaded) · 0% chance over 30 yrs
- Wildfire 2/10 Low
- Heat 6/10 Major 7 d/yr ≥108°F today · 16 d/yr by 30 yrs out
- Wind 6/10 Major 67% chance of damaging wind over 30 yrs
- Air quality 3/10 Moderate 2 unhealthy d/yr today · 2 by 30 yrs out
Nearby sold comps map
Loading sold comps map…
Walkable amenities ~0.75 mi
Loading nearby amenities…
Taxation est. · year 1
- Rental income
- $22,934
- − Mortgage interest
- −$9,411
- − Property taxes
- −$848
- − Insurance
- −$840
- − Repairs & maintenance
- −$1,835
- − Management
- −$1,835
- − Depreciation
- −$4,887
- Taxable income
- $3,279
- Est. tax owed @ 24.0%
- −$787
- After-tax cash flow
- $5,071/yr
For passive investors: Depreciation is non-cash, so a rental often shows a tax loss while cash-flowing — sheltering income. Rental losses are passive: they offset passive income freely, and up to $25,000/yr can offset ordinary (W-2) income if you actively participate and your MAGI is under $100k (phasing out to $0 by $150k); unused losses carry forward. On sale, claimed depreciation is recaptured at up to 25%, and gains may owe capital-gains tax (a 1031 exchange can defer both). Figures are a year-1 estimate at your 24.0% rate — not tax advice; consult a CPA.
Schools (NCES district)
- District
- Lexington 01
- NCES district ID
- 4502700
- Math proficiency
- 42% ▼ -12.00%
- Reading proficiency
- 53% ▼ -2.00%
- Median HH income
- $61,298
- Composite
- 41.75/100
- National rank
- #3399
- State rank
- #11 of 80 in SC
Livability — Oak Grove
- Score
- 66/100
- State rank
- #114
- US rank
- #11681
Category grades
Schools grade is shown separately in the Schools card above.
Census & demographics
- Census place
- Oak Grove, SC
- County
- Lexington County · 232,571 people
- Metro
- Columbia, SC
- Population (ZIP)
- 21,247
- Household income
- $74,902
- Rent vs Own
- Severe rent burden
- 147.0
Population outlook (Lexington County) Hauer SSP2
- Today (2025)
- 322,999 people
- By 2030
- 342,356 · +6.0%
- By 2040
- 377,715 · +16.9%
- By 2050
- 406,984 · +26.0%
- By 2075
- 465,447 · +44.1%
- By 2100
- 485,674 · +50.4%
Race, ethnicity, and origin ACS 2023
- Neighborhood character
- Predominantly White (66%)
- Race & ethnicity
- White 66% Black 17% Hispanic / Latino 10% Two or more races 8% Asian 3%
- Hispanic origin (detail)
- Mexican 6% Puerto Rican 1%
- Common ancestry
- Serbian 2% Italian 2% Romanian 2%
- Foreign-born
- 9% · Canada, Jamaica, Guatemala
- Languages at home
- 90% English-only · Spanish 7% Other Indo-European 2%
Political lean MEDSL · Lexington
- 2024 margin
- Solid R (+33.5) · D 32.5% · R 66.0% · Other 1.4%
- 2008→2024 swing
- +4.6pp toward D · 2008: -38.0pp · 2024: -33.5pp
- All cycles
- 2024: R+33.5 2020: R+30.1 2016: R+36.7 2012: R+37.8 2008: R+38.0
Not yet ingested
- Civics
- —
Market trends
- HPI YoY
- ▼ -52.72%
- Current HPI
- 259.713
- Rent YoY
- ▲ 4.57%
- Metro
- Columbia, SC
- State GDP YoY
- ▲ 4.51%
- F500 in state
- 2
Industry mix (Fortune 500 HQ in SC)
| Industry | F500 HQs | Revenue |
|---|---|---|
| Packaging | 1 | $7B |
|
||
Price history
+133.8% since first listed13 events — show timeline
- 2026-05-13 Price Changed $173,000 Consolidated MLS
- 2026-04-15 Price Changed $178,000 Consolidated MLS
- 2026-03-28 Price Changed $183,000 Consolidated MLS
- 2026-03-21 Price Changed $189,900 Consolidated MLS
- 2026-03-16 Price Changed $192,000 Consolidated MLS
- 2026-03-09 Listed $195,000 Consolidated MLS
- 2020-06-04 Sold (Public Records) $142,000 Public Records
- 2020-04-07 Delisted — Consolidated MLS
- 2020-03-19 Listed $149,900 Consolidated MLS
- 2016-12-01 Sold (Public Records) $96,000 Public Records
- 1997-05-01 Sold (Public Records) $48,915 Public Records
- 1997-05-01 Sold (Public Records) $24,095 Public Records
- 1994-11-01 Sold (Public Records) $74,000 Public Records
Property tax history
-6.1%/yrLatest (2024): $848 · +4.4% YoY. Source: county tax records.
Cash-flow waterfall
monthlySold comps — $/sqft
last 12 mo · ≤1 miLoading sold comps…