 🏗️ New Construction
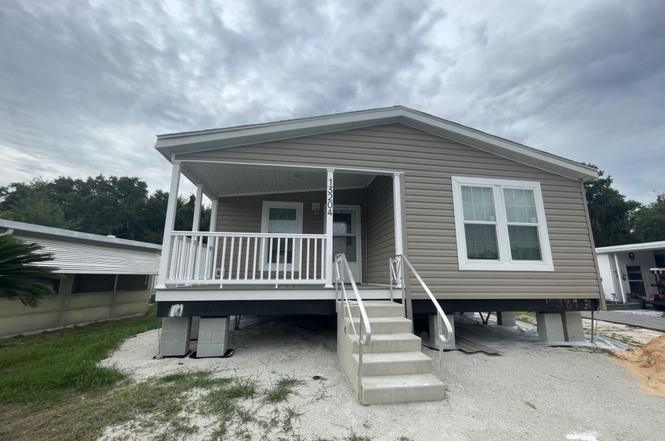
Silver Springs Plan · Eustis, FL
Flood risk 1/10 · Minimal
- FEMA flood zone
- X (unshaded)
- Chance of flooding over 30 yrs
- 0.0%
- Est. flood insurance / yr
- $507 – $1,088
Fire risk 4/10 · Minor
- Est. fire insurance / yr
- $947 – $1,759
Heat risk 9/10 · Severe
- Hot days now (above 107°F)
- 7 days/yr
- Hot days in 30 yrs
- 21 days/yr
Wind risk 9/10 · Severe
- Chance of severe wind over 30 yrs
- 99.0%
Air-quality risk 2/10 · Minimal
- Unhealthy air days now
- 1 days/yr
- Unhealthy air days in 30 yrs
- 1 days/yr
Risk factors via First Street. Map © Google.
Why this score? — see what drove the C- grade
The composite is a weighted blend of 9 inputs, each scored 0–100. Each bar is that input's sub-score; the figure is the points it added to the 100-point composite (weight × sub-score).
- Cash flow +17.6/30.0
- ARV discount +7.5/15.0
- DSCR +5.5/10.0
- 1% rule +4.7/10.0
- Schools +4.2/10.0
- Livability +3.7/5.0
- Appreciation +3.0/10.0
- Rent growth +2.5/5.0
- Condition / age +2.5/5.0
$159,900
🖨 Deal sheet 📄 Offer letter ✓ Due diligence
Listing remarks
55+ age qualified community. AVAILABLE SOON! Getting the final touches completed. Welcome to Grand Island Resort a 55+ age-qualified active and vibrant community, where you can find yourself in your dream home. We are located between Eustis and Leesburg off of state road 44 on beautiful Lake Eustis. We are excited to offer a brand new 2026 3 bed, 2 bath home for sale, featuring approximately 1352.00 sq ft of thoughtfully designed living space. Located in Grand Island, this soon-to-be-completed property will offer the perfect blend of modern design and timeless comfort. Construction is underway, and soon you'll be able to Step inside to find an open-concept floor plan, and lots of natural li
Key facts
- Large front porch
- Soft close cabinetry
- Listed 123 days
Tags
Property features AI
Finance
- Other: Address: 13318 Sea Breeze Ln, Grand Island FL 32735; Status: Active
- Financial info: List price $159,900
Exterior
- Home design: Single-family plan home (Silver Springs)
- Construction: Built as part of the Silver Springs plan; Living area approximately 1352
- Exterior features: New construction plan
Interior
- Bedrooms: 3 bedrooms
- Bathrooms: 2 full bathrooms
- Interior features: Plan home (Silver Springs plan)
Neighborhood map
What this means for you Summary
Snapshot
- This is a 3-bed/2.0-bath manufactured listed at $160k.
Deal economics
- At list price, monthly cash flow is $126 ($2k/yr) — positive.
- The deal already cash-flows at list — no discount required.
- To meet the 1% rule (rent ≥ 1% of price), the offer needs to be $156k (2.5% below list).
- Recommended offer: $141k (12.0% below list) — sets the bar for market timing.
- Cap rate 7.2% vs local median 4.5% in Eustis — top-decile yield for the area; either an underpriced asset or a hidden risk that comps aren't pricing in. Stress-test before assuming the spread holds.
Location & tenants
- Location reads 73/100 on livability (#309 in FL) — a middle-class / working-renter tenant base. Strengths: cost of living A+, housing A+, health & safety A; Watch: employment C-, schools D+, amenities F.
- Lake (suburban): math 49% / reading 50% proficiency, ranked #37 of 73 in FL (top 51%) — families likely to look elsewhere, expect single-tenant / working-renter base with shorter leases.
- Market conditions: 76 active listings in the ZIP; 8 comparable units currently listed for rent nearby; rentals at typical pace (median 15d on market — plan ~3-4 weeks tenant-placement turnaround); 4,799 units permitted in Lake County in 2024 (814 in 5+ unit buildings).
Forward outlook
- Local home prices are declining (-3.0%/yr); year-one equity from $1k of loan paydown is wiped out by about $5k of value loss. Plan a longer hold.
- Lake County population projected at +37% by 2050 — long-run rental-demand tailwind backs the buy-and-hold thesis.
Negotiation context
- It's been on market 123 days — a 12% lower offer ($141k) is reasonable based on typical stale-listing flexibility.
Risks & watch-outs
- Climate carrying-cost: severe wind risk, 99% chance of damaging wind over 30y; extreme-heat days projected 7→21/yr by 2055 (HVAC capex compounding) — expect insurance premiums to compound above CPI over the hold.
Questions for the listing agent
- It's been on market 123 days. Have you received any prior offers? Is the seller open to a 12% concession, seller financing, or rate buy-down credit?
- Why hasn't it sold? Are there any deal-killer items the seller is aware of (foundation, flood, title, zoning, code violations)?
- Is there a deadline driving the sale (1031 exchange, divorce, estate, relocation)? That informs how much negotiation room exists.
- Schools are D-rated, which usually means shorter tenancies and higher turnover. Who's the typical renter profile here, and what's been the actual vacancy rate?
- What's the average days-on-market for RENTAL listings here right now (not sales)? A rising rental-DOM trend means longer vacancies and softer asking-rent achievability than the comps imply.
- What's the recent tenant-quality profile in this submarket — average credit score on applications, eviction rate, late-payment / NSF rate, and stable-employment percentage? A property-management company in the area should have these aggregated.
- How much new for-sale + rental construction is in the pipeline within 1–3 miles? Heavy new supply typically softens prices + rents 12–24 months out; constrained supply supports both.
Investment metrics
- 1% rule
- 0.97% ✗
- Cap rate
- 7.24%
- Cash-on-cash
- 3.38%
- DSCR
- 1.15
- GRM
- 8.6
CMA / ARV
No comps found within radius.
Projected returns pro-forma
-3.0% appreciation · 3.0% rent growth · sell at horizon
- IRR
- -11.0%
- Equity multiple
- 0.60×
- Total profit
- $-17,864
- Equity at exit
- $23,842
- IRR
- -1.7%
- Equity multiple
- 0.89×
- Total profit
- $-5,128
- Equity at exit
- $13,825
Cash invested: $44,772 (down + closing). Projections, not guarantees.
Landlord ↔ Tenant lean methodology
- Overall (STATE)
- 87 Strongly Landlord-Friendly
- State Florida
- 87 Strongly Landlord-Friendly · R+3
- County
- — inherits STATE
- City
- — inherits STATE
ZIP-level market 32735
- Home prices YoY
- -1.5%
- Active inventory
- 76
- Price-to-rent
- 8.6×
Monthly cashflow live
- Estimated rent
- $1,558 high interval (Pro) →
- Mortgage (P&I)
- −$839
- Tax est. 1.5%
- −$200 /mo · $2,398/yr
- Insurance
- −$67
- HOA
- −$0
- Vacancy / Maint / Mgmt
- −$327
- Net cashflow
- $126
Break-even live
UW: 25.0% down · 7.5% · 30yr · 1.5% tax · 5.0% vac · 8.0% maint · 8.0% mgmt
Financing live
Cash to close
- Down payment
- $39,975
- Closing costs
- $4,797
- Reserves months
- —
- Total cash needed
- —
Loan-product check · same deal, 3 products live
Conventional
25% down · 7.5% · 30yr
- Down + closing
- —
- Monthly P&I
- —
- Monthly cashflow
- —
- DSCR
- —
- Eligible?
- —
Personal DTI + credit; lowest rate.
DSCR
20% down · 8.5% · 30yr
- Down + closing
- —
- Monthly P&I
- —
- Monthly cashflow
- —
- DSCR
- —
- Eligible?
- —
No personal income docs; deal must DSCR.
Hard money
10% down · 12.0% · 12mo
- Down + closing
- —
- Monthly P&I
- —
- Monthly cashflow
- —
- DSCR
- —
- Eligible?
- —
Short-term bridge; refi at stabilization.
Rent comps 8 comps
| Address | Beds | Baths | Sqft | Rent | $/sqft | DOM | Units | Dist |
|---|---|---|---|---|---|---|---|---|
| 36126 Plum Ave Grand Island, FL | 3.0 | 2.0 | 1393 | $1,599 | $1.15 | 14d | 1 | 0.12mi |
| 36116 Plum Ave Grand Island, FL | 2.0 | 2.0 | 1372 | $1,299 | $0.95 | 12d | 1 | 0.12mi |
| 13228 Grand Terrace Dr Grand Island, FL | 3.0 | 1.0 | 1296 | $1,900 | $1.47 | 14d | 1 | 0.13mi |
| 13124 Lemon Ave Grand Island, FL | 2.0 | 2.0 | 1216 | $1,399 | $1.15 | 12d | 1 | 0.18mi |
| 13122 Grape Ave Grand Island, FL | 3.0 | 2.0 | 1123 | $1,299 | $1.16 | 16d | 1 | 0.22mi |
| 37124 Scenic Ridge Dr Grand Island, FL | 3.0 | 2.0 | 1584 | $2,049 | $1.29 | 23d | 1 | 1.02mi |
| 35901 Joewood Ave Leesburg, FL | 3.0 | 2.0 | 1483 | $2,100 | $1.42 | 17d | 1 | 1.30mi |
| 35689 Rose Moss Ave Leesburg, FL | 3.0 | 2.0 | 1270 | $1,800 | $1.42 | 5d | 1 | 1.44mi |
Listing history 13 events
-
2026-06-18days on market $159,900 Active 123 DOM
-
2026-06-17days on market $159,900 Active 122 DOM
-
2026-06-16days on market $159,900 Active 121 DOM
-
2026-06-15days on market $159,900 Active 120 DOM
-
2026-06-13days on market $159,900 Active 118 DOM
-
2026-06-09pricedays on market $159,900 Active 114 DOM
-
2026-06-08days on market $89,900 Active 689 DOM
-
2026-06-07pricedays on market $89,900 Active 688 DOM
-
2026-06-04days on market $159,900 Active 111 DOM
-
2026-06-03days on market $159,900 Active 110 DOM
-
2026-06-02days on market $159,900 Active 109 DOM
-
2026-06-02days on market $159,900 Active 108 DOM
-
2026-05-31days on market $159,900 Active 107 DOM
ⓘ Source: listings_history table (triggers on properties + properties_extension) + one-shot
backfill from property_details.listing_events for pre-trigger history.
Climate risk First Street
- Flood 1/10 Low FEMA zone X (unshaded) · 0% chance over 30 yrs
- Wildfire 4/10 Moderate
- Heat 9/10 Extreme 7 d/yr ≥107°F today · 21 d/yr by 30 yrs out
- Wind 9/10 Extreme 99% chance of damaging wind over 30 yrs
- Air quality 2/10 Low 1 unhealthy d/yr today · 1 by 30 yrs out
Nearby sold comps map
Loading sold comps map…
Walkable amenities ~0.75 mi
Loading nearby amenities…
Taxation est. · year 1
- Rental income
- $18,699
- − Mortgage interest
- −$8,957
- − Property taxes
- −$2,398
- − Insurance
- −$800
- − Repairs & maintenance
- −$1,496
- − Management
- −$1,496
- − Depreciation
- −$4,652
- Taxable loss
- −$1,099
- Est. tax savings @ 24.0%
- +$264
- After-tax cash flow
- $1,776/yr
For passive investors: Depreciation is non-cash, so a rental often shows a tax loss while cash-flowing — sheltering income. Rental losses are passive: they offset passive income freely, and up to $25,000/yr can offset ordinary (W-2) income if you actively participate and your MAGI is under $100k (phasing out to $0 by $150k); unused losses carry forward. On sale, claimed depreciation is recaptured at up to 25%, and gains may owe capital-gains tax (a 1031 exchange can defer both). Figures are a year-1 estimate at your 24.0% rate — not tax advice; consult a CPA.
Schools (NCES district)
- District
- Lake
- NCES district ID
- 1201050
- Math proficiency
- 49% ▼ -7.00%
- Reading proficiency
- 50% ▼ -4.00%
- Median HH income
- $46,632
- Composite
- 42.05/100
- National rank
- #3327
- State rank
- #37 of 73 in FL
Livability — Eustis
- Score
- 73/100
- State rank
- #309
- US rank
- #5286
Category grades
Schools grade is shown separately in the Schools card above.
Census & demographics
- City population
- 24,715
- Population (ZIP)
- 5,346
Population outlook (Lake County) Hauer SSP2
- Today (2025)
- 386,640 people
- By 2030
- 417,107 · +7.9%
- By 2040
- 476,676 · +23.3%
- By 2050
- 531,296 · +37.4%
- By 2075
- 648,303 · +67.7%
- By 2100
- 698,530 · +80.7%
Race, ethnicity, and origin ACS 2023
- Neighborhood character
- Predominantly White (78%)
- Race & ethnicity
- White 78% Two or more races 8% Black 7% Asian 4% Hispanic / Latino 3%
- Common ancestry
- Slovak 3% Lithuanian 2% Danish 1%
- Foreign-born
- 7% · Canada
- Languages at home
- 96% English-only · Other Indo-European 3% Spanish 1%
Political lean MEDSL · Lake
- 2024 margin
- Strong R (+24.7) · D 37.3% · R 62.0%
- 2008→2024 swing
- -11.2pp toward R · 2008: -13.5pp · 2024: -24.7pp
- All cycles
- 2024: R+24.7 2020: R+20.0 2016: R+23.1 2012: R+17.1 2008: R+13.5
Not yet ingested
- Civics
- —
Market trends
- HPI YoY
- ▼ -4.00%
- Current HPI
- 267.8376
- Rent YoY
- —
- Metro
- —
- State GDP YoY
- ▲ 3.28%
- F500 in state
- 36
Industry mix (Fortune 500 HQ in FL)
| Industry | F500 HQs | Revenue |
|---|---|---|
| Industrial Technology | 2 | $29B |
|
||
| Insurance | 2 | $17B |
|
||
| Retail | 1 | $60B |
|
||
| Technology Distribution | 1 | $58B |
|
||
| Homebuilding | 1 | $35B |
|
||
| Technology Manufacturing | 1 | $35B |
|
||
Cash-flow waterfall
monthlySold comps — $/sqft
last 12 mo · ≤1 miLoading sold comps…