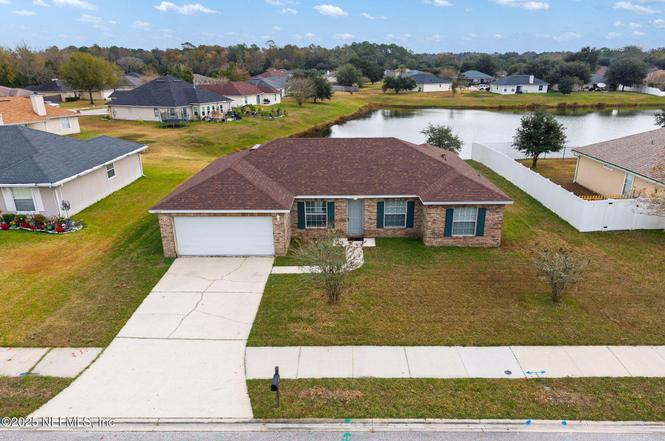
11673 Rolling River Blvd · Jacksonville, FL
Flood risk 1/10 · Minimal
- FEMA flood zone
- X (unshaded)
- Chance of flooding over 30 yrs
- 0.0%
- Est. flood insurance / yr
- $507 – $1,088
Fire risk 4/10 · Minor
- Est. fire insurance / yr
- $947 – $1,759
Heat risk 9/10 · Severe
- Hot days now (above 107°F)
- 7 days/yr
- Hot days in 30 yrs
- 21 days/yr
Wind risk 9/10 · Severe
- Chance of severe wind over 30 yrs
- 99.0%
Air-quality risk 4/10 · Minor
- Unhealthy air days now
- 5 days/yr
- Unhealthy air days in 30 yrs
- 7 days/yr
Risk factors via First Street. Map © Google.
Why this score? — see what drove the D+ grade
The composite is a weighted blend of 9 inputs, each scored 0–100. Each bar is that input's sub-score; the figure is the points it added to the 100-point composite (weight × sub-score).
- ARV discount +14.5/15.0
- Cash flow +11.9/30.0
- Livability +4.2/5.0
- 1% rule +3.9/10.0
- Schools +3.9/10.0
- DSCR +3.5/10.0
- Condition / age +2.5/5.0
- Rent growth +2.4/5.0
- Appreciation +0.0/10.0
$250,000
🖨 Deal sheet (PDF) 📄 Offer letter ✓ Due diligence
Listing remarks
HIGHEST AND BEST BY 5PM TUESDAY JUNE 2ND!! Welcome home to this beautiful 4-bedroom, 2-bath gem perfectly positioned on a serene pond with breathtaking water views from your own backyard. Wake up to tranquil sunrises over the water and enjoy evening cocktails while watching the birds flock to the pond - true Florida living at its finest! Step inside to an open and bright floor plan with vaulted ceilings and abundant natural light. The heart of the home is the gorgeous kitchen featuring brand new countertops, sleek modern cabinetry, , and a pass through breakfast bar that flows seamlessly into the living and dining areas - perfect for entertaining or everyday family life. Both showers have
Key facts
- Water views
- Gorgeous kitchen
- Modern vanities
Tags
Property features AI
Finance
- HOA & community: Homeowners association with quarterly fee; Quarterly association fee; Association amenities include basketball court, park, and playground
Exterior
- Parking: Garage; 2-car garage
- Utilities: Electricity connected; Sewer connected; Water connected
- Home design: Single family residence; Residential single-family use
- Exterior features: Patio; Pond on the property; Waterfront
Interior
- Kitchen: Microwave
- Bedrooms: 4 bedrooms
- Flooring: Carpet
- Bathrooms: 2 full bathrooms
- Heating & cooling: Central heating; Central air conditioning
- Interior features: Breakfast bar; Entrance foyer; Split bedroom layout; Walk-in closets
- Laundry & utility: Washer hookup; Electric dryer hookup; In-unit laundry
Neighborhood map
What this means for you Summary
Snapshot
- This is a 4-bed/2.0-bath single-family listed at $250k.
Deal economics
- At list price, monthly cash flow is $-62 ($-745/yr) — negative.
- To cash-flow at today's rent, offer at most $239k (4.4% below list).
- To meet the 1% rule (rent ≥ 1% of price), the offer needs to be $223k (10.7% below list).
- Recommended offer: $223k (10.7% below list) — sets the bar for 1% rule.
- Cap rate 6.0% vs local median 3.9% in Jacksonville — top-decile yield for the area; either an underpriced asset or a hidden risk that comps aren't pricing in. Stress-test before assuming the spread holds.
Location & tenants
- Location reads 83/100 on livability (#50 in FL, #911 nationally) — a professional / high-income tenant draw. Strengths: amenities A+, commute A+, housing A+.
- Duval (urban): math 46% / reading 45% proficiency, ranked #48 of 73 in FL (top 66%) — families likely to look elsewhere, expect single-tenant / working-renter base with shorter leases.
- Zoned schools: Dinsmore Elementary School (math 61% / reading 47%, grade C, #936 of 2,144 statewide, top 44%, 595 students, 53% FRL); Highlands Middle School (math 31% / reading 21%, grade F, #506 of 571 statewide, top 89%, 697 students, 73% FRL); Jean Ribault High School (math 22% / reading 25%, grade F, #533 of 667 statewide, top 80%, 1,385 students, 71% FRL) — zoned schools average 66% FRL vs 49% district-wide (16 pts higher); higher-poverty schools than district average — tighter screening recommended.
- Market conditions: Rents soft (-0.2%/yr); 549 active listings in the ZIP; 4 comparable units currently listed for rent nearby; rentals leasing fast (median 6d on market — plan ~1-2 weeks tenant-placement turnaround); 6,503 units permitted in Duval County in 2024 (1,131 in 5+ unit buildings).
- This rent runs 37% of the median local income ($72k/yr) — at the standard rent-burdened threshold; future hikes will face affordability resistance.
Forward outlook
- Local home prices are declining (-3.0%/yr); year-one equity from $2k of loan paydown is wiped out by about $8k of value loss. Plan a longer hold.
- Duval County population projected at +19% by 2050 — long-run rental-demand tailwind backs the buy-and-hold thesis.
Negotiation context
- It's been on market 103 days — a 9% lower offer ($228k) is reasonable based on typical stale-listing flexibility.
- 4 sale attempts; this cycle's ask has dropped $35k (12%) from the opening price — seller is motivated, your offer sets the floor, not the list.
Risks & watch-outs
- Climate carrying-cost: severe wind risk, 99% chance of damaging wind over 30y; extreme-heat days projected 7→21/yr by 2055 (HVAC capex compounding) — expect insurance premiums to compound above CPI over the hold.
Questions for the listing agent
- What do current leases actually rent for vs. the listed asking? Can we see a recent rent roll and the last 12 months of T-12 income?
- It's been on market 103 days. Have you received any prior offers? Is the seller open to a 11% concession, seller financing, or rate buy-down credit?
- What does the HOA fee cover, when was the last increase, and are there any pending special assessments or reserve-fund shortfalls?
- Why hasn't it sold? Are there any deal-killer items the seller is aware of (foundation, flood, title, zoning, code violations)?
- Is there a deadline driving the sale (1031 exchange, divorce, estate, relocation)? That informs how much negotiation room exists.
- Schools are B-rated — typically a magnet for longer-tenancy family renters. What's the average tenant stay here, and is there a school-zone premium baked into asking?
- The area grade is low — what's the realistic commute time and amenity access for the typical tenant pool here? Any planned neighborhood developments (good or bad) we should know about?
- What's the average days-on-market for RENTAL listings here right now (not sales)? A rising rental-DOM trend means longer vacancies and softer asking-rent achievability than the comps imply.
- What's the recent tenant-quality profile in this submarket — average credit score on applications, eviction rate, late-payment / NSF rate, and stable-employment percentage? A property-management company in the area should have these aggregated.
- How much new for-sale + rental construction is in the pipeline within 1–3 miles? Heavy new supply typically softens prices + rents 12–24 months out; constrained supply supports both.
Investment metrics
- 1% rule
- 0.89% ✗
- Cap rate
- 6.00%
- Cash-on-cash
- -1.06%
- DSCR
- 0.95
- GRM
- 9.3
CMA / ARV
- ARV (on-the-fly)
- $295,970
- Comps found
- 12
Show comp detail 12 sales within ~0.75 mi
| Address | Dist | Beds/Ba | Sqft | Sold | Price | $/sf | Match |
|---|---|---|---|---|---|---|---|
| 6960 Rapid River Dr | 0.12mi | 4/2.0 | 1,781 (+2%) | 13mo | $279,900 | $157 | 80 |
| 11714 Raindrop Rd | 0.15mi | 3/2.0 (-1) | 1,845 (+6%) | 1mo | $305,000 | $165 | 78 |
| 11513 Driftwood Creek Dr | 0.57mi | 4/2.0 | 1,701 (-2%) | 11mo | $290,000 | $170 | 61 |
| 11630 Turtle Run Ct | 0.15mi | 3/2.0 (-1) | 1,519 (-13%) | 12mo | $257,500 | $170 | 56 |
| 6759 Salt Pond Dr N | 0.31mi | 3/2.0 (-1) | 1,492 (-14%) | 3mo | $269,000 | $180 | 54 |
| 11517 Rolling River Blvd | 0.20mi | 3/2.0 (-1) | 1,506 (-14%) | 12mo | $245,000 | $163 | 53 |
| 6907 Sandle Dr | 0.69mi | 3/2.0 (-1) | 1,711 (-2%) | 9mo | $306,500 | $179 | 52 |
| 6985 Sandle Dr | 0.64mi | 4/2.0 | 1,862 (+7%) | 15mo | $310,000 | $166 | 46 |
| 12272 Cadley Cir | 0.53mi | 3/2.0 (-1) | 1,493 (-14%) | 2mo | $290,000 | $194 | 45 |
| 11646 Driftwood Creek Dr | 0.53mi | 3/2.0 (-1) | 1,537 (-12%) | 7mo | $300,000 | $195 | 44 |
| 12241 Crossfield Dr | 0.75mi | 4/2.0 | 1,861 (+7%) | 16mo | $270,000 | $145 | 40 |
| 6376 Spring Hollow Ct | 0.71mi | 3/2.0 (-1) | 1,844 (+6%) | 17mo | $290,000 | $157 | 38 |
Match score weights: distance 35% · size 25% · config 20% · recency 20%. Top-matched comps best support the ARV.
Projected returns pro-forma
-3.0% appreciation · 0.0% rent growth · sell at horizon
- IRR
- -21.6%
- Equity multiple
- 0.27×
- Total profit
- $-50,915
- Equity at exit
- $37,276
- IRR
- -25.6%
- Equity multiple
- -0.06×
- Total profit
- $-74,339
- Equity at exit
- $21,615
Cash invested: $70,000 (down + closing). Projections, not guarantees.
Landlord ↔ Tenant lean methodology
- Overall (STATE)
- 87 Strongly Landlord-Friendly
- State Florida
- 87 Strongly Landlord-Friendly · R+3
- County
- — inherits STATE
- City
- — inherits STATE
ZIP-level market 32219
- Home prices YoY
- -22.3%
- Rents YoY
- -0.2%
- Active inventory
- 549
- Price-to-rent
- 9.3×
Monthly cashflow live
- Estimated rent
- $2,234 medium interval (Pro) →
- Mortgage (P&I)
- −$1,311
- Tax from tax record
- −$388 /mo · $4,650/yr
- Insurance
- −$104
- HOA
- −$24
- Vacancy / Maint / Mgmt
- −$469
- Net cashflow
- $-62
Break-even live
Sensitivity live
| Price | -10% $79 | -5% $9 | +0% $-62 | +5% $-133 | +10% $-204 |
|---|---|---|---|---|---|
| Rent | -10% $-239 | -5% $-150 | +0% $-62 | +5% $26 | +10% $114 |
| Rate | -1.0pp $64 | -0.5pp $2 | base $-62 | +0.5pp $-127 | +1.0pp $-193 |
UW: 25.0% down · 7.5% · 30yr · 1.5% tax · 5.0% vac · 8.0% maint · 8.0% mgmt
Financing live
Cash to close
- Down payment
- $62,500
- Closing costs
- $7,500
- Reserves months
- —
- Total cash needed
- —
Loan-product check · same deal, 3 products live
Conventional
25% down · 7.5% · 30yr
- Down + closing
- —
- Monthly P&I
- —
- Monthly cashflow
- —
- DSCR
- —
- Eligible?
- —
Personal DTI + credit; lowest rate.
DSCR
20% down · 8.5% · 30yr
- Down + closing
- —
- Monthly P&I
- —
- Monthly cashflow
- —
- DSCR
- —
- Eligible?
- —
No personal income docs; deal must DSCR.
Hard money
10% down · 12.0% · 12mo
- Down + closing
- —
- Monthly P&I
- —
- Monthly cashflow
- —
- DSCR
- —
- Eligible?
- —
Short-term bridge; refi at stabilization.
Rent comps 4 comps
| Address | Beds | Baths | Sqft | Rent | $/sqft | DOM | Units | Dist |
|---|---|---|---|---|---|---|---|---|
| 11614 Rainbow Springs Ct Jacksonville, FL | 3.0 | 2.0 | 1605 | $1,960 | $1.22 | 19d | 1 | 0.12mi |
| 6407 Timber Cove Ct Jacksonville, FL | 3.0 | 2.0 | 1541 | $2,049 | $1.33 | 4d | 1 | 0.49mi |
| 12331 Glimmer Way Jacksonville, FL | 3.0 | 2.0 | 1711 | $2,085 | $1.22 | 3d | 1 | 1.02mi |
| 7053 Civic Club Dr Jacksonville, FL | 4.0 | 2.5 | 1771 | $2,180 | $1.23 | 5d | 1 | 1.38mi |
HOA detail
- Monthly dues
- $24 · $288/yr
- Likely covers
- water
Listing history 14 events
-
2026-06-03statusdays on market $250,000 Pending 103 DOM
-
2026-06-02days on market $250,000 Active 102 DOM
-
2026-06-01days on market $250,000 Active 101 DOM
-
2026-05-31days on market $250,000 Active 100 DOM
-
2026-05-21price $265,000
-
2026-05-13status Active
-
2026-04-10price $279,500
-
2026-03-17status Active
-
2026-03-04status Pending
-
2026-03-04historical
-
2026-01-27status Active
-
2026-01-17status Pending
-
2025-12-02$285,000 Active
-
2005-06-03soldstatus $1,296,800
ⓘ Source: listings_history table (triggers on properties + properties_extension) + one-shot
backfill from property_details.listing_events for pre-trigger history.
Tax reassessment forecast FL · Resets to sale price
- Current annual tax
- $4,650 · $388/mo
- Projected year-2 tax
- $4,650 · $388/mo
- Expected delta
- $0/yr ($0/mo · 0.0%)
ⓘ Screening estimate from a state-policy table — verify with the county assessor before closing.
Climate risk First Street
- Flood 1/10 Low FEMA zone X (unshaded) · 0% chance over 30 yrs
- Wildfire 4/10 Moderate
- Heat 9/10 Extreme 7 d/yr ≥107°F today · 21 d/yr by 30 yrs out
- Wind 9/10 Extreme 99% chance of damaging wind over 30 yrs
- Air quality 4/10 Moderate 5 unhealthy d/yr today · 7 by 30 yrs out
Nearby sold comps map
Loading sold comps map…
Walkable amenities ~0.75 mi
Loading nearby amenities…
Taxation est. · year 1
- Rental income
- $26,805
- − Mortgage interest
- −$14,004
- − Property taxes
- −$4,650
- − Insurance
- −$1,250
- − Repairs & maintenance
- −$2,144
- − Management
- −$2,144
- − HOA
- −$288
- − Depreciation
- −$7,273
- Taxable loss
- −$4,949
- Est. tax savings @ 24.0%
- +$1,188
- After-tax cash flow
- $443/yr
For passive investors: Depreciation is non-cash, so a rental often shows a tax loss while cash-flowing — sheltering income. Rental losses are passive: they offset passive income freely, and up to $25,000/yr can offset ordinary (W-2) income if you actively participate and your MAGI is under $100k (phasing out to $0 by $150k); unused losses carry forward. On sale, claimed depreciation is recaptured at up to 25%, and gains may owe capital-gains tax (a 1031 exchange can defer both). Figures are a year-1 estimate at your 24.0% rate — not tax advice; consult a CPA.
Schools (NCES district)
- District
- Duval
- NCES district ID
- 1200480
- Math proficiency
- 46% ▼ -11.00%
- Reading proficiency
- 45% ▼ -4.00%
- Median HH income
- $48,987
- Composite
- 38.97/100
- National rank
- #4076
- State rank
- #48 of 73 in FL
Livability — Jacksonville
- Score
- 83/100
- State rank
- #50
- US rank
- #911
Category grades
Schools grade is shown separately in the Schools card above.
Census & demographics
- Census place
- Jacksonville, FL
- County
- Duval County · 1,015,274 people
- City population
- 979,034
- Metro
- Jacksonville, FL
- Population (ZIP)
- 14,302
- Household income
- $72,184
- Rent vs Own
- Severe rent burden
- 173.0
Population outlook (Duval County) Hauer SSP2
- Today (2025)
- 1,013,010 people
- By 2030
- 1,059,228 · +4.6%
- By 2040
- 1,141,439 · +12.7%
- By 2050
- 1,205,258 · +19.0%
- By 2075
- 1,324,282 · +30.7%
- By 2100
- 1,319,620 · +30.3%
Race, ethnicity, and origin ACS 2023
- Neighborhood character
- Majority Black (55%)
- Race & ethnicity
- Black 55% White 39% Hispanic / Latino 4% Two or more races 3%
- Common ancestry
- Italian 2% Romanian 1% Hispanic 1%
- Foreign-born
- 4% · Canada, Jamaica
- Languages at home
- 95% English-only · Spanish 3% French/Haitian/Cajun 0%
Political lean MEDSL · Duval
- 2024 margin
- Toss-up / Even · D 48.7% · R 50.1% · Other 1.2%
- 2008→2024 swing
- +0.4pp no change · 2008: -1.9pp · 2024: -1.5pp
- All cycles
- 2024: R+1.5 2020: D+3.8 2016: R+1.5 2012: R+3.6 2008: R+1.9
Not yet ingested
- Civics
- —
Market trends
- HPI YoY
- ▼ -75.90%
- Current HPI
- 263.8901
- Rent YoY
- ▼ -0.25%
- Metro
- Jacksonville, FL
- State GDP YoY
- ▲ 3.28%
- F500 in state
- 36
Industry mix (Fortune 500 HQ in FL)
| Industry | F500 HQs | Revenue |
|---|---|---|
| Industrial Technology | 2 | $29B |
|
||
| Insurance | 2 | $17B |
|
||
| Retail | 1 | $60B |
|
||
| Technology Distribution | 1 | $58B |
|
||
| Homebuilding | 1 | $35B |
|
||
| Technology Manufacturing | 1 | $35B |
|
||
Price history
-79.6% since first listed10 events — show timeline
- 2026-05-21 Price Changed $265,000 realMLS
- 2026-05-13 Relisted — realMLS
- 2026-04-10 Price Changed $279,500 realMLS
- 2026-03-17 Relisted — realMLS
- 2026-03-04 Pending — realMLS
- 2026-03-04 Listing Removed — realMLS
- 2026-01-27 Relisted — realMLS
- 2026-01-17 Pending — realMLS
- 2025-12-02 Listed $285,000 realMLS
- 2005-06-03 Sold (Public Records) $1,296,800 Public Records
Property tax history
+8.1%/yrLatest (2025): $4,650 · +14.0% YoY. Source: county tax records.
Cash-flow waterfall
monthlySold comps — $/sqft
last 12 mo · ≤1 miLoading sold comps…