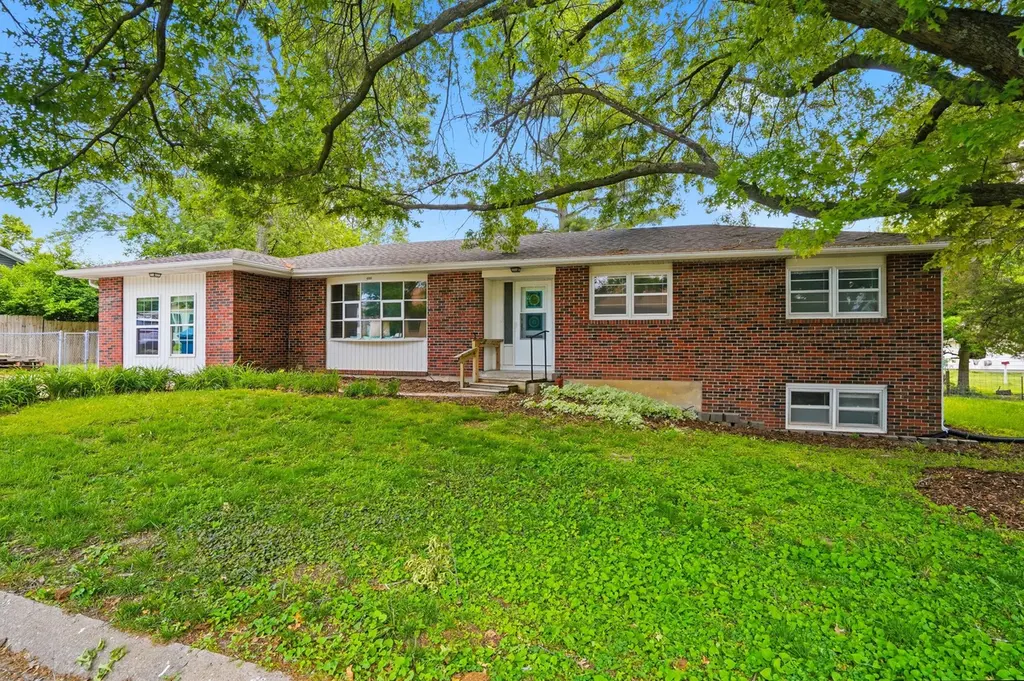
408 Meadow Ln · Ashland, MO
Flood risk 1/10 · Minimal
- FEMA flood zone
- X (unshaded)
- Chance of flooding over 30 yrs
- 0.0%
- Est. flood insurance / yr
- $473 – $860
Fire risk 3/10 · Minor
- Est. fire insurance / yr
- $1,054 – $1,958
Heat risk 4/10 · Minor
- Hot days now (above 106°F)
- 7 days/yr
- Hot days in 30 yrs
- 19 days/yr
Wind risk 2/10 · Minimal
- Chance of severe wind over 30 yrs
- —
Air-quality risk 1/10 · Minimal
- Unhealthy air days now
- 0 days/yr
- Unhealthy air days in 30 yrs
- 0 days/yr
Risk factors via First Street. Map © Google.
Why this score? — see what drove the C grade
The composite is a weighted blend of 9 inputs, each scored 0–100. Each bar is that input's sub-score; the figure is the points it added to the 100-point composite (weight × sub-score).
- Cash flow +25.4/30.0
- DSCR +8.4/10.0
- ARV discount +7.5/15.0
- 1% rule +6.0/10.0
- Schools +4.0/10.0
- Livability +3.5/5.0
- Rent growth +2.5/5.0
- Condition / age +2.5/5.0
- Appreciation +0.0/10.0
$200,000
🖨 Deal sheet 📄 Offer letter ✓ Due diligence
Listing remarks MLS
Lots of space for the money with hard surfaces on the entire main level. Located close to schools, library, pool, and downtown. Huge family room in the basement, great for fun and entertaining, covered back porch overlooking shaded and fenced back yard.
Key facts
- Zoned r-2
- Large yard
- Basement flooring
Tags
Property features AI
Exterior
- Parking: Open paved parking (no garage)
- Security: Smoke detector(s)
- Utilities: Public water
- Home design: Single-family residential property; Zoned R-2 (Two-family dwelling allowed)
- Construction: Below-grade finished area with walk-out basement (120 below-grade area)
- Exterior features: Covered patio/porch; Storm door(s); Partially wooded lot; Back yard fencing (partial chain link and wood)
Interior
- Kitchen: Refrigerator, Microwave, Dishwasher
- Flooring: Wood, Ceramic tile, Laminate, Vinyl
- Bathrooms: 2 full bathrooms
- Heating & cooling: Natural gas heating; Baseboard heating; Central air conditioning; Attic fan
- Interior features: Refrigerator, Microwave, Dishwasher; Sump pump and walk-out basement access; Smoke detector(s)
Neighborhood map
What this means for you Summary
Snapshot
- This is a 4-bed/2.0-bath single-family listed at $200k.
Deal economics
- At list price, monthly cash flow is $463 ($6k/yr) — positive.
- The deal already cash-flows at list — no discount required.
- Meets the 1% rule at list price ($2k rent vs $200k).
- Recommended offer: $197k (1.5% below list) — sets the bar for market timing.
- Cap rate 9.1% vs local median 3.1% in Ashland — top-decile yield for the area; either an underpriced asset or a hidden risk that comps aren't pricing in. Stress-test before assuming the spread holds.
Location & tenants
- Location reads 69/100 on livability (#155 in MO) — a middle-class / working-renter tenant base. Strengths: employment A+, cost of living A+, housing A+; Watch: amenities F, commute F, health & safety F.
- Southern Boone County R-I (rural): math 42% / reading 48% proficiency, ranked #66 of 324 in MO (top 20%) — families likely to look elsewhere, expect single-tenant / working-renter base with shorter leases; only 16% free/reduced lunch — higher-income household profile.
- Market conditions: 133 active listings in the ZIP; 1 comparable units currently listed for rent nearby; 1,303 units permitted in Boone County in 2024 (549 in 5+ unit buildings).
Forward outlook
- Local home prices are declining (-3.0%/yr); year-one equity from $1k of loan paydown is wiped out by about $6k of value loss. Plan a longer hold.
- Boone County population projected at +36% by 2050 — long-run rental-demand tailwind backs the buy-and-hold thesis.
Negotiation context
- It's been on market 20 days — a 2% lower offer ($197k) is reasonable based on typical stale-listing flexibility.
- 5 sale attempts since 23y ago with the ask held roughly flat each time — persistent listings suggest the price (not the market) is what's stuck; bring a comps-based counter.
Risks & watch-outs
- Watch-outs: built in 1959 — expect roof / HVAC / electrical / plumbing capex.
Questions for the listing agent
- Built in 1959 — when were the roof, HVAC, electrical panel, plumbing, and water heater last replaced?
- Is there a deadline driving the sale (1031 exchange, divorce, estate, relocation)? That informs how much negotiation room exists.
- What's the average days-on-market for RENTAL listings here right now (not sales)? A rising rental-DOM trend means longer vacancies and softer asking-rent achievability than the comps imply.
- What's the recent tenant-quality profile in this submarket — average credit score on applications, eviction rate, late-payment / NSF rate, and stable-employment percentage? A property-management company in the area should have these aggregated.
- How much new for-sale + rental construction is in the pipeline within 1–3 miles? Heavy new supply typically softens prices + rents 12–24 months out; constrained supply supports both.
Investment metrics
- 1% rule
- 1.10% ✓
- Cap rate
- 9.07%
- Cash-on-cash
- 9.92%
- DSCR
- 1.44
- GRM
- 7.6
CMA / ARV
- ARV (on-the-fly)
- $412,560
- Comps found
- 7
Show comp detail 7 sales within ~0.75 mi
| Address | Dist | Beds/Ba | Sqft | Sold | Price | $/sf | Match |
|---|---|---|---|---|---|---|---|
| 500 Marinas Ave | 0.47mi | 4/2.5 | 2,276 (-1%) | 3mo | $410,000 | $180 | 73 |
| 202 Cottonwood Dr | 0.21mi | 4/3.0 | 2,477 (+8%) | 15mo | $399,900 | $161 | 60 |
| 500 Appaloosa Dr | 0.17mi | 3/2.0 (-1) | 1,963 (-14%) | 4mo | $380,000 | $194 | 60 |
| 504 Breton Way | 0.30mi | 3/2.5 (-1) | 2,000 (-13%) | 0mo | $349,900 | $175 | 58 |
| 307 Jameson Dr | 0.52mi | 4/2.0 | 1,992 (-13%) | 10mo | $365,000 | $183 | 46 |
| 15320 Amendment Rd | 0.62mi | 4/3.0 | 2,098 (-8%) | 10mo | $427,000 | $204 | 45 |
| 200 E Liberty Ln | 0.67mi | 4/2.0 | 2,080 (-9%) | 15mo | $179,900 | $86 | 40 |
Match score weights: distance 35% · size 25% · config 20% · recency 20%. Top-matched comps best support the ARV.
Projected returns pro-forma
-3.0% appreciation · 3.0% rent growth · sell at horizon
- IRR
- -1.4%
- Equity multiple
- 0.95×
- Total profit
- $-2,946
- Equity at exit
- $29,821
- IRR
- 8.3%
- Equity multiple
- 1.63×
- Total profit
- $35,281
- Equity at exit
- $17,292
Cash invested: $56,000 (down + closing). Projections, not guarantees.
Landlord ↔ Tenant lean methodology
- Overall (STATE)
- 81 Strongly Landlord-Friendly
- State Missouri
- 81 Strongly Landlord-Friendly · R+10
- County
- — inherits STATE
- City
- — inherits STATE
ZIP-level market 65010
- Home prices YoY
- -22.9%
- Active inventory
- 133
- Price-to-rent
- 7.6×
Monthly cashflow live
- Estimated rent
- $2,200 medium interval (Pro) →
- Mortgage (P&I)
- −$1,049
- Tax from tax record
- −$143 /mo · $1,713/yr
- Insurance
- −$83
- HOA
- −$0
- Vacancy / Maint / Mgmt
- −$462
- Net cashflow
- $463
Break-even live
UW: 25.0% down · 7.5% · 30yr · 1.5% tax · 5.0% vac · 8.0% maint · 8.0% mgmt
Financing live
Cash to close
- Down payment
- $50,000
- Closing costs
- $6,000
- Reserves months
- —
- Total cash needed
- —
Loan-product check · same deal, 3 products live
Conventional
25% down · 7.5% · 30yr
- Down + closing
- —
- Monthly P&I
- —
- Monthly cashflow
- —
- DSCR
- —
- Eligible?
- —
Personal DTI + credit; lowest rate.
DSCR
20% down · 8.5% · 30yr
- Down + closing
- —
- Monthly P&I
- —
- Monthly cashflow
- —
- DSCR
- —
- Eligible?
- —
No personal income docs; deal must DSCR.
Hard money
10% down · 12.0% · 12mo
- Down + closing
- —
- Monthly P&I
- —
- Monthly cashflow
- —
- DSCR
- —
- Eligible?
- —
Short-term bridge; refi at stabilization.
Rent comps 1 comps
| Address | Beds | Baths | Sqft | Rent | $/sqft | DOM | Units | Dist |
|---|---|---|---|---|---|---|---|---|
| 4680 Treaty Dr Ashland, MO | 3.0 | 2.0 | 1650 | $2,200 | $1.33 | 13d | 1 | 0.41mi |
Listing history 13 events
-
2026-06-07statusdays on market $200,000 Pending 20 DOM
-
2026-06-02days on market $200,000 Active 17 DOM
-
2026-06-01days on market $200,000 Active 16 DOM
-
2026-05-31days on market $200,000 Active 15 DOM
-
2026-05-30days on market $200,000 Active 14 DOM
-
2026-05-14$210,000 Active
-
2014-07-03soldstatus 253-char remark
Show marketing remark (252 chars)
Lots of space for the money with hard surfaces on the entire main level. Located close to schools, library, pool, and downtown. Huge family room in the basement great for fun and entertaining, covered back porch overlooking shaded and fenced back yard.
-
2014-07-03soldstatus 252-char remark
Show marketing remark (252 chars)
Lots of space for the money with hard surfaces on the entire main level. Located close to schools, library, pool, and downtown. Huge family room in the basement great for fun and entertaining, covered back porch overlooking shaded and fenced back yard.
-
2014-04-24$119,900 253-char remark
Show marketing remark (252 chars)
Lots of space for the money with hard surfaces on the entire main level. Located close to schools, library, pool, and downtown. Huge family room in the basement great for fun and entertaining, covered back porch overlooking shaded and fenced back yard.
-
2014-04-24$119,900 252-char remark
Show marketing remark (252 chars)
Lots of space for the money with hard surfaces on the entire main level. Located close to schools, library, pool, and downtown. Huge family room in the basement great for fun and entertaining, covered back porch overlooking shaded and fenced back yard.
-
2013-06-27$124,900
-
2003-07-29soldstatus
-
2003-05-24$91,500
ⓘ Source: listings_history table (triggers on properties + properties_extension) + one-shot
backfill from property_details.listing_events for pre-trigger history.
Tax reassessment forecast MO · Resets to sale price
- Current annual tax
- $1,713 · $143/mo
- Projected year-2 tax
- $1,940 · $162/mo
- Expected delta
- +$227/yr (+$19/mo · 13.3%)
ⓘ Screening estimate from a state-policy table — verify with the county assessor before closing.
Climate risk First Street
- Flood 1/10 Low FEMA zone X (unshaded) · 0% chance over 30 yrs
- Wildfire 3/10 Moderate
- Heat 4/10 Moderate 7 d/yr ≥106°F today · 19 d/yr by 30 yrs out
- Wind 2/10 Low
- Air quality 1/10 Low 0 unhealthy d/yr today · 0 by 30 yrs out
Nearby sold comps map
Loading sold comps map…
Walkable amenities ~0.75 mi
Loading nearby amenities…
Taxation est. · year 1
- Rental income
- $26,400
- − Mortgage interest
- −$11,203
- − Property taxes
- −$1,713
- − Insurance
- −$1,000
- − Repairs & maintenance
- −$2,112
- − Management
- −$2,112
- − Depreciation
- −$5,818
- Taxable income
- $2,442
- Est. tax owed @ 24.0%
- −$586
- After-tax cash flow
- $4,971/yr
For passive investors: Depreciation is non-cash, so a rental often shows a tax loss while cash-flowing — sheltering income. Rental losses are passive: they offset passive income freely, and up to $25,000/yr can offset ordinary (W-2) income if you actively participate and your MAGI is under $100k (phasing out to $0 by $150k); unused losses carry forward. On sale, claimed depreciation is recaptured at up to 25%, and gains may owe capital-gains tax (a 1031 exchange can defer both). Figures are a year-1 estimate at your 24.0% rate — not tax advice; consult a CPA.
Schools (NCES district)
- District
- Southern Boone County R-I
- NCES district ID
- 2928560
- Math proficiency
- 42% ▼ -3.00%
- Reading proficiency
- 48% ▼ -2.00%
- Median HH income
- $64,240
- Composite
- 39.98/100
- National rank
- #3833
- State rank
- #66 of 324 in MO
Livability — Ashland
- Score
- 69/100
- State rank
- #155
- US rank
- #8688
Category grades
Schools grade is shown separately in the Schools card above.
Census & demographics
- Census place
- Ashland, MO
- City population
- 7,105
- Population (ZIP)
- 7,105
Population outlook (Boone County) Hauer SSP2
- Today (2025)
- 202,891 people
- By 2030
- 217,799 · +7.3%
- By 2040
- 246,789 · +21.6%
- By 2050
- 276,116 · +36.1%
- By 2075
- 348,426 · +71.7%
- By 2100
- 400,856 · +97.6%
Race, ethnicity, and origin ACS 2023
- Neighborhood character
- Predominantly White (93%)
- Race & ethnicity
- White 93% Two or more races 5% Hispanic / Latino 2%
- Common ancestry
- Lithuanian 2% Romanian 2% Slovak 1%
- Foreign-born
- 1%
- Languages at home
- 99% English-only · Other Indo-European 1%
Political lean MEDSL · Boone
- 2024 margin
- Lean D (+9.8) · D 53.9% · R 44.1% · Other 2.1%
- 2008→2024 swing
- -2.2pp toward R · 2008: 12.0pp · 2024: 9.8pp
- All cycles
- 2024: D+9.8 2020: D+12.5 2016: D+5.9 2012: D+3.1 2008: D+12.0
Not yet ingested
- Civics
- —
Market trends
- HPI YoY
- ▼ -67.49%
- Current HPI
- 227.6769
- Rent YoY
- —
- Metro
- —
- State GDP YoY
- ▲ 1.84%
- F500 in state
- 20
Industry mix (Fortune 500 HQ in MO)
| Industry | F500 HQs | Revenue |
|---|---|---|
| Healthcare | 1 | $163B |
|
||
| Insurance | 1 | $21B |
|
||
| Industrial Technology | 1 | $17B |
|
||
| Retail | 1 | $16B |
|
||
| Industrial Distribution | 1 | $10B |
|
||
| Utilities | 1 | $9B |
|
||
Price history
+129.5% since first listed8 events — show timeline
- 2026-05-14 Listed $210,000 CBORMLS
- 2014-07-03 Sold (MLS) — CBORMLS
- 2014-07-03 Sold (MLS) — JCMLS
- 2014-04-24 Listed $119,900 CBORMLS
- 2014-04-24 Listed $119,900 JCMLS
- 2013-06-27 Listed $124,900 JCMLS
- 2003-07-29 Sold (MLS) — CBORMLS
- 2003-05-24 Listed $91,500 CBORMLS
Property tax history
+4.1%/yrLatest (2025): $1,713 · +14.0% YoY. Source: county tax records.
Cash-flow waterfall
monthlySold comps — $/sqft
last 12 mo · ≤1 miLoading sold comps…