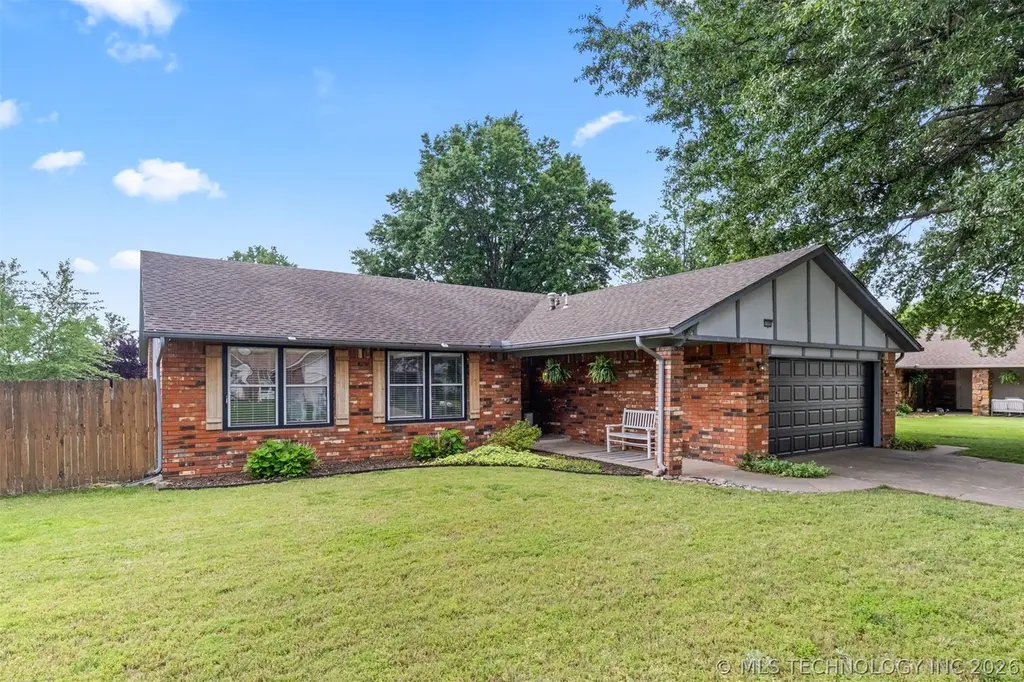
10002 E 117th Pl S · Bixby, OK
Flood risk 1/10 · Minimal
- FEMA flood zone
- X (unshaded)
- Chance of flooding over 30 yrs
- 0.0%
- Est. flood insurance / yr
- $473 – $860
Fire risk 4/10 · Minor
- Est. fire insurance / yr
- $2,463 – $4,575
Heat risk 7/10 · Major
- Hot days now (above 111°F)
- 7 days/yr
- Hot days in 30 yrs
- 18 days/yr
Wind risk 3/10 · Minor
- Chance of severe wind over 30 yrs
- 4.0%
Air-quality risk 2/10 · Minimal
- Unhealthy air days now
- 1 days/yr
- Unhealthy air days in 30 yrs
- 1 days/yr
Risk factors via First Street. Map © Google.
Why this score? — see what drove the D grade
The composite is a weighted blend of 9 inputs, each scored 0–100. Each bar is that input's sub-score; the figure is the points it added to the 100-point composite (weight × sub-score).
- Cash flow +13.0/30.0
- ARV discount +7.9/15.0
- DSCR +3.9/10.0
- Livability +3.6/5.0
- Schools +3.5/10.0
- Rent growth +3.3/5.0
- 1% rule +3.2/10.0
- Condition / age +2.5/5.0
- Appreciation +0.0/10.0
$259,900
🖨 Deal sheet (PDF) 📄 Offer letter ✓ Due diligence
Listing remarks MLS
PARTIAL BRICK EXTERIOR, FENCE, FIREPLACE, Offered as is with all faults, buyer responsible for costs/replacement of missing meters, SOLD AS IS, CASE NUMBER 405-928151 EXCLUSIVE AGENCY, ELIGIBLE FOR 100.00 DOWN PROGRAM
Key facts
- 0.24 acre lot
- 2 garage spots
- Built 1982
Property features AI
Finance
- HOA & community: Gutters listed as a community feature
Exterior
- Parking: Attached garage with 2 spaces
- Security: Smoke detectors; No safety shelter
- Utilities: Public water; Public sewer; Electricity available; Natural gas available; Cable available; High-speed internet available; Phone available
- Home design: Single-story home; Faces north; Slab foundation
- Construction: Brick and wood frame construction; Asphalt/fiberglass roof; Built per public records
- Exterior features: Covered patio/porch with deck; Concrete driveway; Rain gutters; Full privacy fencing
Interior
- Kitchen: Built-in oven; Cooktop; Range; Oven; Microwave; Dishwasher; Disposal
- Bedrooms: Master bedroom with private bath, separate closets and walk-in closet (first level); Additional bedrooms on the first level (no attached baths)
- Flooring: Carpet; Laminate; Tile
- Bathrooms: Two full bathrooms; Hall bathroom with bathtub (first level); Master bathroom with double sink and shower (first level)
- Heating & cooling: Central heating (gas); Central air conditioning
- Interior features: Granite counters; Laminate counters; High ceilings; Vaulted ceilings; Ceiling fans; Cable TV; Insulated windows with aluminum frames; Insulated doors; Electric oven connection; Gas range connection
- Laundry & utility: Washer hookup; Electric dryer hookup; Inside utility room (first level)
Neighborhood map
What this means for you Summary
Snapshot
- This is a 3-bed/2.0-bath single-family listed at $260k.
Deal economics
- At list price, monthly cash flow is $-15 ($-175/yr) — negative.
- To cash-flow at today's rent, offer at most $257k (1.0% below list).
- To meet the 1% rule (rent ≥ 1% of price), the offer needs to be $213k (18.0% below list).
- Recommended offer: $213k (18.0% below list) — sets the bar for 1% rule.
- Cap rate 6.2% vs local median 3.7% in Bixby — top-decile yield for the area; either an underpriced asset or a hidden risk that comps aren't pricing in. Stress-test before assuming the spread holds.
Location & tenants
- Location reads 72/100 on livability (#24 in OK) — a middle-class / working-renter tenant base. Strengths: crime A+, employment A+, housing A+; Watch: amenities F, commute F, health & safety F.
- Bixby (suburban): math 39% / reading 36% proficiency, ranked #15 of 270 in OK (top 6%) — families likely to look elsewhere, expect single-tenant / working-renter base with shorter leases; only 19% free/reduced lunch — higher-income household profile.
- Market conditions: Rents rising (+3.3%/yr); 795 active listings in the ZIP; 4 comparable units currently listed for rent nearby; rentals at typical pace (median 16d on market — plan ~3-4 weeks tenant-placement turnaround); solid renter incomes; 2,818 units permitted in Tulsa County in 2024 (518 in 5+ unit buildings).
Forward outlook
- Local home prices are declining (-3.0%/yr); year-one equity from $2k of loan paydown is wiped out by about $8k of value loss. Plan a longer hold.
- Tulsa County population projected at +30% by 2050 — long-run rental-demand tailwind backs the buy-and-hold thesis.
Negotiation context
- Only 7 days on market — expect competitive offers; lowballing is unlikely to land.
- 5 sale attempts since 35y ago with the ask held roughly flat each time — persistent listings suggest the price (not the market) is what's stuck; bring a comps-based counter.
- Current owner paid $110k; list at $260k implies a 135% gain — meaningful room to come down on a strong offer.
Risks & watch-outs
- Climate carrying-cost: extreme-heat days projected 7→18/yr by 2055 (HVAC capex compounding) — expect insurance premiums to compound above CPI over the hold.
Questions for the listing agent
- What do current leases actually rent for vs. the listed asking? Can we see a recent rent roll and the last 12 months of T-12 income?
- Is there a deadline driving the sale (1031 exchange, divorce, estate, relocation)? That informs how much negotiation room exists.
- Schools are B-rated — typically a magnet for longer-tenancy family renters. What's the average tenant stay here, and is there a school-zone premium baked into asking?
- The area grade is low — what's the realistic commute time and amenity access for the typical tenant pool here? Any planned neighborhood developments (good or bad) we should know about?
- What's the average days-on-market for RENTAL listings here right now (not sales)? A rising rental-DOM trend means longer vacancies and softer asking-rent achievability than the comps imply.
- What's the recent tenant-quality profile in this submarket — average credit score on applications, eviction rate, late-payment / NSF rate, and stable-employment percentage? A property-management company in the area should have these aggregated.
- How much new for-sale + rental construction is in the pipeline within 1–3 miles? Heavy new supply typically softens prices + rents 12–24 months out; constrained supply supports both.
Investment metrics
- 1% rule
- 0.82% ✗
- Cap rate
- 6.23%
- Cash-on-cash
- -0.24%
- DSCR
- 0.99
- GRM
- 10.2
CMA / ARV
- ARV (on-the-fly)
- $262,269
- Comps found
- 12
Show comp detail 12 sales within ~0.75 mi
| Address | Dist | Beds/Ba | Sqft | Sold | Price | $/sf | Match |
|---|---|---|---|---|---|---|---|
| 10002 E 117th Pl S | 0.00mi | 3/2.0 | 1,629 (0%) | 0mo | $263,000 | $161 | 100 |
| 11725 S 101st EastAvenue | 0.07mi | 4/2.0 (+1) | 1,703 (+4%) | 4mo | $270,000 | $159 | 81 |
| 11721 S 104th EastAvenue | 0.26mi | 3/2.0 | 1,528 (-6%) | 3mo | $269,000 | $176 | 75 |
| 10726 E 115th Pl S | 0.50mi | 3/2.0 | 1,622 (-0%) | 2mo | $268,000 | $165 | 75 |
| 9931 E 114th St S | 0.42mi | 3/2.0 | 1,694 (+4%) | 1mo | $247,500 | $146 | 73 |
| 10309 E 115th Pl | 0.34mi | 3/2.0 | 1,532 (-6%) | 2mo | $250,000 | $163 | 72 |
| 10221 E 114th Pl S | 0.40mi | 3/2.0 | 1,757 (+8%) | 0mo | $303,500 | $173 | 68 |
| 10218 E 114th Pl S | 0.37mi | 3/2.0 | 1,769 (+9%) | 1mo | $305,000 | $172 | 68 |
| 11301 S 107th EastAvenue | 0.65mi | 3/2.0 | 1,630 (+0%) | 5mo | $250,500 | $154 | 65 |
| 10311 E 116th St | 0.31mi | 3/2.0 | 1,836 (+13%) | 4mo | $282,000 | $154 | 61 |
| 11511 S 108th EastPlace | 0.60mi | 3/2.0 | 1,800 (+10%) | 2mo | $269,000 | $149 | 53 |
| 11310 S 106th EastAvenue | 0.56mi | 3/2.0 | 1,398 (-14%) | 4mo | $220,000 | $157 | 47 |
Match score weights: distance 35% · size 25% · config 20% · recency 20%. Top-matched comps best support the ARV.
Projected returns pro-forma
-3.0% appreciation · 3.34% rent growth · sell at horizon
- IRR
- -16.4%
- Equity multiple
- 0.42×
- Total profit
- $-42,338
- Equity at exit
- $38,752
- IRR
- -7.5%
- Equity multiple
- 0.52×
- Total profit
- $-35,154
- Equity at exit
- $22,471
Cash invested: $72,772 (down + closing). Projections, not guarantees.
Landlord ↔ Tenant lean methodology
- Overall (STATE)
- 83 Strongly Landlord-Friendly
- State Oklahoma
- 83 Strongly Landlord-Friendly · R+20
- County
- — inherits STATE
- City
- — inherits STATE
ZIP-level market 74008
- Rents YoY
- 3.3%
- Active inventory
- 795
- Price-to-rent
- 10.2×
Monthly cashflow live
- Estimated rent
- $2,131 medium interval (Pro) →
- Mortgage (P&I)
- −$1,363
- Tax from tax record
- −$226 /mo · $2,718/yr
- Insurance
- −$108
- HOA
- −$0
- Vacancy / Maint / Mgmt
- −$447
- Net cashflow
- $-15
Break-even live
Sensitivity live
| Price | -10% $133 | -5% $59 | +0% $-15 | +5% $-88 | +10% $-162 |
|---|---|---|---|---|---|
| Rent | -10% $-183 | -5% $-99 | +0% $-15 | +5% $70 | +10% $154 |
| Rate | -1.0pp $116 | -0.5pp $52 | base $-15 | +0.5pp $-82 | +1.0pp $-150 |
UW: 25.0% down · 7.5% · 30yr · 1.5% tax · 5.0% vac · 8.0% maint · 8.0% mgmt
Financing live
Cash to close
- Down payment
- $64,975
- Closing costs
- $7,797
- Reserves months
- —
- Total cash needed
- —
Loan-product check · same deal, 3 products live
Conventional
25% down · 7.5% · 30yr
- Down + closing
- —
- Monthly P&I
- —
- Monthly cashflow
- —
- DSCR
- —
- Eligible?
- —
Personal DTI + credit; lowest rate.
DSCR
20% down · 8.5% · 30yr
- Down + closing
- —
- Monthly P&I
- —
- Monthly cashflow
- —
- DSCR
- —
- Eligible?
- —
No personal income docs; deal must DSCR.
Hard money
10% down · 12.0% · 12mo
- Down + closing
- —
- Monthly P&I
- —
- Monthly cashflow
- —
- DSCR
- —
- Eligible?
- —
Short-term bridge; refi at stabilization.
Rent comps 4 comps
| Address | Beds | Baths | Sqft | Rent | $/sqft | DOM | Units | Dist |
|---|---|---|---|---|---|---|---|---|
| 11612 S 100th East Ave Bixby, OK | 3.0 | 2.0 | 1950 | $2,095 | $1.07 | 25d | 1 | 0.10mi |
| 11222 S 107th East Ave Bixby, OK | 3.0 | 2.5 | 1443 | $1,995 | $1.38 | 16d | 1 | 0.67mi |
| 8336 E 120th Pl S Bixby, OK | 3.0 | 2.0 | 1301 | $1,464 | $1.13 | 12d | 2 | 1.02mi |
| 8554 E 127th St S Bixby, OK | 4.0 | 2.0 | 1515 | $1,795 | $1.18 | 4d | 1 | 1.26mi |
Listing history 15 events
-
2026-05-14status Pending
-
2026-05-07$259,900 Active
-
2018-07-25soldstatus $110,397 Closed 217-char remark
Show marketing remark (217 chars)
PARTIAL BRICK EXTERIOR, FENCE, FIREPLACE, Offered as is with all faults, buyer responsible for costs/replacement of missing meters, SOLD AS IS, CASE NUMBER 405-928151 EXCLUSIVE AGENCY, ELIGIBLE FOR 100.00 DOWN PROGRAM
-
2018-06-20status Pending 217-char remark
Show marketing remark (217 chars)
PARTIAL BRICK EXTERIOR, FENCE, FIREPLACE, Offered as is with all faults, buyer responsible for costs/replacement of missing meters, SOLD AS IS, CASE NUMBER 405-928151 EXCLUSIVE AGENCY, ELIGIBLE FOR 100.00 DOWN PROGRAM
-
2018-06-10$116,000 Active 217-char remark
Show marketing remark (217 chars)
PARTIAL BRICK EXTERIOR, FENCE, FIREPLACE, Offered as is with all faults, buyer responsible for costs/replacement of missing meters, SOLD AS IS, CASE NUMBER 405-928151 EXCLUSIVE AGENCY, ELIGIBLE FOR 100.00 DOWN PROGRAM
-
2010-12-03soldstatus $136,000
-
2004-08-31soldstatus $106,500
-
2004-08-26soldstatus $106,500 122-char remark
Show marketing remark (122 chars)
Dishwasher and oven newer, carpet new in 2002. Landscaped and treed yard. Quiet street, gas logs, lg master w/ 2 walk ins.
-
2004-07-26historical 122-char remark
Show marketing remark (122 chars)
Dishwasher and oven newer, carpet new in 2002. Landscaped and treed yard. Quiet street, gas logs, lg master w/ 2 walk ins.
-
2004-07-07$109,900 122-char remark
Show marketing remark (122 chars)
Dishwasher and oven newer, carpet new in 2002. Landscaped and treed yard. Quiet street, gas logs, lg master w/ 2 walk ins.
-
1994-08-03soldstatus $75,500
-
1994-06-14$77,500
-
1991-06-10soldstatus $65,500
-
1991-03-06$72,900
-
1988-01-01soldstatus $72,000
ⓘ Source: listings_history table (triggers on properties + properties_extension) + one-shot
backfill from property_details.listing_events for pre-trigger history.
Tax reassessment forecast OK · Resets to sale price
- Current annual tax
- $2,718 · $226/mo
- Projected year-2 tax
- $2,718 · $226/mo
- Expected delta
- $0/yr ($0/mo · 0.0%)
ⓘ Screening estimate from a state-policy table — verify with the county assessor before closing.
Climate risk First Street
- Flood 1/10 Low FEMA zone X (unshaded) · 0% chance over 30 yrs
- Wildfire 4/10 Moderate
- Heat 7/10 Severe 7 d/yr ≥111°F today · 18 d/yr by 30 yrs out
- Wind 3/10 Moderate 4% chance of damaging wind over 30 yrs
- Air quality 2/10 Low 1 unhealthy d/yr today · 1 by 30 yrs out
Nearby sold comps map
Loading sold comps map…
Walkable amenities ~0.75 mi
Loading nearby amenities…
Taxation est. · year 1
- Rental income
- $25,567
- − Mortgage interest
- −$14,558
- − Property taxes
- −$2,718
- − Insurance
- −$1,300
- − Repairs & maintenance
- −$2,045
- − Management
- −$2,045
- − Depreciation
- −$7,561
- Taxable loss
- −$4,660
- Est. tax savings @ 24.0%
- +$1,118
- After-tax cash flow
- $944/yr
For passive investors: Depreciation is non-cash, so a rental often shows a tax loss while cash-flowing — sheltering income. Rental losses are passive: they offset passive income freely, and up to $25,000/yr can offset ordinary (W-2) income if you actively participate and your MAGI is under $100k (phasing out to $0 by $150k); unused losses carry forward. On sale, claimed depreciation is recaptured at up to 25%, and gains may owe capital-gains tax (a 1031 exchange can defer both). Figures are a year-1 estimate at your 24.0% rate — not tax advice; consult a CPA.
Schools (NCES district)
- District
- Bixby
- NCES district ID
- 4004500
- Math proficiency
- 39% ▼ -13.00%
- Reading proficiency
- 36% ▼ -14.00%
- Median HH income
- $75,727
- Composite
- 34.9/100
- National rank
- #5081
- State rank
- #15 of 270 in OK
Livability — Bixby
- Score
- 72/100
- State rank
- #24
- US rank
- #6029
Category grades
Schools grade is shown separately in the Schools card above.
Census & demographics
- Census place
- Bixby, OK
- County
- Tulsa County · 640,811 people
- City population
- 34,006
- Metro
- Tulsa, OK
- Population (ZIP)
- 34,006
- Household income
- $104,000
- Rent vs Own
- Severe rent burden
- 525.0
Population outlook (Tulsa County) Hauer SSP2
- Today (2025)
- 723,846 people
- By 2030
- 766,033 · +5.8%
- By 2040
- 851,386 · +17.6%
- By 2050
- 938,389 · +29.6%
- By 2075
- 1,166,011 · +61.1%
- By 2100
- 1,350,277 · +86.5%
Race, ethnicity, and origin ACS 2023
- Neighborhood character
- Predominantly White (73%)
- Race & ethnicity
- White 73% Two or more races 15% Hispanic / Latino 9% Native American 5% Asian 2% Black 2%
- Hispanic origin (detail)
- Mexican 5%
- Common ancestry
- Italian 4% Slovak 2% Lithuanian 2%
- Foreign-born
- 5% · Canada
- Languages at home
- 92% English-only · Spanish 5% Other Indo-European 1%
Political lean MEDSL · Tulsa
- 2024 margin
- R (+15.2) · D 41.3% · R 56.5% · Other 2.2%
- 2008→2024 swing
- +9.2pp toward D · 2008: -24.5pp · 2024: -15.2pp
- All cycles
- 2024: R+15.2 2020: R+15.6 2016: R+22.9 2012: R+27.4 2008: R+24.5
Not yet ingested
- Civics
- —
Market trends
- HPI YoY
- ▼ -127.20%
- Current HPI
- 195.2538
- Rent YoY
- ▲ 3.34%
- Metro
- Tulsa, OK
- State GDP YoY
- ▲ 1.55%
- F500 in state
- 6
Industry mix (Fortune 500 HQ in OK)
| Industry | F500 HQs | Revenue |
|---|---|---|
| Energy | 3 | $48B |
|
||
Price history
+261.0% since first listed15 events — show timeline
- 2026-05-14 Pending — MLS Technology, Inc.
- 2026-05-07 Listed $259,900 MLS Technology, Inc.
- 2018-07-25 Sold (MLS) $110,397 MLS Technology, Inc.
- 2018-06-20 Pending — MLS Technology, Inc.
- 2018-06-10 Listed $116,000 MLS Technology, Inc.
- 2010-12-03 Sold (Public Records) $136,000 Public Records
- 2004-08-31 Sold (Public Records) $106,500 Public Records
- 2004-08-26 Sold (MLS) $106,500 MLS Technology, Inc.
- 2004-07-26 Listing Removed — MLS Technology, Inc.
- 2004-07-07 Listed $109,900 MLS Technology, Inc.
- 1994-08-03 Sold (Public Records) $75,500 Public Records
- 1994-06-14 Listed $77,500 MLS Technology, Inc.
- 1991-06-10 Sold (Public Records) $65,500 Public Records
- 1991-03-06 Listed $72,900 MLS Technology, Inc.
- 1988-01-01 Sold (Public Records) $72,000 Public Records
Property tax history
+4.2%/yrLatest (2025): $2,718 · +6.9% YoY. Source: county tax records.
Cash-flow waterfall
monthlySold comps — $/sqft
last 12 mo · ≤1 miLoading sold comps…