 7-Plex
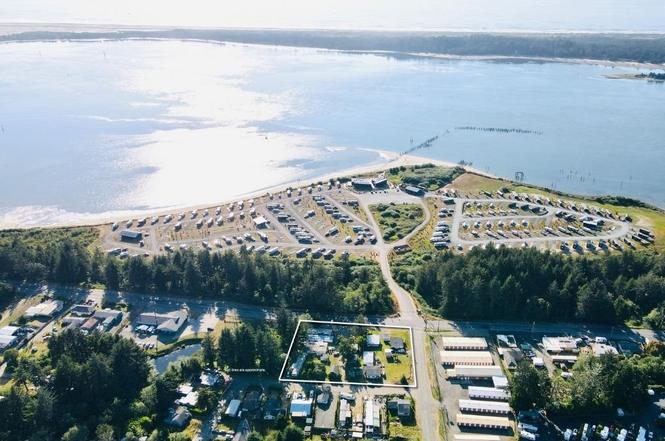
92392 Cape Arago Hwy · Coos Bay, OR
Flood risk 1/10 · Minimal
- FEMA flood zone
- X (unshaded)
- Chance of flooding over 30 yrs
- 0.0%
- Est. flood insurance / yr
- $507 – $1,088
Fire risk 1/10 · Minimal
- Est. fire insurance / yr
- $498 – $926
Heat risk 1/10 · Minimal
- Hot days now (above 74°F)
- 7 days/yr
- Hot days in 30 yrs
- 22 days/yr
Wind risk 1/10 · Minimal
- Chance of severe wind over 30 yrs
- —
Air-quality risk 6/10 · Moderate
- Unhealthy air days now
- 9 days/yr
- Unhealthy air days in 30 yrs
- 9 days/yr
Risk factors via First Street. Map © Google.
Why this score? — see what drove the B grade
The composite is a weighted blend of 9 inputs, each scored 0–100. Each bar is that input's sub-score; the figure is the points it added to the 100-point composite (weight × sub-score).
- Cash flow +30.0/30.0
- 1% rule +10.0/10.0
- DSCR +10.0/10.0
- ARV discount +7.5/15.0
- Rent growth +4.7/5.0
- Livability +3.1/5.0
- Schools +2.5/10.0
- Condition / age +2.5/5.0
- Appreciation +0.0/10.0
$599,000
🖨 Deal sheet (PDF) 📄 Offer letter ✓ Due diligence
Multi-family units
County records classify this as Multi-Family (5+ Unit). Listing-text estimate: 7 units. confirmed
5+ unit building — per-unit beds/baths from public records are typically unavailable; the breakdown below (if shown) is an estimate from the listing text.
Listing remarks
Own an entire block in Coos Bay’s Opportunity Zone—an exceptional investment or redevelopment opportunity! This ±1.3-acre property includes 3 homes, 5 cottages, 5 mobile units, and multiple outbuildings, all within flexible CD-5 mixed-use zoning that supports residential or commercial development. Formerly a 28-space RV park, the site features public water and sewer, ample parking, and scenic bay and dune views. With strong income and redevelopment potential, this property offers a rare chance to shape a key corner of Coos Bay’s growth corridor. Seller financing available (10–15 yrs w/ 25% down). Sold as-is, subject to tenant rights.
Key facts
- 3 homes
- 5 cottages
- 5 mobile units
Tags
Neighborhood map
What this means for you Summary
Snapshot
- This is a 7 × 3-bed/1.7-bath units multifamily listed at $599k.
Deal economics
- At list price, monthly cash flow is $7k ($80k/yr) — positive. Per door: $952/mo.
- The deal already cash-flows at list — no discount required.
- Meets the 1% rule at list price ($14k rent vs $599k).
- Recommended offer: $590k (1.5% below list) — sets the bar for market timing.
- Cap rate 19.6% vs local median 4.2% in Coos Bay — top-decile yield for the area; either an underpriced asset or a hidden risk that comps aren't pricing in. Stress-test before assuming the spread holds.
Location & tenants
- Location reads 61/100 on livability (#257 in OR) — a middle-class / working-renter tenant base. Strengths: housing A+, health & safety A+, cost of living A; Watch: crime F, amenities F, commute F.
- Coos Bay SD 9 (town): math 22% / reading 39% proficiency, ranked #45 of 58 in OR (top 78%) — families likely to look elsewhere, expect single-tenant / working-renter base with shorter leases.
- Zoned schools: Madison Elementary School (295 students, 69% FRL); Marshfield Senior High School (math 17% / reading 54%, grade F, #89 of 143 statewide, top 62%, 835 students, 31% FRL) — zoned schools at 50% FRL track the district average.
- Market conditions: Rents rising fast (+8.7%/yr); 342 active listings in the ZIP; 122 units permitted in Coos County in 2024 (16 in 5+ unit buildings).
- At $13,676/mo this rent would consume 267% of the median local household income ($62k/yr) (locally 799% of renters already pay >50% of income on rent) — very limited rent-growth headroom before tenants either downsize or default.
Forward outlook
- Local home prices are declining (-3.0%/yr); year-one equity from $4k of loan paydown is wiped out by about $18k of value loss. Plan a longer hold.
- Coos County population projected to shrink 9% by 2050 — rents likely to lag national; underwrite the cash flow, not the appreciation.
- At projected returns (-3.0% appreciation + 8.0% rent growth), your $168k cash investment doubles in ~3 years — after that, you're playing with house money.
Negotiation context
- It's been on market 27 days — a 2% lower offer ($590k) is reasonable based on typical stale-listing flexibility.
Questions for the listing agent
- Can we see the unit-by-unit rent roll, current vacancy, and any below-market leases? What's the average tenancy length?
- What capital expenditures (roof, boiler, parking lot, exteriors) have been made in the last 5 years, and what's planned in the next 2?
- Built in 1975 — when were the roof, HVAC, electrical panel, plumbing, and water heater last replaced?
- Is there a deadline driving the sale (1031 exchange, divorce, estate, relocation)? That informs how much negotiation room exists.
- Schools are D-rated, which usually means shorter tenancies and higher turnover. Who's the typical renter profile here, and what's been the actual vacancy rate?
- Crime grade is F in this area — have there been break-ins, vandalism, or insurance claims at this property in the last 3 years? What carrier currently insures it and at what premium?
- What's the average days-on-market for RENTAL listings here right now (not sales)? A rising rental-DOM trend means longer vacancies and softer asking-rent achievability than the comps imply.
- What's the recent tenant-quality profile in this submarket — average credit score on applications, eviction rate, late-payment / NSF rate, and stable-employment percentage? A property-management company in the area should have these aggregated.
- How much new apartment / multifamily construction is in the pipeline within 1–3 miles? Heavy new supply (>2% of stock underway) typically softens rents 12–24 months out; light construction supports rent growth.
Investment metrics
- 1% rule
- 2.28% ✓
- Cap rate
- 19.64%
- Cash-on-cash
- 47.68%
- DSCR
- 3.12
- GRM
- 3.6
CMA / ARV
No comps found within radius.
Projected returns pro-forma
-3.0% appreciation · 8.0% rent growth · sell at horizon
- IRR
- 50.7%
- Equity multiple
- 3.38×
- Total profit
- $399,882
- Equity at exit
- $89,313
- IRR
- 58.1%
- Equity multiple
- 8.30×
- Total profit
- $1,224,565
- Equity at exit
- $51,791
Cash invested: $167,720 (down + closing). Projections, not guarantees.
Landlord ↔ Tenant lean methodology
- Overall (STATE)
- 28 Tenant-Leaning
- State Oregon
- 28 Tenant-Leaning · D+6
- County
- — inherits STATE
- City
- — inherits STATE
ZIP-level market 97420
- Rents YoY
- 8.7%
- Active inventory
- 342
- Price-to-rent
- 25.5×
Monthly cashflow live
- Estimated rent
- $13,676 medium interval (Pro) →
- Mortgage (P&I)
- −$3,141
- Tax est. 1.5%
- −$749 /mo · $8,985/yr
- Insurance
- −$250
- HOA
- −$0
- Vacancy / Maint / Mgmt
- −$2,872
- Net cashflow
- $6,664
Break-even live
Sensitivity live
| Price | -10% $7,078 | -5% $6,871 | +0% $6,664 | +5% $6,458 | +10% $6,251 |
|---|---|---|---|---|---|
| Rent | -10% $5,584 | -5% $6,124 | +0% $6,664 | +5% $7,205 | +10% $7,745 |
| Rate | -1.0pp $6,966 | -0.5pp $6,817 | base $6,664 | +0.5pp $6,509 | +1.0pp $6,351 |
7-unit breakdown (identical units grouped — click to expand)
| Units | Beds | Baths | Est. rent |
|---|---|---|---|
| 7× units | 3 | 1.7 | $13,678 |
| #1 | 3 | 1.7 | $1,954 |
| #2 | 3 | 1.7 | $1,954 |
| #3 | 3 | 1.7 | $1,954 |
| #4 | 3 | 1.7 | $1,954 |
| #5 | 3 | 1.7 | $1,954 |
| #6 | 3 | 1.7 | $1,954 |
| #7 | 3 | 1.7 | $1,954 |
| Total (7 units) | $13,676 | ||
UW: 25.0% down · 7.5% · 30yr · 1.5% tax · 5.0% vac · 8.0% maint · 8.0% mgmt
Financing live
Cash to close
- Down payment
- $149,750
- Closing costs
- $17,970
- Reserves months
- —
- Total cash needed
- —
Loan-product check · same deal, 3 products live
Conventional
25% down · 7.5% · 30yr
- Down + closing
- —
- Monthly P&I
- —
- Monthly cashflow
- —
- DSCR
- —
- Eligible?
- —
Personal DTI + credit; lowest rate.
DSCR
20% down · 8.5% · 30yr
- Down + closing
- —
- Monthly P&I
- —
- Monthly cashflow
- —
- DSCR
- —
- Eligible?
- —
No personal income docs; deal must DSCR.
Hard money
10% down · 12.0% · 12mo
- Down + closing
- —
- Monthly P&I
- —
- Monthly cashflow
- —
- DSCR
- —
- Eligible?
- —
Short-term bridge; refi at stabilization.
Listing history 2 events
-
2025-12-11status Pending
-
2025-11-13$599,000 Active
ⓘ Source: listings_history table (triggers on properties + properties_extension) + one-shot
backfill from property_details.listing_events for pre-trigger history.
Climate risk First Street
- Flood 1/10 Low FEMA zone X (unshaded) · 0% chance over 30 yrs
- Wildfire 1/10 Low
- Heat 1/10 Low 7 d/yr ≥74°F today · 22 d/yr by 30 yrs out
- Wind 1/10 Low
- Air quality 6/10 Major 9 unhealthy d/yr today · 9 by 30 yrs out
Nearby sold comps map
Loading sold comps map…
Walkable amenities ~0.75 mi
Loading nearby amenities…
Taxation est. · year 1
- Rental income
- $164,112
- − Mortgage interest
- −$33,553
- − Property taxes
- −$8,985
- − Insurance
- −$2,995
- − Repairs & maintenance
- −$13,129
- − Management
- −$13,129
- − Depreciation
- −$17,425
- Taxable income
- $74,895
- Est. tax owed @ 24.0%
- −$17,975
- After-tax cash flow
- $61,999/yr
For passive investors: Depreciation is non-cash, so a rental often shows a tax loss while cash-flowing — sheltering income. Rental losses are passive: they offset passive income freely, and up to $25,000/yr can offset ordinary (W-2) income if you actively participate and your MAGI is under $100k (phasing out to $0 by $150k); unused losses carry forward. On sale, claimed depreciation is recaptured at up to 25%, and gains may owe capital-gains tax (a 1031 exchange can defer both). Figures are a year-1 estimate at your 24.0% rate — not tax advice; consult a CPA.
Schools (NCES district)
- District
- Coos Bay SD 9
- NCES district ID
- 4103660
- Math proficiency
- 22% ▼ -6.00%
- Reading proficiency
- 39% ▼ -4.00%
- Median HH income
- $38,630
- Composite
- 25.46/100
- National rank
- #7450
- State rank
- #45 of 58 in OR
Livability — Coos Bay
- Score
- 61/100
- State rank
- #257
- US rank
- #17474
Category grades
Schools grade is shown separately in the Schools card above.
Census & demographics
- County
- Coos County · 27,621 people
- City population
- 27,621
- Metro
- Coos Bay, OR
- Population (ZIP)
- 27,621
- Household income
- $61,574
- Rent vs Own
- Severe rent burden
- 799.0
Population outlook (Coos County) Hauer SSP2
- Today (2025)
- 62,222 people
- By 2030
- 61,120 · -1.8%
- By 2040
- 58,478 · -6.0%
- By 2050
- 56,819 · -8.7%
- By 2075
- 54,915 · -11.7%
- By 2100
- 51,403 · -17.4%
Race, ethnicity, and origin ACS 2023
- Neighborhood character
- Predominantly White (81%)
- Race & ethnicity
- White 81% Hispanic / Latino 10% Two or more races 8% Native American 2% Asian 1%
- Hispanic origin (detail)
- Mexican 7%
- Common ancestry
- Italian 5% Slovak 3% Lithuanian 3%
- Foreign-born
- 5% · Canada, Vietnam
- Languages at home
- 92% English-only · Spanish 6%
Political lean MEDSL · Coos
- 2024 margin
- R (+19.9) · D 38.7% · R 58.5% · Other 2.8%
- 2008→2024 swing
- -16.8pp toward R · 2008: -3.1pp · 2024: -19.9pp
- All cycles
- 2024: R+19.9 2020: R+20.5 2016: R+24.3 2012: R+6.3 2008: R+3.1
Not yet ingested
- Civics
- —
Market trends
- HPI YoY
- ▼ -315.58%
- Current HPI
- 198.3249
- Rent YoY
- ▲ 8.65%
- Metro
- Coos Bay, OR
- State GDP YoY
- ▲ 2.05%
- F500 in state
- 2
Industry mix (Fortune 500 HQ in OR)
| Industry | F500 HQs | Revenue |
|---|---|---|
| Consumer Goods | 1 | $51B |
|
||
Price history
2 events — show timeline
- 2025-12-11 Pending — RMLS
- 2025-11-13 Listed $599,000 RMLS
Cash-flow waterfall
monthlySold comps — $/sqft
last 12 mo · ≤1 miLoading sold comps…