 Duplex
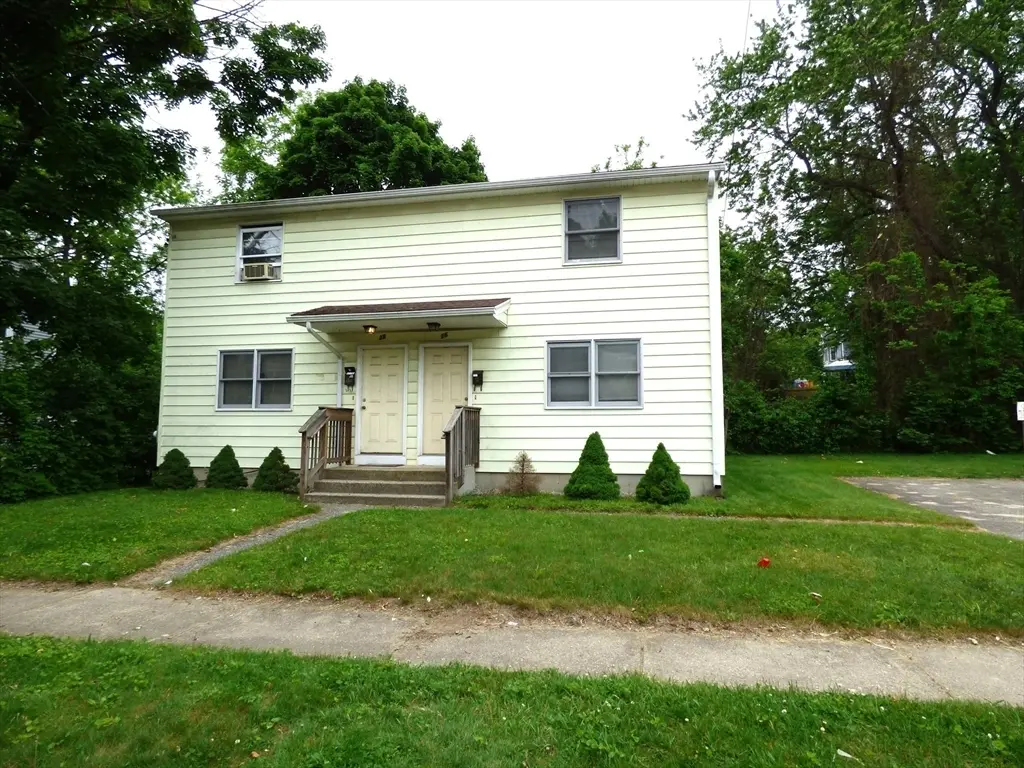
26-28 Daniel St · Springfield, MA
Flood risk No data
- FEMA flood zone
- —
- Chance of flooding over 30 yrs
- —
- Est. flood insurance / yr
- —
Fire risk No data
- Est. fire insurance / yr
- —
Heat risk No data
- Hot days now (above threshold)
- —
- Hot days in 30 yrs
- —
Wind risk No data
- Chance of severe wind over 30 yrs
- —
Air-quality risk No data
- Unhealthy air days now
- —
- Unhealthy air days in 30 yrs
- —
Risk factors via First Street. Map © Google.
Why this score? — see what drove the D+ grade
The composite is a weighted blend of 9 inputs, each scored 0–100. Each bar is that input's sub-score; the figure is the points it added to the 100-point composite (weight × sub-score).
- Cash flow +20.6/30.0
- DSCR +6.5/10.0
- 1% rule +5.4/10.0
- ARV discount +4.7/15.0
- Livability +3.7/5.0
- Rent growth +2.5/5.0
- Condition / age +2.5/5.0
- Schools +1.6/10.0
- Appreciation +0.0/10.0
$359,900
🖨 Deal sheet 📄 Offer letter ✓ Due diligence
Multi-family units
County records classify this as Multi-Family (2-4 Unit). Listing-text estimate: 2 units. confirmed
Listing remarks
Rare opportunity to own one or two side by side duplexes. 16-18 Daniel Street and 26-28 Daniel Street are listed separately with off street paved parking area between duplexes. Each duplex has one unit vacant and ready to occupy. All Units have a refrigerator, stove, and hookups for washer and dryer in separated basements. Each unit has spacious kitchen with eat in area, large bright living room, two large bedrooms upstairs with full bathroom. 16-18 Daniel has a larger back yard with lots of potential. Long term tenant on left side of each Duplex to remain with sale.
Key facts
- Separated basements
- Spacious kitchen
- Larger back yard
Tags
Property features AI
Finance
- HOA & community: Access to public transportation, shopping, and parks; Not a senior community
Exterior
- Parking: Open parking for 4 vehicles
- Utilities: Public water; Public sewer; Electric service with circuit breakers; Electric range hookup; Electric dryer hookup; Washer hookup
- Home design: 2-family side-by-side property; 6 total stories; Entry levels vary by unit
- Construction: Frame construction; Concrete perimeter foundation; Built (year per public records)
- Exterior features: Paved drive; Off-street open parking; Public road frontage; Shingle roof; Yellow exterior
Interior
- Kitchen: Range; Refrigerator
- Flooring: Vinyl flooring; Carpet
- Bathrooms: 2 full bathrooms
- Heating & cooling: Electric heating
- Interior features: Living room; Kitchen; Laundry room; Bathroom with tub & shower; Total of 8 rooms
- Laundry & utility: Washer hookup; Electric dryer hookup
Neighborhood map
What this means for you Summary
Snapshot
- This is a 2 × 2-bed/1.0-bath units multifamily listed at $360k. Condition is rated fair.
Deal economics
- At list price, monthly cash flow is $480 ($6k/yr) — positive. Per door: $240/mo.
- The deal already cash-flows at list — no discount required.
- Meets the 1% rule at list price ($4k rent vs $360k).
- Recommended offer: $355k (1.5% below list) — sets the bar for market timing.
- Cap rate 7.9% vs local median 5.1% in Springfield — top-decile yield for the area; either an underpriced asset or a hidden risk that comps aren't pricing in. Stress-test before assuming the spread holds.
Location & tenants
- Location reads 73/100 on livability (#97 in MA) — a middle-class / working-renter tenant base. Strengths: commute A+, health & safety A+, amenities A; Watch: schools D, crime F, employment D-.
- Springfield (urban): math 13% / reading 25% proficiency, ranked #296 of 302 in MA (top 98%) — low school quality limits family demand, transient renter base, plan for 1-2y turnover; 81% free/reduced lunch — lower-income household profile, screen leases tightly.
- Market conditions: 13 active listings in the ZIP; 5 comparable units currently listed for rent nearby; rentals at typical pace (median 21d on market — plan ~3-4 weeks tenant-placement turnaround); 40% of comp listings sitting > 30 days — soft ceiling on asking rent; 453 units permitted in Hampden County in 2024 (116 in 5+ unit buildings).
Forward outlook
- Local home prices are declining (-3.0%/yr); year-one equity from $2k of loan paydown is wiped out by about $11k of value loss. Plan a longer hold.
- Hampden County population projected at +5% by 2050 — modest demand growth; plan on rents tracking national, not racing it.
Negotiation context
- It's been on market 21 days — a 2% lower offer ($355k) is reasonable based on typical stale-listing flexibility.
Questions for the listing agent
- Can we see the unit-by-unit rent roll, current vacancy, and any below-market leases? What's the average tenancy length?
- What capital expenditures (roof, boiler, parking lot, exteriors) have been made in the last 5 years, and what's planned in the next 2?
- Have any recent inspections been done? Can we get a copy of the seller's disclosures and any deferred-maintenance estimates?
- Is there a deadline driving the sale (1031 exchange, divorce, estate, relocation)? That informs how much negotiation room exists.
- Schools are D-rated, which usually means shorter tenancies and higher turnover. Who's the typical renter profile here, and what's been the actual vacancy rate?
- Crime grade is F in this area — have there been break-ins, vandalism, or insurance claims at this property in the last 3 years? What carrier currently insures it and at what premium?
- The area grade is low — what's the realistic commute time and amenity access for the typical tenant pool here? Any planned neighborhood developments (good or bad) we should know about?
- What's the average days-on-market for RENTAL listings here right now (not sales)? A rising rental-DOM trend means longer vacancies and softer asking-rent achievability than the comps imply.
- What's the recent tenant-quality profile in this submarket — average credit score on applications, eviction rate, late-payment / NSF rate, and stable-employment percentage? A property-management company in the area should have these aggregated.
- How much new apartment / multifamily construction is in the pipeline within 1–3 miles? Heavy new supply (>2% of stock underway) typically softens rents 12–24 months out; light construction supports rent growth.
Investment metrics
- 1% rule
- 1.04% ✓
- Cap rate
- 7.89%
- Cash-on-cash
- 5.72%
- DSCR
- 1.25
- GRM
- 8.0
CMA / ARV
- ARV (on-the-fly)
- $338,688
- Comps found
- 6
Show comp detail 6 sales within ~0.75 mi
| Address | Dist | Beds/Ba | Sqft | Sold | Price | $/sf | Match |
|---|---|---|---|---|---|---|---|
| 13-15 Decatur St | 0.24mi | 4/2.0 | 1,824 (+6%) | 4mo | $340,000 | $186 | 76 |
| 36-38 Montcalm St | 0.41mi | 4/2.0 | 1,680 (-3%) | 7mo | $350,000 | $208 | 71 |
| 57-59 Martha St | 0.09mi | 4/2.0 | 1,976 (+14%) | 4mo | $299,000 | $151 | 68 |
| 1275 Worcester St | 0.34mi | 5/2.0 (+1) | 1,865 (+8%) | 8mo | $365,000 | $196 | 59 |
| 57-59 Dubois St | 0.51mi | 4/2.0 | 1,632 (-6%) | 17mo | $288,000 | $176 | 53 |
| 140 Cardinal St | 0.65mi | 4/3.0 | 1,872 (+8%) | 3mo | $420,000 | $224 | 50 |
Match score weights: distance 35% · size 25% · config 20% · recency 20%. Top-matched comps best support the ARV.
Projected returns pro-forma
-3.0% appreciation · 3.0% rent growth · sell at horizon
- IRR
- -7.4%
- Equity multiple
- 0.73×
- Total profit
- $-27,688
- Equity at exit
- $53,662
- IRR
- 2.2%
- Equity multiple
- 1.15×
- Total profit
- $15,490
- Equity at exit
- $31,118
Cash invested: $100,772 (down + closing). Projections, not guarantees.
Landlord ↔ Tenant lean methodology
- Overall (STATE)
- 20 Strongly Tenant-Friendly
- State Massachusetts
- 20 Strongly Tenant-Friendly · D+15
- County
- — inherits STATE
- City
- — inherits STATE
ZIP-level market 01151
- Home prices YoY
- -11.1%
- Active inventory
- 13
- Price-to-rent
- 16.0×
Monthly cashflow live
- Estimated rent
- $3,756 high interval (Pro) →
- Mortgage (P&I)
- −$1,887
- Tax est. 1.5%
- −$450 /mo · $5,398/yr
- Insurance
- −$150
- HOA
- −$0
- Vacancy / Maint / Mgmt
- −$789
- Net cashflow
- $480
Break-even live
2-unit breakdown (identical units grouped — click to expand)
| Units | Beds | Baths | Est. rent |
|---|---|---|---|
| 2× units | 2 | 1 | $3,756 |
| #1 | 2 | 1 | $1,878 |
| #2 | 2 | 1 | $1,878 |
| Total (2 units) | $3,756 | ||
UW: 25.0% down · 7.5% · 30yr · 1.5% tax · 5.0% vac · 8.0% maint · 8.0% mgmt
Financing live
Cash to close
- Down payment
- $89,975
- Closing costs
- $10,797
- Reserves months
- —
- Total cash needed
- —
Loan-product check · same deal, 3 products live
Conventional
25% down · 7.5% · 30yr
- Down + closing
- —
- Monthly P&I
- —
- Monthly cashflow
- —
- DSCR
- —
- Eligible?
- —
Personal DTI + credit; lowest rate.
DSCR
20% down · 8.5% · 30yr
- Down + closing
- —
- Monthly P&I
- —
- Monthly cashflow
- —
- DSCR
- —
- Eligible?
- —
No personal income docs; deal must DSCR.
Hard money
10% down · 12.0% · 12mo
- Down + closing
- —
- Monthly P&I
- —
- Monthly cashflow
- —
- DSCR
- —
- Eligible?
- —
Short-term bridge; refi at stabilization.
Rent comps 5 comps
| Address | Beds | Baths | Sqft | Rent | $/sqft | DOM | Units | Dist |
|---|---|---|---|---|---|---|---|---|
| 19-21 Daniel St Unit 19 Springfield, MA | 3.0 | 1.0 | 1050 | $2,000 | $1.90 | 43d | 1 | 0.05mi |
| 35 Healey St Unit 3rd Floor Indian Orchard, MA | 3.0 | 1.0 | 1200 | $2,000 | $1.67 | 13d | 1 | 0.37mi |
| 1142 Boston Rd Unit 1142 Springfield, MA | 3.0 | 1.5 | 2150 | $2,475 | $1.15 | 13d | 1 | 0.95mi |
| 137 Cobb St Springfield, MA | 4.0 | 2.0 | 1500 | $2,500 | $1.67 | 43d | 1 | 1.24mi |
| 33 Cypress St Unit 35 Ludlow, MA | 4.0 | 1.5 | 1250 | $2,150 | $1.72 | 21d | 1 | 1.42mi |
Listing history 17 events
-
2026-06-18days on market $359,900 Active 21 DOM
-
2026-06-17days on market $359,900 Active 20 DOM
-
2026-06-16days on market $359,900 Active 19 DOM
-
2026-06-15days on market $359,900 Active 18 DOM
-
2026-06-14days on market $359,900 Active 16 DOM
-
2026-06-13days on market $359,900 Active 15 DOM
-
2026-06-10days on market $359,900 Active 13 DOM
-
2026-06-09days on market $359,900 Active 12 DOM
-
2026-06-08days on market $359,900 Active 11 DOM
-
2026-06-07days on market $359,900 Active 10 DOM
-
2026-06-05days on market $359,900 Active 7 DOM
-
2026-06-03days on market $359,900 Active 6 DOM
-
2026-06-02days on market $359,900 Active 5 DOM
-
2026-06-01statusdays on market $359,900 Active 4 DOM
-
2026-05-31days on market $359,900 New 3 DOM
-
2026-05-30days on market $359,900 New 2 DOM
-
2026-05-28$359,900 New
ⓘ Source: listings_history table (triggers on properties + properties_extension) + one-shot
backfill from property_details.listing_events for pre-trigger history.
Nearby sold comps map
Loading sold comps map…
Walkable amenities ~0.75 mi
Loading nearby amenities…
Taxation est. · year 1
- Rental income
- $45,072
- − Mortgage interest
- −$20,160
- − Property taxes
- −$5,398
- − Insurance
- −$1,800
- − Repairs & maintenance
- −$3,606
- − Management
- −$3,606
- − Depreciation
- −$10,470
- Taxable income
- $33
- Est. tax owed @ 24.0%
- −$8
- After-tax cash flow
- $5,753/yr
For passive investors: Depreciation is non-cash, so a rental often shows a tax loss while cash-flowing — sheltering income. Rental losses are passive: they offset passive income freely, and up to $25,000/yr can offset ordinary (W-2) income if you actively participate and your MAGI is under $100k (phasing out to $0 by $150k); unused losses carry forward. On sale, claimed depreciation is recaptured at up to 25%, and gains may owe capital-gains tax (a 1031 exchange can defer both). Figures are a year-1 estimate at your 24.0% rate — not tax advice; consult a CPA.
Condition & rehab AI · 13 photos
The property is in fair condition with some minor repairs and maintenance needed. Painting and landscaping can significantly increase its value.
Repairs flagged
- Minor Landscaping — Some areas of the lawn and landscaping could be improved.
Value-add opportunities
- Both Painting the exterior and interior — Painting can improve the curb appeal and interior aesthetics, making the property more attractive to potential buyers and renters.
- Both Landscaping — A well-maintained lawn and landscaping can enhance the property's curb appeal and make it more attractive to potential buyers and renters.
Renovation cost estimate screening
| Repair item | Severity | Est. cost |
|---|---|---|
| Landscaping · Some areas of the lawn and landscaping could be improved. | Minor | $500–3,000 |
| Total estimated repair cost · 1 items | $500–3,000 |
Value-add ROI direction
- Both Painting the exterior and interior — Painting can improve the curb appeal and interior aesthetics, making the property more attractive to potential buyers and renters. ↑
- Both Landscaping — A well-maintained lawn and landscaping can enhance the property's curb appeal and make it more attractive to potential buyers and renters. ↑
ⓘ Cost ranges are severity-bucket heuristics (US national rule-of-thumb). Get contractor quotes + a written scope before underwriting a rehab budget.
Schools (NCES district)
- District
- Springfield
- NCES district ID
- 2511130
- Math proficiency
- 13% ▼ -12.00%
- Reading proficiency
- 25% ▼ -5.00%
- Median HH income
- $34,938
- Composite
- 15.6/100
- National rank
- #9293
- State rank
- #296 of 302 in MA
Livability — Springfield
- Score
- 73/100
- State rank
- #97
- US rank
- #5195
Category grades
Schools grade is shown separately in the Schools card above.
Census & demographics
- Census place
- Springfield, MA
- City population
- 61,006
- Population (ZIP)
- 9,627
Population outlook (Hampden County) Hauer SSP2
- Today (2025)
- 485,646 people
- By 2030
- 491,517 · +1.2%
- By 2040
- 500,539 · +3.1%
- By 2050
- 508,827 · +4.8%
- By 2075
- 539,167 · +11.0%
- By 2100
- 545,698 · +12.4%
Race, ethnicity, and origin ACS 2023
- Neighborhood character
- Diverse neighborhood (Simpson 0.65)
- Race & ethnicity
- Hispanic / Latino 47% White 31% Two or more races 23% Black 17% Asian 1%
- Hispanic origin (detail)
- Mexican 2% Puerto Rican 37% Dominican 3%
- Common ancestry
- Romanian 6% Lithuanian 5% Russian 2%
- Foreign-born
- 12% · Canada
- Languages at home
- 57% English-only · Spanish 38% Other Indo-European 2% Russian/Polish/Slavic 1%
Political lean MEDSL · Hampden
- 2024 margin
- Lean D (+8.9) · D 53.4% · R 44.5% · Other 2.1%
- 2008→2024 swing
- -16.4pp toward R · 2008: 25.3pp · 2024: 8.9pp
- All cycles
- 2024: D+8.9 2020: D+17.7 2016: D+16.0 2012: D+25.4 2008: D+25.3
Not yet ingested
- Civics
- —
Market trends
- HPI YoY
- ▼ -43.91%
- Current HPI
- 353.0147
- Rent YoY
- —
- Metro
- —
- State GDP YoY
- ▲ 2.28%
- F500 in state
- 38
Industry mix (Fortune 500 HQ in MA)
| Industry | F500 HQs | Revenue |
|---|---|---|
| Technology | 3 | $17B |
|
||
| Insurance | 2 | $84B |
|
||
| Retail | 2 | $76B |
|
||
| Life Sciences | 1 | $43B |
|
||
| Energy Technology | 1 | $31B |
|
||
| Aerospace / Defense | 1 | $18B |
|
||
Price history
1 event — show timeline
- 2026-05-28 Listed $359,900 MLS PIN
Cash-flow waterfall
monthlySold comps — $/sqft
last 12 mo · ≤1 miLoading sold comps…