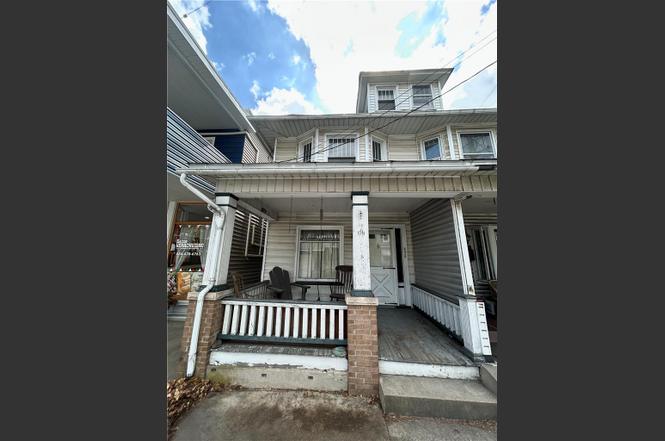
452 S Main St · Bangor, PA
Flood risk 8/10 · Major
- FEMA flood zone
- X (unshaded)
- Chance of flooding over 30 yrs
- 0.99%
- Est. flood insurance / yr
- $473 – $860
Fire risk 1/10 · Minimal
- Est. fire insurance / yr
- $511 – $949
Heat risk 5/10 · Moderate
- Hot days now (above 96°F)
- 7 days/yr
- Hot days in 30 yrs
- 16 days/yr
Wind risk 4/10 · Minor
- Chance of severe wind over 30 yrs
- 13.0%
Air-quality risk 2/10 · Minimal
- Unhealthy air days now
- 1 days/yr
- Unhealthy air days in 30 yrs
- 3 days/yr
Risk factors via First Street. Map © Google.
Why this score? — see what drove the C+ grade
The composite is a weighted blend of 9 inputs, each scored 0–100. Each bar is that input's sub-score; the figure is the points it added to the 100-point composite (weight × sub-score).
- Cash flow +22.1/30.0
- ARV discount +15.0/15.0
- DSCR +7.1/10.0
- 1% rule +6.2/10.0
- Schools +4.8/10.0
- Livability +3.4/5.0
- Rent growth +2.5/5.0
- Condition / age +2.5/5.0
- Appreciation +0.0/10.0
$149,900
🖨 Deal sheet (PDF) 📄 Offer letter ✓ Due diligence
Listing remarks MLS
In Town 1/2 Double. Has Finished Basement, 3 Bedrooms, 1 Bath, Finished Lower Level.
Key facts
- Finished room
- Half double home
- Galley style kitchen
Tags
Property features AI
Exterior
- Parking: Off-street parking; Parking pad; On-street parking
- Utilities: Public water; Public sewer; 100 amp electrical service with circuit breakers
- Home design: 2-story property
- Construction: Vinyl siding; Asphalt/fiberglass roof; Basement foundation (block); Basement with approximately 200 below-grade finished area
- Exterior features: Porch
Interior
- Kitchen: Gas oven; Gas range
- Bedrooms: Total of 7 rooms (includes bedrooms and living spaces)
- Bathrooms: 1 full bathroom
- Heating & cooling: Gas heating; Ceiling fans; Wall/window air conditioning units
- Interior features: Separate/formal dining room; Dining area
- Laundry & utility: Washer hookup; Dryer hookup; Gas water heater
Neighborhood map
What this means for you Summary
Snapshot
- This is a 3-bed/1.0-bath townhouse listed at $150k.
Deal economics
- At list price, monthly cash flow is $187 ($2k/yr) — positive.
- The deal already cash-flows at list — no discount required.
- Meets the 1% rule at list price ($2k rent vs $150k).
- Cap rate 8.2% vs local median 4.2% in Bangor — top-decile yield for the area; either an underpriced asset or a hidden risk that comps aren't pricing in. Stress-test before assuming the spread holds.
Location & tenants
- Location reads 68/100 on livability (#886 in PA) — a middle-class / working-renter tenant base. Strengths: cost of living A+, housing A+; Watch: employment C-, health & safety D, amenities F.
- Bangor Area SD (rural): math 50% / reading 60% proficiency, ranked #107 of 539 in PA (top 20%) — acceptable for families but not a draw, mixed tenant base, ~2y average lease.
- Market conditions: 76 active listings in the ZIP; 2 comparable units currently listed for rent nearby; solid renter incomes; 567 units permitted in Northampton County in 2024 (151 in 5+ unit buildings).
Forward outlook
- Local home prices are declining (-3.0%/yr); year-one equity from $1k of loan paydown is wiped out by about $4k of value loss. Plan a longer hold.
Negotiation context
- Only 5 days on market — expect competitive offers; lowballing is unlikely to land.
- 2 sale attempts since 14y ago with the ask held roughly flat each time — persistent listings suggest the price (not the market) is what's stuck; bring a comps-based counter.
- Current owner paid $37k; list at $150k implies a 305% gain — meaningful room to come down on a strong offer.
Risks & watch-outs
- Watch-outs: flood insurance adds $56/mo; built in 1905 — expect roof / HVAC / electrical / plumbing capex.
- Climate carrying-cost: severe flood risk; extreme-heat days projected 7→16/yr by 2055 (HVAC capex compounding) — expect insurance premiums to compound above CPI over the hold.
Questions for the listing agent
- Built in 1905 — when were the roof, HVAC, electrical panel, plumbing, and water heater last replaced?
- What's the actual annual flood-insurance premium (NFIP or private), and is the property in a SFHA with mandatory coverage?
- Is there a deadline driving the sale (1031 exchange, divorce, estate, relocation)? That informs how much negotiation room exists.
- What's the average days-on-market for RENTAL listings here right now (not sales)? A rising rental-DOM trend means longer vacancies and softer asking-rent achievability than the comps imply.
- What's the recent tenant-quality profile in this submarket — average credit score on applications, eviction rate, late-payment / NSF rate, and stable-employment percentage? A property-management company in the area should have these aggregated.
- How much new for-sale + rental construction is in the pipeline within 1–3 miles? Heavy new supply typically softens prices + rents 12–24 months out; constrained supply supports both.
Investment metrics
- 1% rule
- 1.12% ✓
- Cap rate
- 8.23%
- Cash-on-cash
- 6.94%
- DSCR
- 1.31
- GRM
- 7.4
CMA / ARV
- ARV (on-the-fly)
- $214,508
- Comps found
- 11
Show comp detail 11 sales within ~0.75 mi
| Address | Dist | Beds/Ba | Sqft | Sold | Price | $/sf | Match |
|---|---|---|---|---|---|---|---|
| 40 N 2nd St | 0.51mi | 3/1.0 | 1,356 (+3%) | 3mo | $185,000 | $136 | 69 |
| 267 S Main St | 0.18mi | 3/1.0 | 1,120 (-15%) | 3mo | $230,000 | $205 | 64 |
| 351 S 2nd St | 0.21mi | 4/1.5 (+1) | 1,314 (-0%) | 23mo | $235,000 | $179 | 64 |
| 637 S Main St | 0.12mi | 3/2.5 | 1,442 (+10%) | 12mo | $275,000 | $191 | 63 |
| 430 S Northampton St | 0.07mi | 3/1.5 | 1,168 (-11%) | 18mo | $195,000 | $167 | 61 |
| 521 Broadway | 0.54mi | 3/1.0 | 1,346 (+2%) | 13mo | $219,900 | $163 | 60 |
| 639 S Main St | 0.13mi | 3/1.5 | 1,190 (-10%) | 20mo | $102,600 | $86 | 60 |
| 71 N 3rd St | 0.57mi | 3/1.5 | 1,450 (+10%) | 12mo | $235,000 | $162 | 44 |
| 407 Pennsylvania Ave | 0.67mi | 3/1.5 | 1,444 (+10%) | 8mo | $235,000 | $163 | 44 |
| 409 Pennsylvania Ave | 0.66mi | 3/1.5 | 1,452 (+10%) | 10mo | $220,000 | $152 | 42 |
| 723 Market St | 0.70mi | 4/1.0 (+1) | 1,456 (+11%) | 13mo | $151,000 | $104 | 34 |
Match score weights: distance 35% · size 25% · config 20% · recency 20%. Top-matched comps best support the ARV.
Projected returns pro-forma
-3.0% appreciation · 3.0% rent growth · sell at horizon
- IRR
- -7.9%
- Equity multiple
- 0.71×
- Total profit
- $-12,287
- Equity at exit
- $22,351
- IRR
- 1.7%
- Equity multiple
- 1.12×
- Total profit
- $5,005
- Equity at exit
- $12,961
Cash invested: $41,972 (down + closing). Projections, not guarantees.
Landlord ↔ Tenant lean methodology
- Overall (STATE)
- 62 Landlord-Friendly
- State Pennsylvania
- 62 Landlord-Friendly · EVEN
- County
- — inherits STATE
- City
- — inherits STATE
ZIP-level market 18013
- Active inventory
- 76
- Price-to-rent
- 7.4×
Monthly cashflow live
- Estimated rent
- $1,681 medium interval (Pro) →
- Mortgage (P&I)
- −$786
- Tax from tax record
- −$237 /mo · $2,839/yr
- Insurance
- −$62
- Flood insurance flood zone
- −$56 /mo · $666/yr
- HOA
- −$0
- Vacancy / Maint / Mgmt
- −$353
- Net cashflow
- $187
Break-even live
Sensitivity live
| Price | -10% $272 | -5% $229 | +0% $187 | +5% $145 | +10% $102 |
|---|---|---|---|---|---|
| Rent | -10% $54 | -5% $121 | +0% $187 | +5% $253 | +10% $320 |
| Rate | -1.0pp $263 | -0.5pp $225 | base $187 | +0.5pp $148 | +1.0pp $109 |
UW: 25.0% down · 7.5% · 30yr · 1.5% tax · 5.0% vac · 8.0% maint · 8.0% mgmt
Financing live
Cash to close
- Down payment
- $37,475
- Closing costs
- $4,497
- Reserves months
- —
- Total cash needed
- —
Loan-product check · same deal, 3 products live
Conventional
25% down · 7.5% · 30yr
- Down + closing
- —
- Monthly P&I
- —
- Monthly cashflow
- —
- DSCR
- —
- Eligible?
- —
Personal DTI + credit; lowest rate.
DSCR
20% down · 8.5% · 30yr
- Down + closing
- —
- Monthly P&I
- —
- Monthly cashflow
- —
- DSCR
- —
- Eligible?
- —
No personal income docs; deal must DSCR.
Hard money
10% down · 12.0% · 12mo
- Down + closing
- —
- Monthly P&I
- —
- Monthly cashflow
- —
- DSCR
- —
- Eligible?
- —
Short-term bridge; refi at stabilization.
Rent comps 2 comps
| Address | Beds | Baths | Sqft | Rent | $/sqft | DOM | Units | Dist |
|---|---|---|---|---|---|---|---|---|
| 225 N 8th St Bangor, PA | 3.0 | 1.5 | 1120 | $1,850 | $1.65 | 4d | 1 | 0.93mi |
| 338 Washington Blvd Bangor, PA | 3.0 | 1.0 | 1004 | $1,499 | $1.49 | 4d | 1 | 1.13mi |
Listing history 5 events
-
2026-06-15status $149,900 Pending 5 DOM
-
2026-06-15days on market $149,900 Active 5 DOM
-
2026-06-14days on market $149,900 Active 3 DOM
-
2026-06-13remarks 469-char remark
-
2026-06-13$149,900 Active 2 DOM
ⓘ Source: listings_history table (triggers on properties + properties_extension) + one-shot
backfill from property_details.listing_events for pre-trigger history.
Tax reassessment forecast PA · Partial reset (capped growth)
- Current annual tax
- $2,839 · $237/mo
- Projected year-2 tax
- $2,839 · $237/mo
- Expected delta
- $0/yr ($0/mo · 0.0%)
ⓘ Screening estimate from a state-policy table — verify with the county assessor before closing.
Climate risk First Street
- Flood 8/10 Severe FEMA zone X (unshaded) · 99% chance over 30 yrs
- Wildfire 1/10 Low
- Heat 5/10 Major 7 d/yr ≥96°F today · 16 d/yr by 30 yrs out
- Wind 4/10 Moderate 13% chance of damaging wind over 30 yrs
- Air quality 2/10 Low 1 unhealthy d/yr today · 3 by 30 yrs out
Nearby sold comps map
Loading sold comps map…
Walkable amenities ~0.75 mi
Loading nearby amenities…
Taxation est. · year 1
- Rental income
- $20,168
- − Mortgage interest
- −$8,397
- − Property taxes
- −$2,839
- − Insurance
- −$1,416
- − Repairs & maintenance
- −$1,613
- − Management
- −$1,613
- − Depreciation
- −$4,361
- Taxable loss
- −$71
- Est. tax savings @ 24.0%
- +$17
- After-tax cash flow
- $2,262/yr
For passive investors: Depreciation is non-cash, so a rental often shows a tax loss while cash-flowing — sheltering income. Rental losses are passive: they offset passive income freely, and up to $25,000/yr can offset ordinary (W-2) income if you actively participate and your MAGI is under $100k (phasing out to $0 by $150k); unused losses carry forward. On sale, claimed depreciation is recaptured at up to 25%, and gains may owe capital-gains tax (a 1031 exchange can defer both). Figures are a year-1 estimate at your 24.0% rate — not tax advice; consult a CPA.
Schools (NCES district)
- District
- Bangor Area SD
- NCES district ID
- 4203000
- Math proficiency
- 50% ▲ 1.00%
- Reading proficiency
- 60% ▼ -5.00%
- Median HH income
- $57,818
- Composite
- 47.64/100
- National rank
- #2250
- State rank
- #107 of 539 in PA
Livability — Bangor
- Score
- 68/100
- State rank
- #886
- US rank
- #9437
Category grades
Schools grade is shown separately in the Schools card above.
Census & demographics
- Census place
- Bangor, PA
- County
- Northampton County · 236,814 people
- City population
- 17,597
- Metro
- Allentown-Bethlehem-Easton, PA-NJ
- Population (ZIP)
- 17,597
- Household income
- $78,847
- Rent vs Own
- Severe rent burden
- 346.0
Population outlook (Northampton County) Hauer SSP2
- Today (2025)
- 312,227 people
- By 2030
- 314,769 · +0.8%
- By 2040
- 316,914 · +1.5%
- By 2050
- 318,037 · +1.9%
- By 2075
- 334,003 · +7.0%
- By 2100
- 344,696 · +10.4%
Race, ethnicity, and origin ACS 2023
- Neighborhood character
- Predominantly White (89%)
- Race & ethnicity
- White 89% Hispanic / Latino 7% Two or more races 4% Black 1%
- Hispanic origin (detail)
- Mexican 1% Puerto Rican 2%
- Common ancestry
- Romanian 3% Iranian 2% Lithuanian 2%
- Foreign-born
- 3% · Canada, China
- Languages at home
- 95% English-only · Spanish 3% Other Indo-European 1% French/Haitian/Cajun 1%
Political lean MEDSL · Northampton
- 2024 margin
- Toss-up / Even · D 48.6% · R 50.4%
- 2008→2024 swing
- -14.1pp toward R · 2008: 12.3pp · 2024: -1.8pp
- All cycles
- 2024: R+1.8 2020: D+0.7 2016: R+3.8 2012: D+4.6 2008: D+12.3
Not yet ingested
- Civics
- —
Market trends
- HPI YoY
- ▼ -158.33%
- Current HPI
- 191.8044
- Rent YoY
- —
- Metro
- Allentown-Bethlehem-Easton, PA-NJ
- State GDP YoY
- ▲ 1.68%
- F500 in state
- 34
Industry mix (Fortune 500 HQ in PA)
| Industry | F500 HQs | Revenue |
|---|---|---|
| Healthcare | 2 | $309B |
|
||
| Insurance | 2 | $27B |
|
||
| Telecommunications / Media | 1 | $124B |
|
||
| Industrial Distribution | 1 | $22B |
|
||
| Financial Services | 1 | $20B |
|
||
| Chemicals / Materials | 1 | $18B |
|
||
Price history
+249.4% since first listed4 events — show timeline
- 2026-06-09 Listed $149,900 GLVRMLS
- 2013-02-08 Sold (MLS) $37,000 PMAR
- 2012-12-21 Listed $38,900 PMAR
- 1999-06-03 Sold (Public Records) $42,900 Public Records
Property tax history
+1.1%/yrLatest (2026): $2,839 · +0.6% YoY. Source: county tax records.
Cash-flow waterfall
monthlySold comps — $/sqft
last 12 mo · ≤1 miLoading sold comps…