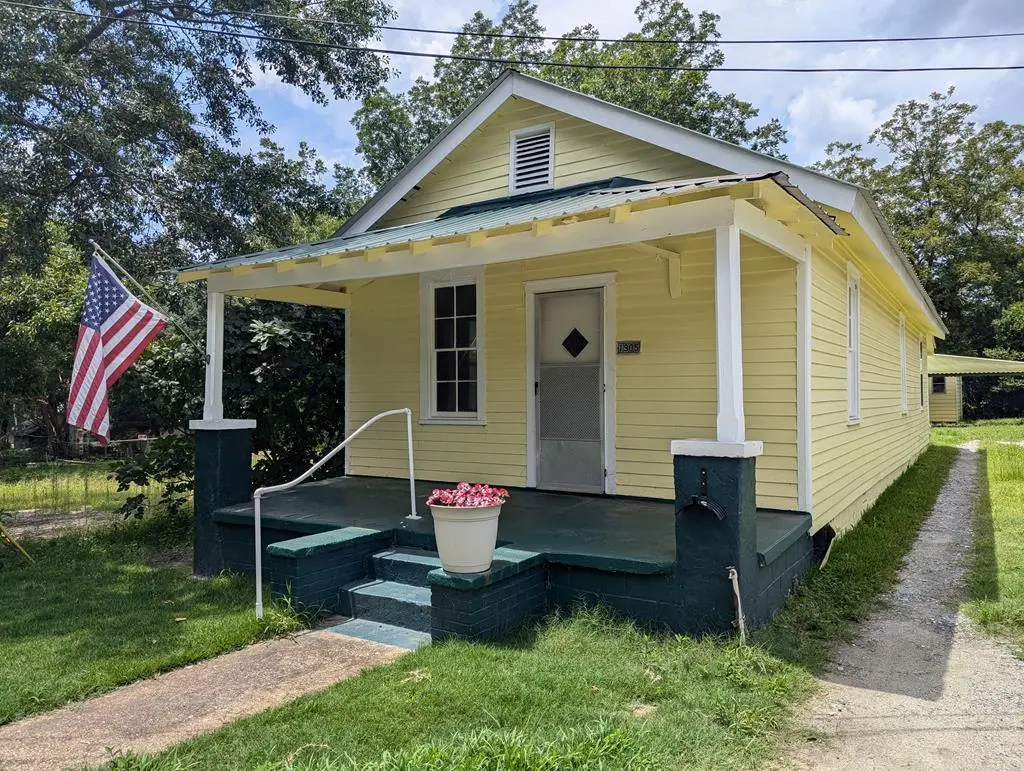
1905 10th Ave · Phenix City, AL
Flood risk 1/10 · Minimal
- FEMA flood zone
- X (unshaded)
- Chance of flooding over 30 yrs
- 0.0%
- Est. flood insurance / yr
- $507 – $1,088
Fire risk 1/10 · Minimal
- Est. fire insurance / yr
- $916 – $1,700
Heat risk 7/10 · Major
- Hot days now (above 107°F)
- 7 days/yr
- Hot days in 30 yrs
- 19 days/yr
Wind risk 6/10 · Moderate
- Chance of severe wind over 30 yrs
- 76.0%
Air-quality risk 5/10 · Moderate
- Unhealthy air days now
- 7 days/yr
- Unhealthy air days in 30 yrs
- 8 days/yr
Risk factors via First Street. Map © Google.
Why this score? — see what drove the B+ grade
The composite is a weighted blend of 9 inputs, each scored 0–100. Each bar is that input's sub-score; the figure is the points it added to the 100-point composite (weight × sub-score).
- Cash flow +30.0/30.0
- ARV discount +15.0/15.0
- 1% rule +10.0/10.0
- DSCR +10.0/10.0
- Rent growth +3.8/5.0
- Livability +3.0/5.0
- Schools +2.7/10.0
- Condition / age +2.5/5.0
- Appreciation +0.0/10.0
$55,000
🖨 Deal sheet 📄 Offer letter ✓ Due diligence
Listing remarks
Investors, add an easy well cared for cottage to your portfolio that is already cash flowing! Currently rented for $660 with a year lease in place (ending Aug 2026). This charming cottage in the heart of Phenix City has been well-maintained over the years by generations of the same family and has only recently converted to a rental property. Metal roof, original wood floors in 2 rooms, newer linoleum in kitchen. HVAC cools wonderfully and is just 8 years old. Exterior is clean with a good paint job. A well-kept gravel path leads to the back double carport and a wired shed. DO NOT DISTURB TENANTS.
Key facts
- Metal roof
- Newer linoleum
- Original wood floors
Tags
Property features AI
Exterior
- Security: Smoke detectors
- Utilities: Public water; Public sewer
- Home design: Single-family residence; 1 story
- Construction: Shingle siding
- Exterior features: Outbuilding
Interior
- Kitchen: Gas range
- Flooring: Hardwood flooring
- Bathrooms: 1 full bathroom
- Heating & cooling: Electric heating
- Interior features: Fireplace (1); Crawl space basement
- Laundry & utility: Dedicated laundry room
Neighborhood map
What this means for you Summary
Snapshot
- This is a 2-bed/1.0-bath single-family listed at $55k.
Deal economics
- At list price, monthly cash flow is $671 ($8k/yr) — positive.
- The deal already cash-flows at list — no discount required.
- Meets the 1% rule at list price ($1k rent vs $55k).
- Recommended offer: $50k (9.0% below list) — sets the bar for market timing.
- Cap rate 20.9% vs local median 5.0% in Phenix City — top-decile yield for the area; either an underpriced asset or a hidden risk that comps aren't pricing in. Stress-test before assuming the spread holds.
Location & tenants
- Location reads 60/100 on livability (#297 in AL) — a middle-class / working-renter tenant base. Strengths: cost of living A+, housing A+; Watch: schools D+, crime F, amenities F.
- Phenix City (suburban): math 22% / reading 44% proficiency, ranked #59 of 129 in AL (top 46%) — families likely to look elsewhere, expect single-tenant / working-renter base with shorter leases; 64% free/reduced lunch — lower-income household profile, screen leases tightly.
- Market conditions: Rents rising fast (+5.3%/yr); 217 active listings in the ZIP; 3 comparable units currently listed for rent nearby; rentals at typical pace (median 21d on market — plan ~3-4 weeks tenant-placement turnaround); 183 units permitted in Russell County in 2024 (0 in 5+ unit buildings).
- This rent runs 32% of the median local income ($48k/yr) — at the standard rent-burdened threshold; future hikes will face affordability resistance.
Forward outlook
- Local home prices are declining (-3.0%/yr); year-one equity from $380 of loan paydown is wiped out by about $2k of value loss. Plan a longer hold.
- Russell County population projected at +42% by 2050 — long-run rental-demand tailwind backs the buy-and-hold thesis.
- At projected returns (-3.0% appreciation + 5.3% rent growth), your $15k cash investment doubles in ~3 years — after that, you're playing with house money.
Negotiation context
- It's been on market 92 days — a 9% lower offer ($50k) is reasonable based on typical stale-listing flexibility.
- 5 sale attempts since 2y ago; this cycle's ask has dropped $10k (15%) from the opening price — seller is motivated, your offer sets the floor, not the list.
- Current owner paid $21k; list at $55k implies a 166% gain — meaningful room to come down on a strong offer.
Risks & watch-outs
- Watch-outs: built in 1900 — expect roof / HVAC / electrical / plumbing capex.
- Climate carrying-cost: major wind risk, 76% chance of damaging wind over 30y; extreme-heat days projected 7→19/yr by 2055 (HVAC capex compounding) — expect insurance premiums to compound above CPI over the hold.
Questions for the listing agent
- It's been on market 92 days. Have you received any prior offers? Is the seller open to a 9% concession, seller financing, or rate buy-down credit?
- Built in 1900 — when were the roof, HVAC, electrical panel, plumbing, and water heater last replaced?
- Why hasn't it sold? Are there any deal-killer items the seller is aware of (foundation, flood, title, zoning, code violations)?
- Is there a deadline driving the sale (1031 exchange, divorce, estate, relocation)? That informs how much negotiation room exists.
- Schools are D-rated, which usually means shorter tenancies and higher turnover. Who's the typical renter profile here, and what's been the actual vacancy rate?
- Crime grade is F in this area — have there been break-ins, vandalism, or insurance claims at this property in the last 3 years? What carrier currently insures it and at what premium?
- What's the average days-on-market for RENTAL listings here right now (not sales)? A rising rental-DOM trend means longer vacancies and softer asking-rent achievability than the comps imply.
- What's the recent tenant-quality profile in this submarket — average credit score on applications, eviction rate, late-payment / NSF rate, and stable-employment percentage? A property-management company in the area should have these aggregated.
- How much new for-sale + rental construction is in the pipeline within 1–3 miles? Heavy new supply typically softens prices + rents 12–24 months out; constrained supply supports both.
Investment metrics
- 1% rule
- 2.35% ✓
- Cap rate
- 20.93%
- Cash-on-cash
- 52.27%
- DSCR
- 3.33
- GRM
- 3.5
CMA / ARV
- ARV (on-the-fly)
- $81,090
- Comps found
- 12
Show comp detail 12 sales within ~0.75 mi
| Address | Dist | Beds/Ba | Sqft | Sold | Price | $/sf | Match |
|---|---|---|---|---|---|---|---|
| 804 N Railroad St St | 0.16mi | 2/2.0 | 938 (-2%) | 3mo | $64,000 | $68 | 83 |
| 2002 6th Ave | 0.37mi | 2/1.0 | 1,024 (+7%) | 2mo | $32,500 | $32 | 69 |
| 1208 20th st St | 0.30mi | 3/1.0 (+1) | 1,040 (+9%) | 3mo | $50,800 | $49 | 64 |
| 1514 10th Ave | 0.17mi | 2/1.0 | 816 (-14%) | 10mo | $23,000 | $28 | 60 |
| 1506 14th Ct | 0.45mi | 3/1.0 (+1) | 916 (-4%) | 9mo | $63,000 | $69 | 59 |
| 1704 18th St | 0.68mi | 3/1.0 (+1) | 980 (+3%) | 3mo | $100,000 | $102 | 56 |
| 215 23rd St St | 0.58mi | 2/1.0 | 877 (-8%) | 5mo | $100,000 | $114 | 55 |
| 1500 14th Ct | 0.46mi | 3/1.0 (+1) | 1,034 (+8%) | 10mo | $139,000 | $134 | 51 |
| 2103 14th Ct | 0.45mi | 2/1.0 | 825 (-14%) | 8mo | $70,000 | $85 | 50 |
| 604 20th St | 0.34mi | 3/1.0 (+1) | 1,094 (+15%) | 9mo | $58,000 | $53 | 48 |
| 105 25th St | 0.72mi | 3/1.0 (+1) | 925 (-3%) | 10mo | $135,000 | $146 | 48 |
| 1309 12th Pl | 0.66mi | 2/1.0 | 1,086 (+14%) | 1mo | $114,000 | $105 | 45 |
Match score weights: distance 35% · size 25% · config 20% · recency 20%. Top-matched comps best support the ARV.
Projected returns pro-forma
-3.0% appreciation · 5.33% rent growth · sell at horizon
- IRR
- 52.8%
- Equity multiple
- 3.40×
- Total profit
- $36,919
- Equity at exit
- $8,201
- IRR
- 58.9%
- Equity multiple
- 7.53×
- Total profit
- $100,541
- Equity at exit
- $4,755
Cash invested: $15,400 (down + closing). Projections, not guarantees.
Landlord ↔ Tenant lean methodology
- Overall (STATE)
- 90 Strongly Landlord-Friendly
- State Alabama
- 90 Strongly Landlord-Friendly · R+15
- County
- — inherits STATE
- City
- — inherits STATE
ZIP-level market 36867
- Home prices YoY
- -30.1%
- Rents YoY
- 5.3%
- Active inventory
- 217
- Price-to-rent
- 3.5×
Monthly cashflow live
- Estimated rent
- $1,295 medium interval (Pro) →
- Mortgage (P&I)
- −$288
- Tax from tax record
- −$41 /mo · $491/yr
- Insurance
- −$23
- HOA
- −$0
- Vacancy / Maint / Mgmt
- −$272
- Net cashflow
- $671
Break-even live
UW: 25.0% down · 7.5% · 30yr · 1.5% tax · 5.0% vac · 8.0% maint · 8.0% mgmt
Financing live
Cash to close
- Down payment
- $13,750
- Closing costs
- $1,650
- Reserves months
- —
- Total cash needed
- —
Loan-product check · same deal, 3 products live
Conventional
25% down · 7.5% · 30yr
- Down + closing
- —
- Monthly P&I
- —
- Monthly cashflow
- —
- DSCR
- —
- Eligible?
- —
Personal DTI + credit; lowest rate.
DSCR
20% down · 8.5% · 30yr
- Down + closing
- —
- Monthly P&I
- —
- Monthly cashflow
- —
- DSCR
- —
- Eligible?
- —
No personal income docs; deal must DSCR.
Hard money
10% down · 12.0% · 12mo
- Down + closing
- —
- Monthly P&I
- —
- Monthly cashflow
- —
- DSCR
- —
- Eligible?
- —
Short-term bridge; refi at stabilization.
Rent comps 3 comps
| Address | Beds | Baths | Sqft | Rent | $/sqft | DOM | Units | Dist |
|---|---|---|---|---|---|---|---|---|
| 2108 9th Ave Phenix City, AL | 3.0 | 1.0 | 1040 | $1,150 | $1.11 | 21d | 1 | 0.27mi |
| 1106 Broadway Unit 1106C Columbus, GA | 1.0 | 1.0 | 930 | $1,600 | $1.72 | 13d | 1 | 1.08mi |
| 2702 N Railroad St Phenix City, AL | 2.0 | 1.0 | 768 | $1,200 | $1.56 | 21d | 1 | 1.39mi |
Listing history 36 events
-
2026-06-18days on market $55,000 Active 92 DOM
-
2026-06-17days on market $55,000 Active 91 DOM
-
2026-06-16days on market $55,000 Active 90 DOM
-
2026-06-15days on market $55,000 Active 89 DOM
-
2026-06-14days on market $55,000 Active 87 DOM
-
2026-06-13days on market $55,000 Active 86 DOM
-
2026-06-10days on market $55,000 Active 84 DOM
-
2026-06-09days on market $55,000 Active 83 DOM
-
2026-06-08days on market $55,000 Active 82 DOM
-
2026-06-07days on market $55,000 Active 81 DOM
-
2026-06-05days on market $55,000 Active 78 DOM
-
2026-06-02days on market $55,000 Active 76 DOM
-
2026-06-01days on market $55,000 Active 75 DOM
-
2026-05-31days on market $55,000 Active 74 DOM
-
2026-05-30days on market $55,000 Active 73 DOM
-
2026-04-13price $55,000
-
2026-03-18$65,000 Active
-
2025-11-03$75,000 Active
-
2025-07-30historical $660
-
2025-06-17$660
-
2025-05-12price $77,500
-
2025-03-06price $80,000
-
2025-02-03price $82,500
-
2025-01-06price $85,000
-
2025-01-06price $85,000
-
2024-11-29status Active
-
2024-11-29price $90,000
-
2024-11-29price $90,000
-
2024-11-08status Pending
-
2024-11-02price $87,500
-
2024-09-30price $87,500
-
2024-09-01price $90,000
-
2024-09-01price $90,000
-
2024-08-10price $95,000
-
2024-07-31$100,000 Active
-
2004-06-11soldstatus $20,672
ⓘ Source: listings_history table (triggers on properties + properties_extension) + one-shot
backfill from property_details.listing_events for pre-trigger history.
Tax reassessment forecast AL · Resets to sale price
- Current annual tax
- $491 · $41/mo
- Projected year-2 tax
- $491 · $41/mo
- Expected delta
- $0/yr ($0/mo · 0.0%)
ⓘ Screening estimate from a state-policy table — verify with the county assessor before closing.
Climate risk First Street
- Flood 1/10 Low FEMA zone X (unshaded) · 0% chance over 30 yrs
- Wildfire 1/10 Low
- Heat 7/10 Severe 7 d/yr ≥107°F today · 19 d/yr by 30 yrs out
- Wind 6/10 Major 76% chance of damaging wind over 30 yrs
- Air quality 5/10 Major 7 unhealthy d/yr today · 8 by 30 yrs out
Nearby sold comps map
Loading sold comps map…
Walkable amenities ~0.75 mi
Loading nearby amenities…
Taxation est. · year 1
- Rental income
- $15,540
- − Mortgage interest
- −$3,081
- − Property taxes
- −$491
- − Insurance
- −$275
- − Repairs & maintenance
- −$1,243
- − Management
- −$1,243
- − Depreciation
- −$1,600
- Taxable income
- $7,607
- Est. tax owed @ 24.0%
- −$1,826
- After-tax cash flow
- $6,224/yr
For passive investors: Depreciation is non-cash, so a rental often shows a tax loss while cash-flowing — sheltering income. Rental losses are passive: they offset passive income freely, and up to $25,000/yr can offset ordinary (W-2) income if you actively participate and your MAGI is under $100k (phasing out to $0 by $150k); unused losses carry forward. On sale, claimed depreciation is recaptured at up to 25%, and gains may owe capital-gains tax (a 1031 exchange can defer both). Figures are a year-1 estimate at your 24.0% rate — not tax advice; consult a CPA.
Schools (NCES district)
- District
- Phenix City
- NCES district ID
- 0102700
- Math proficiency
- 22% ▼ -24.00%
- Reading proficiency
- 44% ▼ -1.00%
- Median HH income
- $36,228
- Composite
- 27.29/100
- National rank
- #7001
- State rank
- #59 of 129 in AL
Livability — Phenix City
- Score
- 60/100
- State rank
- #297
- US rank
- #19037
Category grades
Schools grade is shown separately in the Schools card above.
Census & demographics
- Census place
- Phenix City, AL
- County
- Russell County · 53,055 people
- City population
- 62,290
- Metro
- Columbus, GA-AL
- Population (ZIP)
- 22,821
- Household income
- $48,026
- Rent vs Own
- Severe rent burden
- 1399.0
Population outlook (Russell County) Hauer SSP2
- Today (2025)
- 70,137 people
- By 2030
- 75,826 · +8.1%
- By 2040
- 87,858 · +25.3%
- By 2050
- 99,721 · +42.2%
- By 2075
- 128,009 · +82.5%
- By 2100
- 149,251 · +112.8%
Race, ethnicity, and origin ACS 2023
- Neighborhood character
- Diverse neighborhood (Simpson 0.60)
- Race & ethnicity
- White 53% Black 34% Hispanic / Latino 7% Two or more races 7% Asian 2%
- Hispanic origin (detail)
- Mexican 1% Puerto Rican 2% Cuban 2%
- Common ancestry
- Romanian 2% Italian 2% Slovak 1%
- Foreign-born
- 4% · Canada, China, South Korea
- Languages at home
- 94% English-only · Spanish 4% Tagalog/Filipino 1%
Political lean MEDSL · Russell
- 2024 margin
- Toss-up / Even · D 50.4% · R 48.7%
- 2008→2024 swing
- -5.6pp toward R · 2008: 7.3pp · 2024: 1.7pp
- All cycles
- 2024: D+1.7 2020: D+6.4 2016: D+1.9 2012: D+11.8 2008: D+7.3
Not yet ingested
- Civics
- —
Market trends
- HPI YoY
- ▼ -74.10%
- Current HPI
- 171.8426
- Rent YoY
- ▲ 5.33%
- Metro
- Columbus, GA-AL
- State GDP YoY
- ▲ 2.94%
- F500 in state
- 4
Industry mix (Fortune 500 HQ in AL)
| Industry | F500 HQs | Revenue |
|---|---|---|
| Financial Services | 1 | $8B |
|
||
| Healthcare | 1 | $5B |
|
||
Price history
+166.1% since first listed21 events — show timeline
- 2026-04-13 Price Changed $55,000 CBOR
- 2026-03-18 Listed $65,000 CBOR
- 2025-11-03 Listed $75,000 EABOR
- 2025-07-30 Rental Removed $660 EABOR
- 2025-06-17 Listed for Rent $660 EABOR
- 2025-05-12 Price Changed $77,500 CBOR
- 2025-03-06 Price Changed $80,000 CBOR
- 2025-02-03 Price Changed $82,500 CBOR
- 2025-01-06 Price Changed $85,000 CBOR
- 2025-01-06 Price Changed $85,000 EABOR
- 2024-11-29 Relisted — EABOR
- 2024-11-29 Price Changed $90,000 EABOR
- 2024-11-29 Price Changed $90,000 CBOR
- 2024-11-08 Pending — EABOR
- 2024-11-02 Price Changed $87,500 EABOR
- 2024-09-30 Price Changed $87,500 CBOR
- 2024-09-01 Price Changed $90,000 EABOR
- 2024-09-01 Price Changed $90,000 CBOR
- 2024-08-10 Price Changed $95,000 EABOR
- 2024-07-31 Listed $100,000 EABOR
- 2004-06-11 Sold (Public Records) $20,672 Public Records
Property tax history
+10.5%/yrLatest (2025): $491 · +49.1% YoY. Source: county tax records.
Cash-flow waterfall
monthlySold comps — $/sqft
last 12 mo · ≤1 miLoading sold comps…