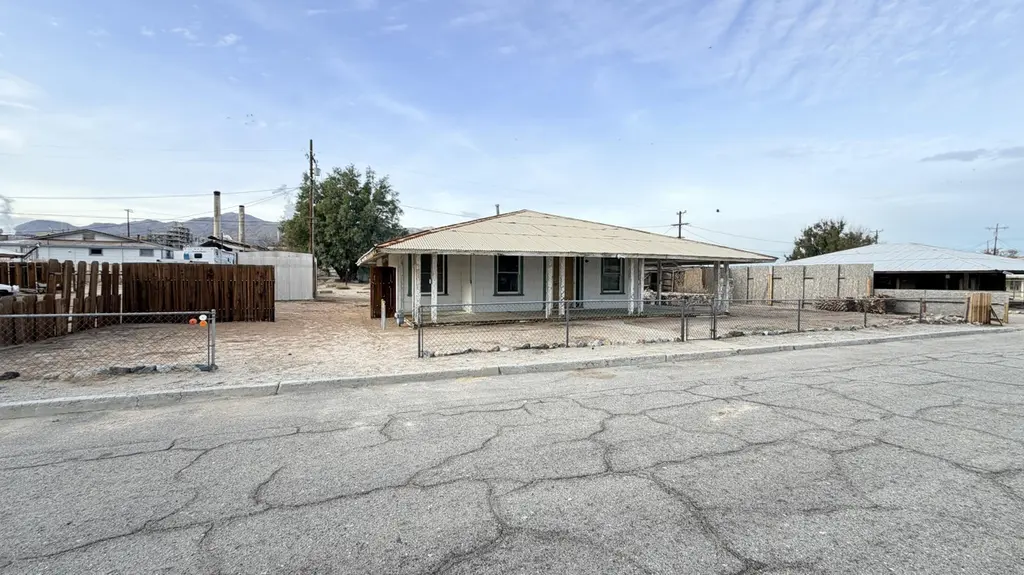
82962 Panamint Ave · Searles Valley, CA
Flood risk 1/10 · Minimal
- FEMA flood zone
- D
- Chance of flooding over 30 yrs
- 0.0%
- Est. flood insurance / yr
- $544 – $1,084
Fire risk 2/10 · Minimal
- Est. fire insurance / yr
- $659 – $1,223
Heat risk 8/10 · Major
- Hot days now (above 108°F)
- 7 days/yr
- Hot days in 30 yrs
- 20 days/yr
Wind risk 1/10 · Minimal
- Chance of severe wind over 30 yrs
- —
Air-quality risk 4/10 · Minor
- Unhealthy air days now
- 4 days/yr
- Unhealthy air days in 30 yrs
- 5 days/yr
Risk factors via First Street. Map © Google.
Why this score? — see what drove the B grade
The composite is a weighted blend of 9 inputs, each scored 0–100. Each bar is that input's sub-score; the figure is the points it added to the 100-point composite (weight × sub-score).
- Cash flow +30.0/30.0
- 1% rule +10.0/10.0
- DSCR +10.0/10.0
- ARV discount +8.5/15.0
- Appreciation +5.0/10.0
- Livability +3.1/5.0
- Schools +3.0/10.0
- Rent growth +2.5/5.0
- Condition / age +2.5/5.0
$39,000
🖨 Deal sheet (PDF) 📄 Offer letter ✓ Due diligence
Listing remarks MLS
This property is perfect for investors or buyers eager to renovate and add value. Key utilities are already in place including sewer, water, electric, and gas meters-making your renovation process that much easier. Inside, you'll find a centrally located kitchen and an oversized full bathroom, offering a flexible layout ready for your personal touch. Enjoy relaxing on the covered front porch or take advantage of the fully fenced lot with ample outdoor space, a storage shed, and an additional outbuilding for all your needs. Seller financing is available with as little as $15,000 down and a 24-month carry making this the ideal opportunity for both first-time buyers and seasoned investors. Ready to make this home your own? Schedule a showing today!
Key facts
- Ample space
- Mostly fenced yard
- 9,506 sq ft lot
Tags
Neighborhood map
What this means for you Summary
Snapshot
- This is a 2-bed/1.0-bath single-family listed at $39k.
Deal economics
- At list price, monthly cash flow is $339 ($4k/yr) — positive.
- The deal already cash-flows at list — no discount required.
- Meets the 1% rule at list price ($749 rent vs $39k).
- Recommended offer: $35k (9.0% below list) — sets the bar for market timing.
- Cap rate 16.7% vs local median 10.4% in Searles Valley — top-decile yield for the area; either an underpriced asset or a hidden risk that comps aren't pricing in. Stress-test before assuming the spread holds.
Location & tenants
- Location reads 62/100 on livability (#500 in CA) — a middle-class / working-renter tenant base. Strengths: cost of living A+, housing A+, crime B; Watch: health & safety C-, schools F, amenities F.
- Trona Joint Unified (rural): math 25% / reading 40% proficiency, ranked #1,004 of 1,400 in CA (top 72%) — families likely to look elsewhere, expect single-tenant / working-renter base with shorter leases; 61% free/reduced lunch — lower-income household profile, screen leases tightly.
- Market conditions: 56 active listings in the ZIP; 3 comparable units currently listed for rent nearby; rentals lingering (median 45d on market — plan ~5-8 weeks vacancy on turnover, expect pricing pressure); 100% of comp listings sitting > 30 days — soft ceiling on asking rent; 5,458 units permitted in San Bernardino County in 2024 (1,500 in 5+ unit buildings).
Forward outlook
- In year one you build about $1k of equity ($270 loan paydown + $1k appreciation (3.0% local appreciation)).
- San Bernardino County population projected at +15% by 2050 — modest demand growth; plan on rents tracking national, not racing it.
- At projected returns (3.0% appreciation + 3.0% rent growth), your $11k cash investment doubles in ~2 years — after that, you're playing with house money.
Negotiation context
- It's been on market 110 days — a 9% lower offer ($35k) is reasonable based on typical stale-listing flexibility.
- 3 sale attempts with the ask held roughly flat each time — persistent listings suggest the price (not the market) is what's stuck; bring a comps-based counter.
- Current owner paid $31k; 26% above their basis — modest negotiation headroom, anchor on the comps not their cost.
Risks & watch-outs
- Watch-outs: built in 1918 — expect roof / HVAC / electrical / plumbing capex.
- Climate carrying-cost: extreme-heat days projected 7→20/yr by 2055 (HVAC capex compounding) — expect insurance premiums to compound above CPI over the hold.
Questions for the listing agent
- It's been on market 110 days. Have you received any prior offers? Is the seller open to a 9% concession, seller financing, or rate buy-down credit?
- Built in 1918 — when were the roof, HVAC, electrical panel, plumbing, and water heater last replaced?
- Why hasn't it sold? Are there any deal-killer items the seller is aware of (foundation, flood, title, zoning, code violations)?
- Is there a deadline driving the sale (1031 exchange, divorce, estate, relocation)? That informs how much negotiation room exists.
- Schools are F-rated, which usually means shorter tenancies and higher turnover. Who's the typical renter profile here, and what's been the actual vacancy rate?
- What's the average days-on-market for RENTAL listings here right now (not sales)? A rising rental-DOM trend means longer vacancies and softer asking-rent achievability than the comps imply.
- What's the recent tenant-quality profile in this submarket — average credit score on applications, eviction rate, late-payment / NSF rate, and stable-employment percentage? A property-management company in the area should have these aggregated.
- How much new for-sale + rental construction is in the pipeline within 1–3 miles? Heavy new supply typically softens prices + rents 12–24 months out; constrained supply supports both.
Investment metrics
- 1% rule
- 1.92% ✓
- Cap rate
- 16.73%
- Cash-on-cash
- 37.29%
- DSCR
- 2.66
- GRM
- 4.3
CMA / ARV
- ARV (median comp)
- $39,928
- List price
- $39,000
- Delta
- -2.32%
- Verdict
- FAIR
- Comps
- 19 within 1.0 mi
Show comp detail 5 sales within ~0.75 mi
| Address | Dist | Beds/Ba | Sqft | Sold | Price | $/sf | Match |
|---|---|---|---|---|---|---|---|
| 13319 Wildrose St | 0.52mi | 2/1.0 | 1,145 (-6%) | 8mo | $95,000 | $83 | 58 |
| 13322 Mariposa St | 0.35mi | 2/1.0 | 1,104 (-10%) | 12mo | $62,500 | $57 | 57 |
| 13407 Holly St | 0.65mi | 2/1.0 | 1,145 (-6%) | 7mo | $109,000 | $95 | 53 |
| 13285 Lupine St | 0.47mi | 2/1.0 | 1,104 (-10%) | 23mo | $14,900 | $13 | 42 |
| 13408 Sage St | 0.74mi | 3/2.0 (+1) | 1,385 (+13%) | 13mo | $169,900 | $123 | 23 |
Match score weights: distance 35% · size 25% · config 20% · recency 20%. Top-matched comps best support the ARV.
Projected returns pro-forma
3.0% appreciation · 3.0% rent growth · sell at horizon
- IRR
- 42.9%
- Equity multiple
- 3.41×
- Total profit
- $26,311
- Equity at exit
- $17,536
- IRR
- 42.7%
- Equity multiple
- 6.80×
- Total profit
- $63,384
- Equity at exit
- $27,025
Cash invested: $10,920 (down + closing). Projections, not guarantees.
Landlord ↔ Tenant lean methodology
- Overall (STATE)
- 18 Strongly Tenant-Friendly
- State California
- 18 Strongly Tenant-Friendly · D+13
- County
- — inherits STATE
- City
- — inherits STATE
ZIP-level market 93562
- Active inventory
- 56
- Price-to-rent
- 4.3×
Monthly cashflow live
- Estimated rent
- $749 medium interval (Pro) →
- Mortgage (P&I)
- −$205
- Tax from tax record
- −$32 /mo · $381/yr
- Insurance
- −$16
- HOA
- −$0
- Vacancy / Maint / Mgmt
- −$157
- Net cashflow
- $339
Break-even live
Sensitivity live
| Price | -10% $361 | -5% $350 | +0% $339 | +5% $328 | +10% $317 |
|---|---|---|---|---|---|
| Rent | -10% $280 | -5% $310 | +0% $339 | +5% $369 | +10% $399 |
| Rate | -1.0pp $359 | -0.5pp $349 | base $339 | +0.5pp $329 | +1.0pp $319 |
UW: 25.0% down · 7.5% · 30yr · 1.5% tax · 5.0% vac · 8.0% maint · 8.0% mgmt
Financing live
Cash to close
- Down payment
- $9,750
- Closing costs
- $1,170
- Reserves months
- —
- Total cash needed
- —
Loan-product check · same deal, 3 products live
Conventional
25% down · 7.5% · 30yr
- Down + closing
- —
- Monthly P&I
- —
- Monthly cashflow
- —
- DSCR
- —
- Eligible?
- —
Personal DTI + credit; lowest rate.
DSCR
20% down · 8.5% · 30yr
- Down + closing
- —
- Monthly P&I
- —
- Monthly cashflow
- —
- DSCR
- —
- Eligible?
- —
No personal income docs; deal must DSCR.
Hard money
10% down · 12.0% · 12mo
- Down + closing
- —
- Monthly P&I
- —
- Monthly cashflow
- —
- DSCR
- —
- Eligible?
- —
Short-term bridge; refi at stabilization.
Rent comps 3 comps
| Address | Beds | Baths | Sqft | Rent | $/sqft | DOM | Units | Dist |
|---|---|---|---|---|---|---|---|---|
| 13350 Aster St Trona, CA | 2.0 | 1.0 | 720 | $825 | $1.15 | 44d | 1 | 0.43mi |
| 13366 Verbena St Trona, CA | 2.0 | 1.0 | 800 | $700 | $0.88 | 44d | 1 | 0.64mi |
| 13358 Verbena St Trona, CA | 2.0 | 1.0 | 835 | $700 | $0.84 | 44d | 1 | 0.64mi |
Listing history 19 events
-
2026-06-18days on market $39,000 Active 110 DOM
-
2026-06-17days on market $39,000 Active 109 DOM
-
2026-06-16days on market $39,000 Active 108 DOM
-
2026-06-15days on market $39,000 Active 107 DOM
-
2026-06-14days on market $39,000 Active 105 DOM
-
2026-06-13days on market $39,000 Active 104 DOM
-
2026-06-10days on market $39,000 Active 102 DOM
-
2026-06-09days on market $39,000 Active 101 DOM
-
2026-06-08days on market $39,000 Active 100 DOM
-
2026-06-07days on market $39,000 Active 99 DOM
-
2026-06-05days on market $39,000 Active 96 DOM
-
2026-06-03days on market $39,000 Active 95 DOM
-
2026-06-03days on market $39,000 Active 94 DOM
-
2026-06-01days on market $39,000 Active 93 DOM
-
2026-05-31days on market $39,000 Active 92 DOM
-
2026-03-08status Active 755-char remark
Show marketing remark (755 chars)
This property is perfect for investors or buyers eager to renovate and add value. Key utilities are already in place including sewer, water, electric, and gas meters-making your renovation process that much easier. Inside, you'll find a centrally located kitchen and an oversized full bathroom, offering a flexible layout ready for your personal touch. Enjoy relaxing on the covered front porch or take advantage of the fully fenced lot with ample outdoor space, a storage shed, and an additional outbuilding for all your needs. Seller financing is available with as little as $15,000 down and a 24-month carry making this the ideal opportunity for both first-time buyers and seasoned investors. Ready to make this home your own? Schedule a showing today!
-
2026-02-28$39,000 Active 353-char remark
Show marketing remark (353 chars)
Great investor property, Featuring ample space to relay out your perfect home. Seller financing available for up to 2 years with 15,000 down. Gas meter, water meter and electric meter still on property, Additional structures include 2 sheds, mostly fenced yard. Make this a must see today, covered wrap front porch is perfect feel for old time settings.
-
2025-12-31$39,000 Active 755-char remark
Show marketing remark (755 chars)
This property is perfect for investors or buyers eager to renovate and add value. Key utilities are already in place including sewer, water, electric, and gas meters-making your renovation process that much easier. Inside, you'll find a centrally located kitchen and an oversized full bathroom, offering a flexible layout ready for your personal touch. Enjoy relaxing on the covered front porch or take advantage of the fully fenced lot with ample outdoor space, a storage shed, and an additional outbuilding for all your needs. Seller financing is available with as little as $15,000 down and a 24-month carry making this the ideal opportunity for both first-time buyers and seasoned investors. Ready to make this home your own? Schedule a showing today!
-
1985-09-27soldstatus $31,000
ⓘ Source: listings_history table (triggers on properties + properties_extension) + one-shot
backfill from property_details.listing_events for pre-trigger history.
Tax reassessment forecast CA · Resets to sale price
- Current annual tax
- $381 · $32/mo
- Projected year-2 tax
- $381 · $32/mo
- Expected delta
- $0/yr ($0/mo · 0.0%)
ⓘ Screening estimate from a state-policy table — verify with the county assessor before closing.
Climate risk First Street
- Flood 1/10 Low FEMA zone D · 0% chance over 30 yrs
- Wildfire 2/10 Low
- Heat 8/10 Severe 7 d/yr ≥108°F today · 20 d/yr by 30 yrs out
- Wind 1/10 Low
- Air quality 4/10 Moderate 4 unhealthy d/yr today · 5 by 30 yrs out
Nearby sold comps map
Loading sold comps map…
Walkable amenities ~0.75 mi
Loading nearby amenities…
Taxation est. · year 1
- Rental income
- $8,991
- − Mortgage interest
- −$2,185
- − Property taxes
- −$381
- − Insurance
- −$195
- − Repairs & maintenance
- −$719
- − Management
- −$719
- − Depreciation
- −$1,135
- Taxable income
- $3,657
- Est. tax owed @ 24.0%
- −$878
- After-tax cash flow
- $3,194/yr
For passive investors: Depreciation is non-cash, so a rental often shows a tax loss while cash-flowing — sheltering income. Rental losses are passive: they offset passive income freely, and up to $25,000/yr can offset ordinary (W-2) income if you actively participate and your MAGI is under $100k (phasing out to $0 by $150k); unused losses carry forward. On sale, claimed depreciation is recaptured at up to 25%, and gains may owe capital-gains tax (a 1031 exchange can defer both). Figures are a year-1 estimate at your 24.0% rate — not tax advice; consult a CPA.
Schools (NCES district)
- District
- Trona Joint Unified
- NCES district ID
- 0639840
- Math proficiency
- 25% ▲ 5.00%
- Reading proficiency
- 40% ▲ 5.00%
- Median HH income
- $35,514
- Composite
- 29.6/100
- National rank
- #11751
- State rank
- #1004 of 1400 in CA
Livability — Searles Valley
- Score
- 62/100
- State rank
- #500
- US rank
- #16976
Category grades
Schools grade is shown separately in the Schools card above.
Census & demographics
- Census place
- Searles Valley, CA
- Population (ZIP)
- 1,822
Population outlook (San Bernardino County) Hauer SSP2
- Today (2025)
- 2,300,329 people
- By 2030
- 2,378,907 · +3.4%
- By 2040
- 2,523,137 · +9.7%
- By 2050
- 2,642,388 · +14.9%
- By 2075
- 2,880,769 · +25.2%
- By 2100
- 2,909,436 · +26.5%
Race, ethnicity, and origin ACS 2023
- Neighborhood character
- Predominantly White (65%)
- Race & ethnicity
- White 65% Hispanic / Latino 22% Two or more races 14% Black 2% Native American 2% Asian 1%
- Hispanic origin (detail)
- Mexican 16% Cuban 2%
- Common ancestry
- Italian 6% Slovak 2% Russian 1%
- Foreign-born
- 2% · Canada, China
- Languages at home
- 94% English-only · Spanish 4% Chinese 1%
Political lean MEDSL · San Bernardino
- 2024 margin
- Toss-up / Even · D 47.5% · R 49.7% · Other 2.8%
- 2008→2024 swing
- -8.5pp toward R · 2008: 6.3pp · 2024: -2.1pp
- All cycles
- 2024: R+2.1 2020: D+10.7 2016: D+9.8 2012: D+5.4 2008: D+6.3
Not yet ingested
- Civics
- —
Market trends
- HPI YoY
- —
- Current HPI
- —
- Rent YoY
- —
- Metro
- —
- State GDP YoY
- ▲ 3.21%
- F500 in state
- 116
Industry mix (Fortune 500 HQ in CA)
| Industry | F500 HQs | Revenue |
|---|---|---|
| Technology | 27 | $1,492B |
|
||
| Financial Services | 3 | $174B |
|
||
| Retail | 3 | $44B |
|
||
| Insurance | 3 | $26B |
|
||
| Media / Entertainment | 2 | $115B |
|
||
| Pharmaceuticals / Biotech | 2 | $62B |
|
||
Price history
+25.8% since first listed4 events — show timeline
- 2026-03-08 Relisted — SSMLS
- 2026-02-28 Listed $39,000 GPSMLS
- 2025-12-31 Listed $39,000 SSMLS
- 1985-09-27 Sold (Public Records) $31,000 Public Records
Property tax history
+4.7%/yrLatest (2025): $381 · +1.9% YoY. Source: county tax records.
Cash-flow waterfall
monthlySold comps — $/sqft
last 12 mo · ≤1 miLoading sold comps…