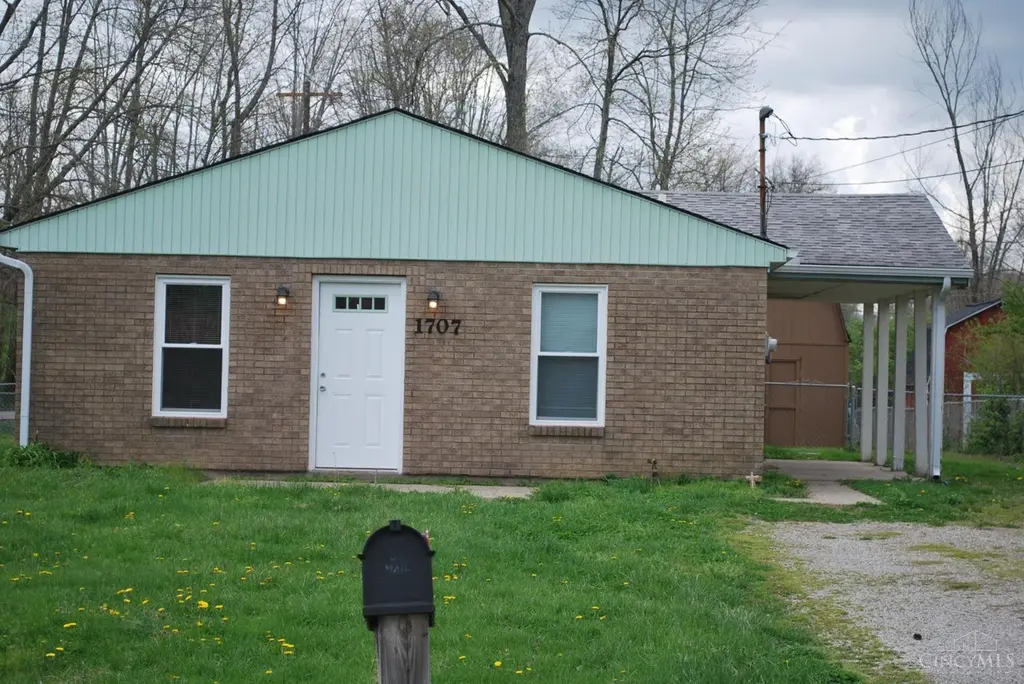
1707 Parker Rd · Mount Repose, OH
Flood risk 1/10 · Minimal
- FEMA flood zone
- X (unshaded)
- Chance of flooding over 30 yrs
- 0.0%
- Est. flood insurance / yr
- $507 – $1,088
Fire risk 1/10 · Minimal
- Est. fire insurance / yr
- $713 – $1,323
Heat risk 4/10 · Minor
- Hot days now (above 102°F)
- 7 days/yr
- Hot days in 30 yrs
- 19 days/yr
Wind risk 2/10 · Minimal
- Chance of severe wind over 30 yrs
- 1.0%
Air-quality risk 3/10 · Minor
- Unhealthy air days now
- 2 days/yr
- Unhealthy air days in 30 yrs
- 5 days/yr
Risk factors via First Street. Map © Google.
Why this score? — see what drove the D- grade
The composite is a weighted blend of 9 inputs, each scored 0–100. Each bar is that input's sub-score; the figure is the points it added to the 100-point composite (weight × sub-score).
- ARV discount +9.7/15.0
- Cash flow +9.3/30.0
- Schools +5.6/10.0
- Livability +3.9/5.0
- Rent growth +2.8/5.0
- DSCR +2.6/10.0
- Condition / age +2.5/5.0
- 1% rule +2.3/10.0
- Appreciation +0.0/10.0
$299,900
🖨 Deal sheet (PDF) 📄 Offer letter ✓ Due diligence
Listing remarks MLS
Property has been recently updated to include windows, carpet, laminate flooring, baths, paint, interior doors, lighting just to name a few. Property has been in the same family for a long time.
Key facts
- Laminate flooring
- Interior doors
- Lighting
Tags
Neighborhood map
What this means for you Summary
Snapshot
- This is a 3-bed/1.5-bath single-family listed at $300k.
Deal economics
- At list price, monthly cash flow is $-218 ($-3k/yr) — negative.
- To cash-flow at today's rent, offer at most $261k (12.9% below list).
- To meet the 1% rule (rent ≥ 1% of price), the offer needs to be $219k (27.1% below list).
- Recommended offer: $219k (27.1% below list) — sets the bar for 1% rule.
- Cap rate 5.4% vs local median 2.8% in Mount Repose — top-decile yield for the area; either an underpriced asset or a hidden risk that comps aren't pricing in. Stress-test before assuming the spread holds.
Location & tenants
- Location reads 78/100 on livability (#177 in OH, #2,752 nationally) — a middle-class / working-renter tenant base. Strengths: crime A+, employment A+, cost of living A+; Watch: amenities F, commute F, health & safety F.
- Goshen Local (rural): math 66% / reading 66% proficiency, ranked #193 of 656 in OH (top 29%) — acceptable for families but not a draw, mixed tenant base, ~2y average lease.
- Zoned schools: Marr/Cook Elementary School (666 students, 35% FRL); Goshen Middle School (math 59% / reading 62%, grade B+, #259 of 654 statewide, top 40%, 688 students, 46% FRL); Goshen High School (math 62% / reading 68%, grade B, #163 of 781 statewide, top 21%, 847 students, 43% FRL).
- Market conditions: Rents rising (+1.1%/yr); 140 active listings in the ZIP; 2 comparable units currently listed for rent nearby; solid renter incomes; 996 units permitted in Clermont County in 2024 (210 in 5+ unit buildings).
Forward outlook
- Local home prices are declining (-3.0%/yr); year-one equity from $2k of loan paydown is wiped out by about $9k of value loss. Plan a longer hold.
Negotiation context
- It's been on market 78 days — a 6% lower offer ($282k) is reasonable based on typical stale-listing flexibility.
- 2 sale attempts since 25y ago with the ask held roughly flat each time — persistent listings suggest the price (not the market) is what's stuck; bring a comps-based counter.
Questions for the listing agent
- What do current leases actually rent for vs. the listed asking? Can we see a recent rent roll and the last 12 months of T-12 income?
- It's been on market 78 days. Have you received any prior offers? Is the seller open to a 27% concession, seller financing, or rate buy-down credit?
- Why hasn't it sold? Are there any deal-killer items the seller is aware of (foundation, flood, title, zoning, code violations)?
- Is there a deadline driving the sale (1031 exchange, divorce, estate, relocation)? That informs how much negotiation room exists.
- Schools are A-rated — typically a magnet for longer-tenancy family renters. What's the average tenant stay here, and is there a school-zone premium baked into asking?
- The area grade is low — what's the realistic commute time and amenity access for the typical tenant pool here? Any planned neighborhood developments (good or bad) we should know about?
- What's the average days-on-market for RENTAL listings here right now (not sales)? A rising rental-DOM trend means longer vacancies and softer asking-rent achievability than the comps imply.
- What's the recent tenant-quality profile in this submarket — average credit score on applications, eviction rate, late-payment / NSF rate, and stable-employment percentage? A property-management company in the area should have these aggregated.
- How much new for-sale + rental construction is in the pipeline within 1–3 miles? Heavy new supply typically softens prices + rents 12–24 months out; constrained supply supports both.
Investment metrics
- 1% rule
- 0.73% ✗
- Cap rate
- 5.42%
- Cash-on-cash
- -3.12%
- DSCR
- 0.86
- GRM
- 11.4
CMA / ARV
- ARV (median comp)
- $315,132
- List price
- $299,900
- Delta
- -4.83%
- Verdict
- FAIR
- Comps
- 20 within 1.0 mi
Show comp detail 12 sales within ~0.75 mi
| Address | Dist | Beds/Ba | Sqft | Sold | Price | $/sf | Match |
|---|---|---|---|---|---|---|---|
| 5877 Rose Ln | 0.12mi | 3/2.0 | 1,243 (-8%) | 10mo | $307,500 | $247 | 70 |
| 5819 Deerfield Rd | 0.34mi | 3/2.0 | 1,467 (+8%) | 8mo | $290,000 | $198 | 61 |
| 1754 Parker Rd | 0.27mi | 3/1.0 | 1,536 (+14%) | 8mo | $115,000 | $75 | 56 |
| 1619 Scenicview Ln Unit 89A | 0.54mi | 2/2.0 (-1) | 1,243 (-8%) | 4mo | $332,557 | $268 | 51 |
| 1627 Scenicview Ln | 0.51mi | 2/2.0 (-1) | 1,243 (-8%) | 6mo | $321,670 | $259 | 51 |
| 1617 Scenicview Ln | 0.55mi | 2/2.0 (-1) | 1,243 (-8%) | 4mo | $316,652 | $255 | 51 |
| 1623 Scenicview Ln | 0.59mi | 2/2.0 (-1) | 1,243 (-8%) | 2mo | $325,000 | $261 | 50 |
| 1625 Scenicview Ln Unit 87-B | 0.52mi | 2/2.0 (-1) | 1,243 (-8%) | 6mo | $318,577 | $256 | 50 |
| 1621 Scenicview Ln | 0.53mi | 2/2.0 (-1) | 1,243 (-8%) | 6mo | $338,900 | $273 | 50 |
| 5801 Parkview Ln Unit 9A | 0.69mi | 2/2.0 (-1) | 1,188 (-12%) | 3mo | $299,000 | $252 | 38 |
| 1855 Parker Rd | 0.65mi | 4/2.0 (+1) | 1,512 (+12%) | 6mo | $247,000 | $163 | 38 |
| 1851 Parker Rd | 0.65mi | 2/2.0 (-1) | 1,178 (-13%) | 9mo | $250,000 | $212 | 34 |
Match score weights: distance 35% · size 25% · config 20% · recency 20%. Top-matched comps best support the ARV.
Projected returns pro-forma
-3.0% appreciation · 1.14% rent growth · sell at horizon
- IRR
- -23.5%
- Equity multiple
- 0.21×
- Total profit
- $-66,574
- Equity at exit
- $44,716
- IRR
- -23.8%
- Equity multiple
- -0.10×
- Total profit
- $-91,952
- Equity at exit
- $25,930
Cash invested: $83,972 (down + closing). Projections, not guarantees.
Landlord ↔ Tenant lean methodology
- Overall (STATE)
- 73 Landlord-Friendly
- State Ohio
- 73 Landlord-Friendly · R+6
- County
- — inherits STATE
- City
- — inherits STATE
ZIP-level market 45150
- Rents YoY
- 1.1%
- Active inventory
- 140
- Price-to-rent
- 11.4×
Monthly cashflow live
- Estimated rent
- $2,186 medium interval (Pro) →
- Mortgage (P&I)
- −$1,573
- Tax from tax record
- −$248 /mo · $2,975/yr
- Insurance
- −$125
- HOA
- −$0
- Vacancy / Maint / Mgmt
- −$459
- Net cashflow
- $-218
Break-even live
Sensitivity live
| Price | -10% $-49 | -5% $-134 | +0% $-218 | +5% $-303 | +10% $-388 |
|---|---|---|---|---|---|
| Rent | -10% $-391 | -5% $-305 | +0% $-218 | +5% $-132 | +10% $-46 |
| Rate | -1.0pp $-67 | -0.5pp $-142 | base $-218 | +0.5pp $-296 | +1.0pp $-375 |
UW: 25.0% down · 7.5% · 30yr · 1.5% tax · 5.0% vac · 8.0% maint · 8.0% mgmt
Financing live
Cash to close
- Down payment
- $74,975
- Closing costs
- $8,997
- Reserves months
- —
- Total cash needed
- —
Loan-product check · same deal, 3 products live
Conventional
25% down · 7.5% · 30yr
- Down + closing
- —
- Monthly P&I
- —
- Monthly cashflow
- —
- DSCR
- —
- Eligible?
- —
Personal DTI + credit; lowest rate.
DSCR
20% down · 8.5% · 30yr
- Down + closing
- —
- Monthly P&I
- —
- Monthly cashflow
- —
- DSCR
- —
- Eligible?
- —
No personal income docs; deal must DSCR.
Hard money
10% down · 12.0% · 12mo
- Down + closing
- —
- Monthly P&I
- —
- Monthly cashflow
- —
- DSCR
- —
- Eligible?
- —
Short-term bridge; refi at stabilization.
Rent comps 2 comps
| Address | Beds | Baths | Sqft | Rent | $/sqft | DOM | Units | Dist |
|---|---|---|---|---|---|---|---|---|
| 1500 Summerview Ln Milford, OH | 3.0 | 2.5 | 1676 | $2,475 | $1.48 | 3d | 1 | 0.63mi |
| 6203 Woodview Dr Goshen, OH | 4.0 | 2.5 | 1840 | $2,531 | $1.38 | 25d | 1 | 1.23mi |
Listing history 17 events
-
2026-06-21days on market $299,900 Active 78 DOM
-
2026-06-18days on market $299,900 Active 75 DOM
-
2026-06-17days on market $299,900 Active 74 DOM
-
2026-06-16days on market $299,900 Active 73 DOM
-
2026-06-15days on market $299,900 Active 72 DOM
-
2026-06-13days on market $299,900 Active 70 DOM
-
2026-06-09days on market $299,900 Active 66 DOM
-
2026-06-08days on market $299,900 Active 65 DOM
-
2026-06-07days on market $299,900 Active 64 DOM
-
2026-06-05days on market $299,900 Active 61 DOM
-
2026-06-03days on market $299,900 Active 60 DOM
-
2026-06-02days on market $299,900 Active 59 DOM
-
2026-06-01days on market $299,900 Active 58 DOM
-
2026-05-31days on market $299,900 Active 57 DOM
-
2026-04-01$299,900 Active 194-char remark
Show marketing remark (194 chars)
Property has been recently updated to include windows, carpet, laminate flooring, baths, paint, interior doors, lighting just to name a few. Property has been in the same family for a long time.
-
2002-07-02historical
-
2001-09-14$109,900
ⓘ Source: listings_history table (triggers on properties + properties_extension) + one-shot
backfill from property_details.listing_events for pre-trigger history.
Tax reassessment forecast OH · Partial reset (capped growth)
- Current annual tax
- $2,975 · $248/mo
- Projected year-2 tax
- $3,827 · $319/mo
- Expected delta
- +$852/yr (+$71/mo · 28.6%)
ⓘ Screening estimate from a state-policy table — verify with the county assessor before closing.
Climate risk First Street
- Flood 1/10 Low FEMA zone X (unshaded) · 0% chance over 30 yrs
- Wildfire 1/10 Low
- Heat 4/10 Moderate 7 d/yr ≥102°F today · 19 d/yr by 30 yrs out
- Wind 2/10 Low 100% chance of damaging wind over 30 yrs
- Air quality 3/10 Moderate 2 unhealthy d/yr today · 5 by 30 yrs out
Nearby sold comps map
Loading sold comps map…
Walkable amenities ~0.75 mi
Loading nearby amenities…
Taxation est. · year 1
- Rental income
- $26,234
- − Mortgage interest
- −$16,799
- − Property taxes
- −$2,975
- − Insurance
- −$1,500
- − Repairs & maintenance
- −$2,099
- − Management
- −$2,099
- − Depreciation
- −$8,724
- Taxable loss
- −$7,961
- Est. tax savings @ 24.0%
- +$1,911
- After-tax cash flow
- $-711/yr
For passive investors: Depreciation is non-cash, so a rental often shows a tax loss while cash-flowing — sheltering income. Rental losses are passive: they offset passive income freely, and up to $25,000/yr can offset ordinary (W-2) income if you actively participate and your MAGI is under $100k (phasing out to $0 by $150k); unused losses carry forward. On sale, claimed depreciation is recaptured at up to 25%, and gains may owe capital-gains tax (a 1031 exchange can defer both). Figures are a year-1 estimate at your 24.0% rate — not tax advice; consult a CPA.
Schools (NCES district)
- District
- Goshen Local
- NCES district ID
- 3904634
- Math proficiency
- 66% ▼ -7.00%
- Reading proficiency
- 66% ▼ -6.00%
- Median HH income
- $53,709
- Composite
- 56.41/100
- National rank
- #1159
- State rank
- #193 of 656 in OH
Livability — Mount Repose
- Score
- 78/100
- State rank
- #177
- US rank
- #2752
Category grades
Schools grade is shown separately in the Schools card above.
Census & demographics
- County
- Clermont County · 173,169 people
- Metro
- Cincinnati, OH-KY-IN
- Population (ZIP)
- 33,527
- Household income
- $93,595
- Rent vs Own
- Severe rent burden
- 740.0
Population outlook (Clermont County) Hauer SSP2
- Today (2025)
- 210,162 people
- By 2030
- 212,463 · +1.1%
- By 2040
- 212,504 · +1.1%
- By 2050
- 205,957 · -2.0%
- By 2075
- 182,728 · -13.1%
- By 2100
- 143,986 · -31.5%
Race, ethnicity, and origin ACS 2023
- Neighborhood character
- Predominantly White (91%)
- Race & ethnicity
- White 91% Two or more races 3% Hispanic / Latino 2% Black 2% Asian 1%
- Common ancestry
- Slovak 3% Italian 2% Lithuanian 2%
- Foreign-born
- 2% · Canada, China
- Languages at home
- 97% English-only · Spanish 1% Chinese 1%
Political lean MEDSL · Clermont
- 2024 margin
- Solid R (+35.8) · D 31.7% · R 67.4%
- 2008→2024 swing
- -3.4pp toward R · 2008: -32.4pp · 2024: -35.8pp
- All cycles
- 2024: R+35.8 2020: R+36.6 2016: R+41.3 2012: R+35.5 2008: R+32.4
Not yet ingested
- Civics
- —
Market trends
- HPI YoY
- ▼ -242.84%
- Current HPI
- 249.5564
- Rent YoY
- ▲ 1.14%
- Metro
- Cincinnati, OH-KY-IN
- State GDP YoY
- ▲ 1.98%
- F500 in state
- 48
Industry mix (Fortune 500 HQ in OH)
| Industry | F500 HQs | Revenue |
|---|---|---|
| Insurance | 3 | $145B |
|
||
| Industrial Machinery | 3 | $49B |
|
||
| Financial Services | 3 | $24B |
|
||
| Consumer Goods | 2 | $93B |
|
||
| Aerospace / Defense | 2 | $47B |
|
||
| Utilities | 2 | $33B |
|
||
Price history
+172.9% since first listed3 events — show timeline
- 2026-04-01 Listed $299,900 Cincy MLS
- 2002-07-02 Listing Removed — Cincy MLS
- 2001-09-14 Listed $109,900 Cincy MLS
Property tax history
+5.0%/yrLatest (2025): $2,975 · -0.3% YoY. Source: county tax records.
Cash-flow waterfall
monthlySold comps — $/sqft
last 12 mo · ≤1 miLoading sold comps…