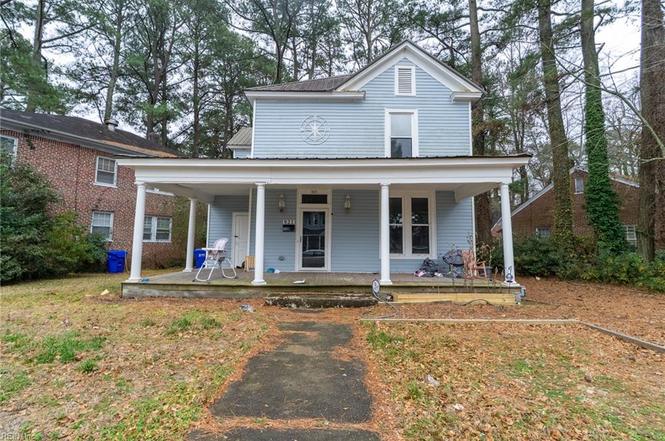
921 Howard Pl · Suffolk, VA
Flood risk 1/10 · Minimal
- FEMA flood zone
- X (unshaded)
- Chance of flooding over 30 yrs
- 0.0%
- Est. flood insurance / yr
- $507 – $1,088
Fire risk 3/10 · Minor
- Est. fire insurance / yr
- $666 – $1,236
Heat risk 8/10 · Major
- Hot days now (above 109°F)
- 7 days/yr
- Hot days in 30 yrs
- 16 days/yr
Wind risk 8/10 · Major
- Chance of severe wind over 30 yrs
- 80.0%
Air-quality risk 2/10 · Minimal
- Unhealthy air days now
- 0 days/yr
- Unhealthy air days in 30 yrs
- 1 days/yr
Risk factors via First Street. Map © Google.
Why this score? — see what drove the B grade
The composite is a weighted blend of 9 inputs, each scored 0–100. Each bar is that input's sub-score; the figure is the points it added to the 100-point composite (weight × sub-score).
- Cash flow +25.7/30.0
- ARV discount +15.0/15.0
- DSCR +8.6/10.0
- 1% rule +6.5/10.0
- Schools +4.8/10.0
- Rent growth +4.0/5.0
- Livability +3.9/5.0
- Condition / age +2.5/5.0
- Appreciation +0.0/10.0
$225,000
🖨 Deal sheet 📄 Offer letter ✓ Due diligence
Listing remarks
Welcome to this charming 4-bedroom, 3-bath home located in the heart of Suffolk! Boasting over 2,000 sq ft of living space, this beautifully maintained property combines classic1920's character with modern comfort. Step inside to find spacious rooms, LVP flooring, and abundant natural light throughout. The inviting living area and formal dining room are great for gatherings , while the well-appointed kitchen offers plenty of workspace and storage. Upstairs, generously sized bedrooms provide flexibility for guests, home office, or hobbies, The primary suite includes ample closet space and an updated bathroom with double vanities. Enjoy relaxing on the covered front porch or entertaining in t
Key facts
- Covered front porch
- Updated bathroom
- Built 1927
Tags
Neighborhood map
What this means for you Summary
Snapshot
- This is a 4-bed/3.0-bath single-family listed at $225k.
Deal economics
- At list price, monthly cash flow is $539 ($6k/yr) — positive.
- The deal already cash-flows at list — no discount required.
- Meets the 1% rule at list price ($3k rent vs $225k).
- Cap rate 9.2% vs local median 3.5% in Suffolk — top-decile yield for the area; either an underpriced asset or a hidden risk that comps aren't pricing in. Stress-test before assuming the spread holds.
Location & tenants
- Location reads 77/100 on livability (#88 in VA, #2,896 nationally) — a middle-class / working-renter tenant base. Strengths: housing A+, health & safety A+, employment A-; Watch: crime C-, commute F.
- Suffolk City Public School District (suburban): math 41% / reading 69% proficiency, ranked #72 of 131 in VA (top 55%) — acceptable for families but not a draw, mixed tenant base, ~2y average lease.
- Zoned schools: Elephant'S Fork Elementary (math 39% / reading 57%, grade D, #787 of 1,108 statewide, top 72%, 599 students, 65% FRL); King'S Fork High (math 44% / reading 77%, grade C+, #244 of 319 statewide, top 77%, 1,697 students, 63% FRL) — zoned schools average 64% FRL vs 39% district-wide (25 pts higher); higher-poverty schools than district average — tighter screening recommended.
- Market conditions: Rents rising fast (+5.8%/yr); 536 active listings in the ZIP; 5 comparable units currently listed for rent nearby; rentals at typical pace (median 24d on market — plan ~3-4 weeks tenant-placement turnaround); 40% of comp listings sitting > 30 days — soft ceiling on asking rent; solid renter incomes; 680 units permitted in Suffolk city in 2024 (0 in 5+ unit buildings).
- This rent runs 39% of the median local income ($80k/yr) — at the standard rent-burdened threshold; future hikes will face affordability resistance.
Forward outlook
- Local home prices are declining (-3.0%/yr); year-one equity from $2k of loan paydown is wiped out by about $7k of value loss. Plan a longer hold.
- Suffolk County population projected at +11% by 2050 — modest demand growth; plan on rents tracking national, not racing it.
- At projected returns (-3.0% appreciation + 5.8% rent growth), your $63k cash investment doubles in ~9 years — after that, you're playing with house money.
Negotiation context
- Only 14 days on market — expect competitive offers; lowballing is unlikely to land.
- 14 sale attempts since 8y ago; this cycle's ask has dropped $75k (25%) from the opening price — seller is motivated, your offer sets the floor, not the list.
Risks & watch-outs
- Watch-outs: built in 1927 — expect roof / HVAC / electrical / plumbing capex.
- Climate carrying-cost: severe wind risk, 80% chance of damaging wind over 30y; extreme-heat days projected 7→16/yr by 2055 (HVAC capex compounding) — expect insurance premiums to compound above CPI over the hold.
Questions for the listing agent
- Built in 1927 — when were the roof, HVAC, electrical panel, plumbing, and water heater last replaced?
- Is there a deadline driving the sale (1031 exchange, divorce, estate, relocation)? That informs how much negotiation room exists.
- Schools are A-rated — typically a magnet for longer-tenancy family renters. What's the average tenant stay here, and is there a school-zone premium baked into asking?
- What's the average days-on-market for RENTAL listings here right now (not sales)? A rising rental-DOM trend means longer vacancies and softer asking-rent achievability than the comps imply.
- What's the recent tenant-quality profile in this submarket — average credit score on applications, eviction rate, late-payment / NSF rate, and stable-employment percentage? A property-management company in the area should have these aggregated.
- How much new for-sale + rental construction is in the pipeline within 1–3 miles? Heavy new supply typically softens prices + rents 12–24 months out; constrained supply supports both.
Investment metrics
- 1% rule
- 1.15% ✓
- Cap rate
- 9.17%
- Cash-on-cash
- 10.27%
- DSCR
- 1.46
- GRM
- 7.3
CMA / ARV
- ARV (on-the-fly)
- $363,088
- Comps found
- 12
Show comp detail 12 sales within ~0.75 mi
| Address | Dist | Beds/Ba | Sqft | Sold | Price | $/sf | Match |
|---|---|---|---|---|---|---|---|
| 909 Howard Pl | 0.05mi | 3/2.0 (-1) | 1,892 (-8%) | 2mo | $348,400 | $184 | 74 |
| 916 Delaware Ave | 0.25mi | 4/2.5 | 1,940 (-6%) | 4mo | $339,900 | $175 | 73 |
| 1025 Pennsylvania Ave | 0.26mi | 3/2.5 (-1) | 2,000 (-3%) | 8mo | $305,000 | $153 | 70 |
| 118 S Broad St | 0.30mi | 5/3.0 (+1) | 2,256 (+9%) | 4mo | $350,000 | $155 | 62 |
| 118 Saint James Ave | 0.43mi | 3/2.5 (-1) | 2,264 (+10%) | 0mo | $310,000 | $137 | 56 |
| 707 Ashley Ave | 0.47mi | 4/2.5 | 1,850 (-10%) | 5mo | $340,000 | $184 | 55 |
| 603 Azalea Ct | 0.55mi | 3/2.0 (-1) | 1,984 (-4%) | 6mo | $440,000 | $222 | 54 |
| 410 Smith St | 0.60mi | 4/3.5 | 2,167 (+5%) | 9mo | $310,000 | $143 | 54 |
| 407 Park Rd | 0.20mi | 5/2.5 (+1) | 2,362 (+14%) | 8mo | $405,000 | $171 | 53 |
| 608 Ashley Ave | 0.50mi | 4/3.5 | 1,764 (-14%) | 5mo | $375,000 | $213 | 46 |
| 509 Pitchkettle Rd | 0.46mi | 3/2.5 (-1) | 1,760 (-15%) | 3mo | $310,000 | $176 | 45 |
| 406 St James Ave | 0.49mi | 3/2.5 (-1) | 1,760 (-15%) | 5mo | $309,900 | $176 | 42 |
Match score weights: distance 35% · size 25% · config 20% · recency 20%. Top-matched comps best support the ARV.
Projected returns pro-forma
-3.0% appreciation · 5.84% rent growth · sell at horizon
- IRR
- 2.2%
- Equity multiple
- 1.09×
- Total profit
- $5,450
- Equity at exit
- $33,548
- IRR
- 14.3%
- Equity multiple
- 2.30×
- Total profit
- $81,929
- Equity at exit
- $19,454
Cash invested: $63,000 (down + closing). Projections, not guarantees.
Landlord ↔ Tenant lean methodology
- Overall (STATE)
- 55 Moderately Landlord-Leaning
- State Virginia
- 55 Moderately Landlord-Leaning · D+2
- County
- — inherits STATE
- City
- — inherits STATE
ZIP-level market 23434
- Rents YoY
- 5.8%
- Active inventory
- 536
- Price-to-rent
- 7.3×
Monthly cashflow live
- Estimated rent
- $2,579 high interval (Pro) →
- Mortgage (P&I)
- −$1,180
- Tax from tax record
- −$225 /mo · $2,696/yr
- Insurance
- −$94
- HOA
- −$0
- Vacancy / Maint / Mgmt
- −$542
- Net cashflow
- $539
Break-even live
UW: 25.0% down · 7.5% · 30yr · 1.5% tax · 5.0% vac · 8.0% maint · 8.0% mgmt
Financing live
Cash to close
- Down payment
- $56,250
- Closing costs
- $6,750
- Reserves months
- —
- Total cash needed
- —
Loan-product check · same deal, 3 products live
Conventional
25% down · 7.5% · 30yr
- Down + closing
- —
- Monthly P&I
- —
- Monthly cashflow
- —
- DSCR
- —
- Eligible?
- —
Personal DTI + credit; lowest rate.
DSCR
20% down · 8.5% · 30yr
- Down + closing
- —
- Monthly P&I
- —
- Monthly cashflow
- —
- DSCR
- —
- Eligible?
- —
No personal income docs; deal must DSCR.
Hard money
10% down · 12.0% · 12mo
- Down + closing
- —
- Monthly P&I
- —
- Monthly cashflow
- —
- DSCR
- —
- Eligible?
- —
Short-term bridge; refi at stabilization.
Rent comps 5 comps
| Address | Beds | Baths | Sqft | Rent | $/sqft | DOM | Units | Dist |
|---|---|---|---|---|---|---|---|---|
| 808 Gittings St Suffolk, VA | 4.0 | 2.5 | 2187 | $2,500 | $1.14 | 23d | 1 | 0.13mi |
| 124 Linden Ave Suffolk, VA | 4.0 | 2.5 | 2568 | $2,795 | $1.09 | 43d | 1 | 0.38mi |
| 525 Kilby Ave Suffolk, VA | 3.0 | 2.5 | 1776 | $2,500 | $1.41 | 23d | 1 | 0.69mi |
| 621 Butler Ave Suffolk, VA | 3.0 | 2.5 | 1760 | $2,500 | $1.42 | 23d | 1 | 0.86mi |
| 131 Brookside Ln Suffolk, VA | 4.0 | 2.5 | 2005 | $2,800 | $1.40 | 43d | 1 | 1.09mi |
Listing history 41 events
-
2026-01-27price $225,000
-
2026-01-20price $250,000
-
2026-01-13price $275,000
-
2026-01-12status Under Contract
-
2025-12-29$300,000 Active
-
2025-12-24historical
-
2025-11-05$350,000 Active
-
2024-08-30soldstatus $290,000
-
2024-08-07status Under Contract
-
2024-07-29historical Active Under Contract
-
2024-07-15price $289,000
-
2024-06-20$289,900 Active
-
2024-06-19historical
-
2024-06-17historical $2,395
-
2024-06-15$2,395
-
2024-06-08historical $2,395
-
2024-06-06$2,395
-
2024-05-22price $299,900
-
2024-05-01price $318,000
-
2024-04-18$319,900 Active
-
2024-04-09historical
-
2024-03-29price $324,500
-
2024-02-07$325,000 Active
-
2023-12-06historical
-
2023-10-30price $325,000
-
2023-10-19status Active
-
2023-10-17historical
-
2023-10-06$345,000 Active
-
2023-03-23soldstatus $160,000
-
2023-03-04status Under Contract
-
2023-02-25historical Active Under Contract
-
2023-01-28status Active
-
2023-01-24status Active Under Contract
-
2023-01-24historical
-
2023-01-24historical Active Under Contract
-
2023-01-17$200,000 Active
-
2022-12-06historical
-
2022-10-28$200,000 Active
-
2018-02-13status Under Contract
-
2018-01-12$35,000 Active
-
2006-12-11soldstatus $170,000
ⓘ Source: listings_history table (triggers on properties + properties_extension) + one-shot
backfill from property_details.listing_events for pre-trigger history.
Tax reassessment forecast VA · Resets to sale price
- Current annual tax
- $2,696 · $225/mo
- Projected year-2 tax
- $2,696 · $225/mo
- Expected delta
- $0/yr ($0/mo · 0.0%)
ⓘ Screening estimate from a state-policy table — verify with the county assessor before closing.
Climate risk First Street
- Flood 1/10 Low FEMA zone X (unshaded) · 0% chance over 30 yrs
- Wildfire 3/10 Moderate
- Heat 8/10 Severe 7 d/yr ≥109°F today · 16 d/yr by 30 yrs out
- Wind 8/10 Severe 80% chance of damaging wind over 30 yrs
- Air quality 2/10 Low 0 unhealthy d/yr today · 1 by 30 yrs out
Nearby sold comps map
Loading sold comps map…
Walkable amenities ~0.75 mi
Loading nearby amenities…
Taxation est. · year 1
- Rental income
- $30,947
- − Mortgage interest
- −$12,603
- − Property taxes
- −$2,696
- − Insurance
- −$1,125
- − Repairs & maintenance
- −$2,476
- − Management
- −$2,476
- − Depreciation
- −$6,545
- Taxable income
- $3,025
- Est. tax owed @ 24.0%
- −$726
- After-tax cash flow
- $5,742/yr
For passive investors: Depreciation is non-cash, so a rental often shows a tax loss while cash-flowing — sheltering income. Rental losses are passive: they offset passive income freely, and up to $25,000/yr can offset ordinary (W-2) income if you actively participate and your MAGI is under $100k (phasing out to $0 by $150k); unused losses carry forward. On sale, claimed depreciation is recaptured at up to 25%, and gains may owe capital-gains tax (a 1031 exchange can defer both). Figures are a year-1 estimate at your 24.0% rate — not tax advice; consult a CPA.
Schools (NCES district)
- District
- Suffolk City Public School District
- NCES district ID
- 5103710
- Math proficiency
- 41% ▼ -43.00%
- Reading proficiency
- 69% ▼ -8.00%
- Median HH income
- $65,573
- Composite
- 48.31/100
- National rank
- #2151
- State rank
- #72 of 131 in VA
Livability — Suffolk
- Score
- 77/100
- State rank
- #88
- US rank
- #2896
Category grades
Schools grade is shown separately in the Schools card above.
Census & demographics
- Census place
- Suffolk, VA
- County
- Suffolk City · 88,108 people
- City population
- 88,108
- Metro
- Virginia Beach-Norfolk-Newport News, VA-NC
- Population (ZIP)
- 54,387
- Household income
- $79,877
- Rent vs Own
- Severe rent burden
- 1934.0
Population outlook (Suffolk County) Hauer SSP2
- Today (2025)
- 95,269 people
- By 2030
- 98,269 · +3.1%
- By 2040
- 103,177 · +8.3%
- By 2050
- 105,777 · +11.0%
- By 2075
- 110,963 · +16.5%
- By 2100
- 103,711 · +8.9%
Race, ethnicity, and origin ACS 2023
- Neighborhood character
- Diverse neighborhood (Simpson 0.58)
- Race & ethnicity
- Black 49% White 41% Two or more races 5% Hispanic / Latino 4% Asian 1%
- Common ancestry
- Lithuanian 1% Slovak 1% Italian 1%
- Foreign-born
- 3% · Canada
- Languages at home
- 96% English-only · Spanish 2%
Political lean MEDSL · Suffolk
- 2024 margin
- D (+15.9) · D 57.4% · R 41.5% · Other 1.2%
- 2008→2024 swing
- +2.7pp toward D · 2008: 13.2pp · 2024: 15.9pp
- All cycles
- 2024: D+15.9 2020: D+17.3 2016: D+13.8 2012: D+15.1 2008: D+13.2
Not yet ingested
- Civics
- —
Market trends
- HPI YoY
- ▼ -383.80%
- Current HPI
- 158.5866
- Rent YoY
- ▲ 5.84%
- Metro
- Virginia Beach-Norfolk-Newport News, VA-NC
- State GDP YoY
- ▲ 2.40%
- F500 in state
- 50
Industry mix (Fortune 500 HQ in VA)
| Industry | F500 HQs | Revenue |
|---|---|---|
| Aerospace / Defense | 4 | $236B |
|
||
| Technology / Defense | 3 | $32B |
|
||
| Financial Services | 2 | $176B |
|
||
| Utilities | 2 | $27B |
|
||
| Insurance | 2 | $25B |
|
||
| Technology | 2 | $15B |
|
||
Price history
+32.4% since first listed41 events — show timeline
- 2026-01-27 Price Changed $225,000 REINMLS
- 2026-01-20 Price Changed $250,000 REINMLS
- 2026-01-13 Price Changed $275,000 REINMLS
- 2026-01-12 Pending — REINMLS
- 2025-12-29 Listed $300,000 REINMLS
- 2025-12-24 Listing Removed — REINMLS
- 2025-11-05 Listed $350,000 REINMLS
- 2024-08-30 Sold (Public Records) $290,000 Public Records
- 2024-08-07 Pending — REINMLS
- 2024-07-29 Contingent — REINMLS
- 2024-07-15 Price Changed $289,000 REINMLS
- 2024-06-20 Listed $289,900 REINMLS
- 2024-06-19 Listing Removed — REINMLS
- 2024-06-17 Rental Removed $2,395 REINMLS
- 2024-06-15 Listed for Rent $2,395 REINMLS
- 2024-06-08 Rental Removed $2,395 REINMLS
- 2024-06-06 Listed for Rent $2,395 REINMLS
- 2024-05-22 Price Changed $299,900 REINMLS
- 2024-05-01 Price Changed $318,000 REINMLS
- 2024-04-18 Listed $319,900 REINMLS
- 2024-04-09 Listing Removed — REINMLS
- 2024-03-29 Price Changed $324,500 REINMLS
- 2024-02-07 Listed $325,000 REINMLS
- 2023-12-06 Listing Removed — REINMLS
- 2023-10-30 Price Changed $325,000 REINMLS
- 2023-10-19 Relisted — REINMLS
- 2023-10-17 Listing Removed — REINMLS
- 2023-10-06 Listed $345,000 REINMLS
- 2023-03-23 Sold (Public Records) $160,000 Public Records
- 2023-03-04 Pending — REINMLS
- 2023-02-25 Contingent — REINMLS
- 2023-01-28 Relisted — REINMLS
- 2023-01-24 Relisted — REINMLS
- 2023-01-24 Listing Removed — REINMLS
- 2023-01-24 Contingent — REINMLS
- 2023-01-17 Listed $200,000 REINMLS
- 2022-12-06 Listing Removed — REINMLS
- 2022-10-28 Listed $200,000 REINMLS
- 2018-02-13 Pending — REINMLS
- 2018-01-12 Listed $35,000 REINMLS
- 2006-12-11 Sold (Public Records) $170,000 Public Records
Property tax history
+2.0%/yrLatest (2025): $2,696 · +48.2% YoY. Source: county tax records.
Cash-flow waterfall
monthlySold comps — $/sqft
last 12 mo · ≤1 miLoading sold comps…