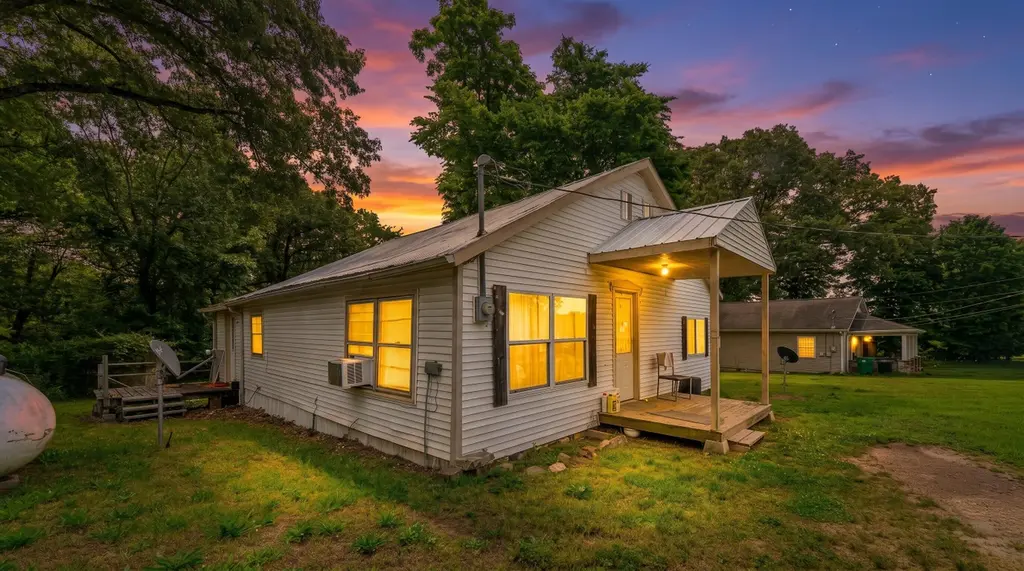
208 Sherman St · Thayer, MO
Flood risk 1/10 · Minimal
- FEMA flood zone
- X (unshaded)
- Chance of flooding over 30 yrs
- 0.0%
- Est. flood insurance / yr
- $507 – $1,088
Fire risk 5/10 · Moderate
- Est. fire insurance / yr
- $1,054 – $1,958
Heat risk 5/10 · Moderate
- Hot days now (above 107°F)
- 7 days/yr
- Hot days in 30 yrs
- 20 days/yr
Wind risk 2/10 · Minimal
- Chance of severe wind over 30 yrs
- 3.0%
Air-quality risk 1/10 · Minimal
- Unhealthy air days now
- 0 days/yr
- Unhealthy air days in 30 yrs
- 0 days/yr
Risk factors via First Street. Map © Google.
Why this score? — see what drove the B- grade
The composite is a weighted blend of 9 inputs, each scored 0–100. Each bar is that input's sub-score; the figure is the points it added to the 100-point composite (weight × sub-score).
- Cash flow +30.0/30.0
- 1% rule +10.0/10.0
- DSCR +10.0/10.0
- ARV discount +7.5/15.0
- Schools +4.2/10.0
- Livability +3.0/5.0
- Rent growth +2.5/5.0
- Condition / age +2.5/5.0
- Appreciation +0.0/10.0
$59,900
🖨 Deal sheet (PDF) 📄 Offer letter ✓ Due diligence
Listing remarks
Investment Opportunity in Thayer, Missouri | Fixer Upper with Bonus Room Near Outdoor RecreationOpportunity awaits with this fixer-upper home located in the heart of Thayer, Missouri. Whether you are looking for your next investment property, rental opportunity, starter home project, or affordable place to make your own, this property offers solid potential in a convenient Ozarks location. Featuring 2 bedrooms, 2 bathrooms, and an additional bonus room that could serve as an office, hobby space, guest room, or extra storage area, the home provides a flexible layout with room to add value and personal touches. The exterior features a durable metal roof and a small side deck, creating a funct
Key facts
- Metal roof
- Bonus room
- Outdoor space
Tags
Property features AI
Exterior
- Parking: Driveway
- Utilities: Public water; Public sewer; Propane service
- Home design: Single-family residence; One level
- Construction: Vinyl siding; Metal roof
- Exterior features: Side porch; Shed(s); Property has a view; Sloped and level areas on the lot; Asphalt road frontage on a public maintained city street
Interior
- Flooring: Vinyl
- Bathrooms: 2 full bathrooms
- Heating & cooling: Central heating; Propane heating available; Central air conditioning
- Interior features: Vinyl flooring; Main-level laundry
- Laundry & utility: Laundry on the main level
Neighborhood map
What this means for you Summary
Snapshot
- This is a 3-bed/1.0-bath other listed at $60k.
Deal economics
- At list price, monthly cash flow is $444 ($5k/yr) — positive.
- The deal already cash-flows at list — no discount required.
- Meets the 1% rule at list price ($1k rent vs $60k).
- Recommended offer: $59k (1.5% below list) — sets the bar for market timing.
- Cap rate 15.2% vs local median 4.1% in Thayer — top-decile yield for the area; either an underpriced asset or a hidden risk that comps aren't pricing in. Stress-test before assuming the spread holds.
Location & tenants
- Location reads 59/100 on livability (#530 in MO) — a working-class tenant base; expect higher turnover. Strengths: crime A+, cost of living A+, housing A+; Watch: amenities F, commute F, employment F.
- Thayer R-II (rural): math 51% / reading 52% proficiency, ranked #42 of 324 in MO (top 13%) — acceptable for families but not a draw, mixed tenant base, ~2y average lease.
- Zoned schools: Thayer Elem. (math 62% / reading 57%, grade B-, #124 of 1,115 statewide, top 13%, 419 students, 62% FRL); Thayer Sr. High (math 42% / reading 47%, grade F, #179 of 521 statewide, top 39%, 343 students, 50% FRL).
- Market conditions: 59 active listings in the ZIP; 5 units permitted in Oregon County in 2024 (0 in 5+ unit buildings).
Forward outlook
- Local home prices are declining (-3.0%/yr); year-one equity from $414 of loan paydown is wiped out by about $2k of value loss. Plan a longer hold.
- Oregon County population projected at -12% by 2050 — secular population decline; favor cash flow + early exit over multi-decade hold.
- At projected returns (-3.0% appreciation + 3.0% rent growth), your $17k cash investment doubles in ~4 years — after that, you're playing with house money.
Negotiation context
- It's been on market 25 days — a 2% lower offer ($59k) is reasonable based on typical stale-listing flexibility.
Risks & watch-outs
- Watch-outs: built in 1930 — expect roof / HVAC / electrical / plumbing capex.
- Climate carrying-cost: moderate wildfire risk; extreme-heat days projected 7→20/yr by 2055 (HVAC capex compounding) — expect insurance premiums to compound above CPI over the hold.
Questions for the listing agent
- Built in 1930 — when were the roof, HVAC, electrical panel, plumbing, and water heater last replaced?
- Is there a deadline driving the sale (1031 exchange, divorce, estate, relocation)? That informs how much negotiation room exists.
- What's the average days-on-market for RENTAL listings here right now (not sales)? A rising rental-DOM trend means longer vacancies and softer asking-rent achievability than the comps imply.
- What's the recent tenant-quality profile in this submarket — average credit score on applications, eviction rate, late-payment / NSF rate, and stable-employment percentage? A property-management company in the area should have these aggregated.
- How much new for-sale + rental construction is in the pipeline within 1–3 miles? Heavy new supply typically softens prices + rents 12–24 months out; constrained supply supports both.
Investment metrics
- 1% rule
- 1.68% ✓
- Cap rate
- 15.18%
- Cash-on-cash
- 31.74%
- DSCR
- 2.41
- GRM
- 5.0
CMA / ARV
No comps found within radius.
Projected returns pro-forma
-3.0% appreciation · 3.0% rent growth · sell at horizon
- IRR
- 26.6%
- Equity multiple
- 2.10×
- Total profit
- $18,524
- Equity at exit
- $8,931
- IRR
- 34.2%
- Equity multiple
- 4.13×
- Total profit
- $52,416
- Equity at exit
- $5,179
Cash invested: $16,772 (down + closing). Projections, not guarantees.
Landlord ↔ Tenant lean methodology
- Overall (STATE)
- 81 Strongly Landlord-Friendly
- State Missouri
- 81 Strongly Landlord-Friendly · R+10
- County
- — inherits STATE
- City
- — inherits STATE
ZIP-level market 65791
- Home prices YoY
- -10.5%
- Active inventory
- 59
- Price-to-rent
- 5.0×
Monthly cashflow live
- Estimated rent
- $1,007 medium interval (Pro) →
- Mortgage (P&I)
- −$314
- Tax from tax record
- −$13 /mo · $151/yr
- Insurance
- −$25
- HOA
- −$0
- Vacancy / Maint / Mgmt
- −$211
- Net cashflow
- $444
Break-even live
Sensitivity live
| Price | -10% $478 | -5% $461 | +0% $444 | +5% $427 | +10% $410 |
|---|---|---|---|---|---|
| Rent | -10% $364 | -5% $404 | +0% $444 | +5% $483 | +10% $523 |
| Rate | -1.0pp $474 | -0.5pp $459 | base $444 | +0.5pp $428 | +1.0pp $412 |
UW: 25.0% down · 7.5% · 30yr · 1.5% tax · 5.0% vac · 8.0% maint · 8.0% mgmt
Financing live
Cash to close
- Down payment
- $14,975
- Closing costs
- $1,797
- Reserves months
- —
- Total cash needed
- —
Loan-product check · same deal, 3 products live
Conventional
25% down · 7.5% · 30yr
- Down + closing
- —
- Monthly P&I
- —
- Monthly cashflow
- —
- DSCR
- —
- Eligible?
- —
Personal DTI + credit; lowest rate.
DSCR
20% down · 8.5% · 30yr
- Down + closing
- —
- Monthly P&I
- —
- Monthly cashflow
- —
- DSCR
- —
- Eligible?
- —
No personal income docs; deal must DSCR.
Hard money
10% down · 12.0% · 12mo
- Down + closing
- —
- Monthly P&I
- —
- Monthly cashflow
- —
- DSCR
- —
- Eligible?
- —
Short-term bridge; refi at stabilization.
Listing history 17 events
-
2026-06-21days on market $59,900 Active 25 DOM
-
2026-06-21days on market $59,900 Active 24 DOM
-
2026-06-18days on market $59,900 Active 22 DOM
-
2026-06-17days on market $59,900 Active 21 DOM
-
2026-06-16days on market $59,900 Active 20 DOM
-
2026-06-15days on market $59,900 Active 19 DOM
-
2026-06-13days on market $59,900 Active 17 DOM
-
2026-06-12days on market $59,900 Active 16 DOM
-
2026-06-09days on market $59,900 Active 13 DOM
-
2026-06-08days on market $59,900 Active 12 DOM
-
2026-06-07days on market $59,900 Active 11 DOM
-
2026-06-07days on market $59,900 Active 10 DOM
-
2026-06-04days on market $59,900 Active 7 DOM
-
2026-06-02days on market $59,900 Active 6 DOM
-
2026-06-01days on market $59,900 Active 5 DOM
-
2026-05-31days on market $59,900 Active 4 DOM
-
2026-05-27$59,900 Active
ⓘ Source: listings_history table (triggers on properties + properties_extension) + one-shot
backfill from property_details.listing_events for pre-trigger history.
Tax reassessment forecast MO · Resets to sale price
- Current annual tax
- $151 · $13/mo
- Projected year-2 tax
- $581 · $48/mo
- Expected delta
- +$430/yr (+$36/mo · 284.8%)
ⓘ Screening estimate from a state-policy table — verify with the county assessor before closing.
Climate risk First Street
- Flood 1/10 Low FEMA zone X (unshaded) · 0% chance over 30 yrs
- Wildfire 5/10 Major
- Heat 5/10 Major 7 d/yr ≥107°F today · 20 d/yr by 30 yrs out
- Wind 2/10 Low 3% chance of damaging wind over 30 yrs
- Air quality 1/10 Low 0 unhealthy d/yr today · 0 by 30 yrs out
Nearby sold comps map
Loading sold comps map…
Walkable amenities ~0.75 mi
Loading nearby amenities…
Taxation est. · year 1
- Rental income
- $12,080
- − Mortgage interest
- −$3,355
- − Property taxes
- −$151
- − Insurance
- −$300
- − Repairs & maintenance
- −$966
- − Management
- −$966
- − Depreciation
- −$1,743
- Taxable income
- $4,599
- Est. tax owed @ 24.0%
- −$1,104
- After-tax cash flow
- $4,219/yr
For passive investors: Depreciation is non-cash, so a rental often shows a tax loss while cash-flowing — sheltering income. Rental losses are passive: they offset passive income freely, and up to $25,000/yr can offset ordinary (W-2) income if you actively participate and your MAGI is under $100k (phasing out to $0 by $150k); unused losses carry forward. On sale, claimed depreciation is recaptured at up to 25%, and gains may owe capital-gains tax (a 1031 exchange can defer both). Figures are a year-1 estimate at your 24.0% rate — not tax advice; consult a CPA.
Schools (NCES district)
- District
- Thayer R-II
- NCES district ID
- 2930270
- Math proficiency
- 51% ▼ -8.00%
- Reading proficiency
- 52% ▼ -6.00%
- Median HH income
- $31,092
- Composite
- 42.22/100
- National rank
- #3284
- State rank
- #42 of 324 in MO
Livability — Thayer
- Score
- 59/100
- State rank
- #530
- US rank
- #19863
Category grades
Schools grade is shown separately in the Schools card above.
Census & demographics
- Census place
- Thayer, MO
- Population (ZIP)
- 4,172
Population outlook (Oregon County) Hauer SSP2
- Today (2025)
- 10,607 people
- By 2030
- 10,352 · -2.4%
- By 2040
- 9,829 · -7.3%
- By 2050
- 9,286 · -12.5%
- By 2075
- 8,392 · -20.9%
- By 2100
- 7,136 · -32.7%
Race, ethnicity, and origin ACS 2023
- Neighborhood character
- Predominantly White (94%)
- Race & ethnicity
- White 94% Two or more races 5% Hispanic / Latino 1%
- Common ancestry
- Serbian 2% Slovak 2% Portuguese 1%
- Foreign-born
- 0%
Political lean MEDSL · Oregon
- 2024 margin
- Solid R (+69.1) · D 15.1% · R 84.2%
- 2008→2024 swing
- -50.8pp toward R · 2008: -18.3pp · 2024: -69.1pp
- All cycles
- 2024: R+69.1 2020: R+63.8 2016: R+60.1 2012: R+33.2 2008: R+18.3
Not yet ingested
- Civics
- —
Market trends
- HPI YoY
- ▼ -23.09%
- Current HPI
- 196.3094
- Rent YoY
- —
- Metro
- —
- State GDP YoY
- ▲ 1.84%
- F500 in state
- 20
Industry mix (Fortune 500 HQ in MO)
| Industry | F500 HQs | Revenue |
|---|---|---|
| Healthcare | 1 | $163B |
|
||
| Insurance | 1 | $21B |
|
||
| Industrial Technology | 1 | $17B |
|
||
| Retail | 1 | $16B |
|
||
| Industrial Distribution | 1 | $10B |
|
||
| Utilities | 1 | $9B |
|
||
Price history
1 event — show timeline
- 2026-05-27 Listed $59,900 SOMO
Property tax history
+1.5%/yrLatest (2025): $151 · -0.4% YoY. Source: county tax records.
Cash-flow waterfall
monthlySold comps — $/sqft
last 12 mo · ≤1 miLoading sold comps…