30802 Coast Unit F10 · Laguna Beach, CA
Flood risk 8/10 · Major
- FEMA flood zone
- X (unshaded)
- Chance of flooding over 30 yrs
- 0.79%
- Est. flood insurance / yr
- $507 – $1,088
Fire risk 3/10 · Minor
- Est. fire insurance / yr
- $659 – $1,223
Heat risk 4/10 · Minor
- Hot days now (above 86°F)
- 7 days/yr
- Hot days in 30 yrs
- 22 days/yr
Wind risk 1/10 · Minimal
- Chance of severe wind over 30 yrs
- —
Air-quality risk 4/10 · Minor
- Unhealthy air days now
- 5 days/yr
- Unhealthy air days in 30 yrs
- 5 days/yr
Risk factors via First Street. Map © Google.
Why this score? — see what drove the C- grade
The composite is a weighted blend of 9 inputs, each scored 0–100. Each bar is that input's sub-score; the figure is the points it added to the 100-point composite (weight × sub-score).
- Cash flow +21.3/30.0
- Appreciation +8.1/10.0
- DSCR +6.8/10.0
- 1% rule +5.6/10.0
- Livability +3.4/5.0
- Schools +2.6/10.0
- Condition / age +2.5/5.0
- Rent growth +2.4/5.0
- ARV discount +0.0/15.0
$636,000
🖨 Deal sheet 📄 Offer letter ✓ Due diligence
Listing remarks MLS
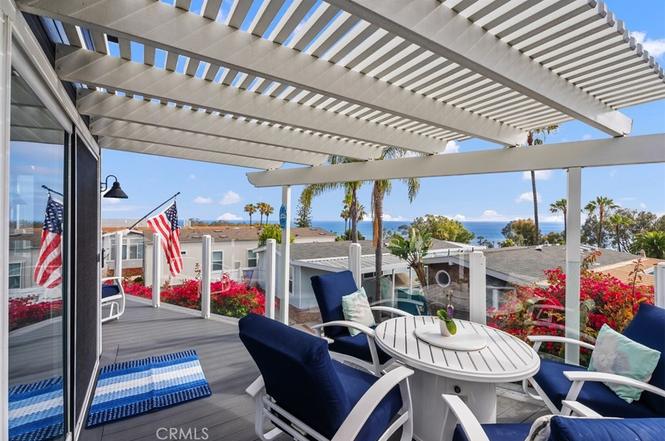
You must see this beautiful manufactured home located in Laguna Terrace, a great community located across from the Montage Resort and some of the beat beaches in world. It is a 2 bedroom 2 bath home with a large deck with views of Catalina and great sunsets. It is in a land lease community with you owning your home and leasing the land. The community owner offers a 20 year lease term beginning at $3,146 with 3 % or CPI (whichever is higher) increase annually. There are no property taxes on the land or No HOA fee. It a great place to live convenient to restaurants and stores and transportation into the very fun downtown Laguna Beach.
Key facts
- Air conditioning
- Spacious deck
- Updated kitchen
Tags
Property features AI
Finance
- Other: Primary bedroom set and outdoor patio furniture excluded
- Financial info: Land lease: $5,250 per month (park)
- HOA & community: Located in Laguna Terrace mobile park; Manager approval required; Park is suburban in character; Pets allowed with breed restrictions
Exterior
- Parking: Assigned on-site parking; Asphalt driveway; Parking space available
- Utilities: Standard electric service; Natural gas connected; Public/district water; Public sewer
- Home design: Single-story mobile home (Model: Westwood); Turnkey condition; Entry on left; One total story; Has view; Mobile home remains (24' x 48')
- Construction: Pier jacks foundation
- Exterior features: Deck; Patio/porch; In-ground fenced community pool (heated); Partial vinyl and wood fencing; Paved road access; 0–1 unit/acre lot character
Interior
- Kitchen: Kitchen open to family room; Kitchen island; Gas cooktop; Gas oven; Microwave; Refrigerator; Dishwasher
- Bedrooms: All bedrooms on ground level; Main floor primary bedroom; Main floor bedroom
- Bathrooms: Two 3/4 baths; Main floor full bath; Walk-in shower; Shower; Double sinks in primary bath; Vanity area; Bidet; Exhaust fan(s)
- Heating & cooling: Central cooling; Central furnace; Fireplace
- Interior features: Furnished; High ceilings (9+ feet); Ceiling fan; Recessed lighting; Sliding glass door(s); Living room deck attached; Skylights; Tinted windows; Blinds; One-level living; In-ground community heated spa
- Laundry & utility: Inside laundry; Washer included; Dryer included
Neighborhood map
What this means for you Summary
Snapshot
- This is a 2-bed/2.0-bath manufactured listed at $636k.
Deal economics
- At list price, monthly cash flow is $869 ($10k/yr) — positive.
- The deal already cash-flows at list — no discount required.
- Meets the 1% rule at list price ($7k rent vs $636k).
- Cap rate 8.1% vs local median 0.7% in Laguna Beach — top-decile yield for the area; either an underpriced asset or a hidden risk that comps aren't pricing in. Stress-test before assuming the spread holds.
Location & tenants
- Location reads 68/100 on livability (#276 in CA) — a middle-class / working-renter tenant base. Strengths: employment A+, crime A; Watch: commute D+, amenities F, cost of living F.
- Laguna Beach Unified (suburban): math 25% / reading 25% proficiency, ranked #343 of 517 in CA (top 66%) — low school quality limits family demand, transient renter base, plan for 1-2y turnover; only 8% free/reduced lunch — higher-income household profile.
- Zoned schools: El Morro Elementary (416 students, 23% FRL); Thurston Middle (537 students, 21% FRL); Laguna Beach High (930 students, 20% FRL).
- Market conditions: Rents soft (-0.2%/yr); 221 active listings in the ZIP; 40 comparable units currently listed for rent nearby; rentals lingering (median 44d on market — plan ~5-8 weeks vacancy on turnover, expect pricing pressure); 58% of comp listings sitting > 30 days — soft ceiling on asking rent; high-income renter base; 6,974 units permitted in Orange County in 2024 (3,839 in 5+ unit buildings).
Forward outlook
- In year one you build about $44k of equity ($4k loan paydown + $39k appreciation (6.2% local appreciation)).
- Orange County population projected at +14% by 2050 — modest demand growth; plan on rents tracking national, not racing it.
- At projected returns (6.2% appreciation + 0.0% rent growth), your $178k cash investment doubles in ~4 years — after that, you're playing with house money.
- By year 2, paydown + projected appreciation supports a ~$70k cash-out refi (75% LTV) — recoverable capital for the next deal without selling this one.
Negotiation context
- Only 7 days on market — expect competitive offers; lowballing is unlikely to land.
- 7 sale attempts since 22y ago with the ask held roughly flat each time — persistent listings suggest the price (not the market) is what's stuck; bring a comps-based counter.
- Current owner paid $135k; list at $636k implies a 371% gain — meaningful room to come down on a strong offer.
Risks & watch-outs
- Watch-outs: flood insurance adds $66/mo.
- Climate carrying-cost: severe flood risk — expect insurance premiums to compound above CPI over the hold.
Questions for the listing agent
- What's the actual annual flood-insurance premium (NFIP or private), and is the property in a SFHA with mandatory coverage?
- Is there a deadline driving the sale (1031 exchange, divorce, estate, relocation)? That informs how much negotiation room exists.
- Schools are A-rated — typically a magnet for longer-tenancy family renters. What's the average tenant stay here, and is there a school-zone premium baked into asking?
- What's the average days-on-market for RENTAL listings here right now (not sales)? A rising rental-DOM trend means longer vacancies and softer asking-rent achievability than the comps imply.
- What's the recent tenant-quality profile in this submarket — average credit score on applications, eviction rate, late-payment / NSF rate, and stable-employment percentage? A property-management company in the area should have these aggregated.
- How much new for-sale + rental construction is in the pipeline within 1–3 miles? Heavy new supply typically softens prices + rents 12–24 months out; constrained supply supports both.
Investment metrics
- 1% rule
- 1.06% ✓
- Cap rate
- 8.06%
- Cash-on-cash
- 6.30%
- DSCR
- 1.28
- GRM
- 7.9
CMA / ARV
- ARV (on-the-fly)
- $459,096
- Comps found
- 8
Show comp detail 8 sales within ~0.75 mi
| Address | Dist | Beds/Ba | Sqft | Sold | Price | $/sf | Match |
|---|---|---|---|---|---|---|---|
| 30802 S Coast Hwy Unit F15 | 0.00mi | 2/2.0 | 1,176 (+4%) | 15mo | $499,000 | $424 | 80 |
| 30802 Coast Unit L3 | 0.00mi | 2/2.0 | 1,248 (+11%) | 3mo | $377,000 | $302 | 80 |
| 30802 Coast Hwy Unit A8 | 0.00mi | 2/2.5 | 1,200 (+6%) | 11mo | $1,025,000 | $854 | 78 |
| 30802 Coast Unit K17 | 0.00mi | 3/2.0 (+1) | 1,169 (+4%) | 13mo | $375,000 | $321 | 78 |
| 30802 Coast Hwy Unit C1 | 0.00mi | 2/2.0 | 1,158 (+3%) | 23mo | $500,000 | $432 | 76 |
| 30802 Coast Unit M1 | 0.00mi | 2/2.0 | 1,242 (+10%) | 10mo | $505,000 | $407 | 75 |
| 30802 S Coast Hwy Unit K51 | 0.00mi | 2/2.0 | 1,051 (-7%) | 17mo | $420,000 | $400 | 74 |
| 30802 Coast Hwy Unit D3 | 0.00mi | 1/2.0 (-1) | 968 (-14%) | 20mo | $355,000 | $367 | 54 |
Match score weights: distance 35% · size 25% · config 20% · recency 20%. Top-matched comps best support the ARV.
Projected returns pro-forma
6.19% appreciation · 0.0% rent growth · sell at horizon
- IRR
- 19.2%
- Equity multiple
- 2.27×
- Total profit
- $226,566
- Equity at exit
- $407,522
- IRR
- 17.4%
- Equity multiple
- 4.29×
- Total profit
- $586,073
- Equity at exit
- $745,767
Cash invested: $178,080 (down + closing). Projections, not guarantees.
Landlord ↔ Tenant lean methodology
- Overall (STATE)
- 18 Strongly Tenant-Friendly
- State California
- 18 Strongly Tenant-Friendly · D+13
- County
- — inherits STATE
- City
- — inherits STATE
ZIP-level market 92651
- Home prices YoY
- 1.6%
- Rents YoY
- -0.2%
- Active inventory
- 221
- Price-to-rent
- 7.9×
Monthly cashflow live
- Estimated rent
- $6,747 high interval (Pro) →
- Mortgage (P&I)
- −$3,335
- Tax est. 1.5%
- −$795 /mo · $9,540/yr
- Insurance
- −$265
- Flood insurance flood zone
- −$66 /mo · $798/yr
- HOA
- −$0
- Vacancy / Maint / Mgmt
- −$1,417
- Net cashflow
- $869
Break-even live
UW: 25.0% down · 7.5% · 30yr · 1.5% tax · 5.0% vac · 8.0% maint · 8.0% mgmt
Financing live
Cash to close
- Down payment
- $159,000
- Closing costs
- $19,080
- Reserves months
- —
- Total cash needed
- —
Loan-product check · same deal, 3 products live
Conventional
25% down · 7.5% · 30yr
- Down + closing
- —
- Monthly P&I
- —
- Monthly cashflow
- —
- DSCR
- —
- Eligible?
- —
Personal DTI + credit; lowest rate.
DSCR
20% down · 8.5% · 30yr
- Down + closing
- —
- Monthly P&I
- —
- Monthly cashflow
- —
- DSCR
- —
- Eligible?
- —
No personal income docs; deal must DSCR.
Hard money
10% down · 12.0% · 12mo
- Down + closing
- —
- Monthly P&I
- —
- Monthly cashflow
- —
- DSCR
- —
- Eligible?
- —
Short-term bridge; refi at stabilization.
Rent comps 40 comps
| Address | Beds | Baths | Sqft | Rent | $/sqft | DOM | Units | Dist |
|---|---|---|---|---|---|---|---|---|
| 2915 Rounsevel Ter Laguna Beach, CA | 3.0 | 2.0 | 1300 | $10,000 | $7.69 | 43d | 1 | 0.25mi |
| 2859 Wards Ter Laguna Beach, CA | 2.0 | 2.0 | 1100 | $8,000 | $7.27 | 43d | 1 | 0.40mi |
| 2857 Wards Ter Laguna Beach, CA | 2.0 | 2.0 | 1100 | $8,000 | $7.27 | 43d | 1 | 0.40mi |
| 30872 Marilyn Dr Laguna Beach, CA | 3.0 | 2.0 | 1412 | $7,800 | $5.52 | 24d | 1 | 0.40mi |
| 30872 Marilyn Dr Laguna Beach, CA | 3.0 | 2.0 | 1412 | $7,800 | $5.52 | 43d | 1 | 0.40mi |
| 200 Alta Vista Way Unit B Laguna Beach, CA | 1.0 | 1.5 | 850 | $4,500 | $5.29 | 43d | 1 | 0.43mi |
| 21702 Ocean Vista Dr Unit B Laguna Beach, CA | 2.0 | 1.0 | 1000 | $7,500 | $7.50 | 24d | 1 | 0.44mi |
| 21722 Ocean Vista Dr Unit D Laguna Beach, CA | 2.0 | 1.0 | 1000 | $5,200 | $5.20 | 7d | 1 | 0.46mi |
| 2626 Solana Way Laguna Beach, CA | 2.0 | 1.0 | 870 | $4,950 | $5.69 | 43d | 1 | 0.51mi |
| 151 Rockledge Ter Laguna Beach, CA | 2.0 | 2.0 | 1267 | $12,000 | $9.47 | 43d | 1 | 0.55mi |
| 915 Miramar St Laguna Beach, CA | 3.0 | 2.0 | 1260 | $6,995 | $5.55 | 18d | 1 | 0.64mi |
| 222 Arch St Unit 3 Laguna Beach, CA | 2.0 | 2.0 | 1050 | $4,500 | $4.29 | 19d | 1 | 0.69mi |
| 989 La Mirada St Laguna Beach, CA | 3.0 | 2.5 | 1491 | $7,800 | $5.23 | 5d | 1 | 0.71mi |
| 989 La Mirada St Laguna Beach, CA | 3.0 | 2.0 | 1391 | $8,900 | $6.40 | 43d | 1 | 0.71mi |
| 31191 Monterey St Laguna Beach, CA | 2.0 | 1.5 | 1100 | $8,500 | $7.73 | 43d | 1 | 0.78mi |
| 240 Moss St #15 Laguna Beach, CA | 1.0 | 1.0 | 777 | $5,500 | $7.08 | 43d | 1 | 0.82mi |
| 240 Moss St #4 Laguna Beach, CA | 2.0 | 2.0 | 1169 | $8,000 | $6.84 | 43d | 1 | 0.82mi |
| 2173 Crestview Dr Laguna Beach, CA | 1.0 | 1.0 | 800 | $4,500 | $5.62 | 43d | 1 | 0.82mi |
| 161 Ruby St Laguna Beach, CA | 3.0 | 2.0 | 1463 | $9,750 | $6.66 | 43d | 1 | 0.87mi |
| 2037 S Coast Hwy Unit 12 Laguna Beach, CA | 2.0 | 1.0 | 853 | $4,650 | $5.45 | 19d | 1 | 0.90mi |
| 2037 S Coast Hwy Unit 11 Laguna Beach, CA | 2.0 | 1.0 | 853 | $4,600 | $5.39 | 24d | 1 | 0.90mi |
| 2007 S Coast Hwy Unit Unite Laguna Beach, CA | 1.0 | 1.0 | 877 | $4,000 | $4.56 | 43d | 1 | 0.93mi |
| 1360 Baja St Laguna Beach, CA | 1.0 | 1.0 | 900 | $3,100 | $3.44 | 43d | 1 | 1.02mi |
| 31423 COAST Hwy Laguna Beach, OS | 2.0 | 2.0 | 1100 | $7,000 | $6.36 | 43d | 1 | 1.04mi |
| 1821 Glenneyre St Laguna Beach, CA | 1.0 | 1.0 | 800 | $3,500 | $4.38 | 24d | 1 | 1.04mi |
| 1625 Catalina St Laguna Beach, CA | 2.0 | 2.0 | 1500 | $7,200 | $4.80 | 7d | 1 | 1.16mi |
| 31494 West St Unit B Laguna Beach, CA | 2.0 | 1.0 | 1120 | $3,650 | $3.26 | 24d | 1 | 1.17mi |
| 31494 West St Laguna Beach, CA | 2.0 | 1.0 | 1100 | $3,650 | $3.32 | 19d | 1 | 1.17mi |
| 1585 S Coast Hwy #32 Laguna Beach, CA | 2.0 | 2.0 | 1155 | $9,500 | $8.23 | 24d | 1 | 1.21mi |
| 1504 Carmelita St Laguna Beach, CA | 2.0 | 1.0 | 800 | $5,347 | $6.68 | 43d | 1 | 1.25mi |
| 31561 Table Rock Dr #105 Laguna Beach, CA | 2.0 | 2.5 | 1236 | $14,900 | $12.06 | 24d | 1 | 1.29mi |
| 31561 Table Rock Dr Laguna Beach, CA | 2.0 | 2.0–2.5 | 1186 | $13,200 | $11.13 | 43d | 2 | 1.29mi |
| 1466 Randall Way Laguna Beach, CA | 2.0 | 2.0 | 1358 | $5,500 | $4.05 | 43d | 1 | 1.30mi |
| 477 Mountain Rd Laguna Beach, CA | 2.0 | 1.5 | 900 | $5,200 | $5.78 | 19d | 1 | 1.33mi |
| 31641 2nd Ave Laguna Beach, CA | 2.0 | 1.0 | 1000 | $6,000 | $6.00 | 43d | 1 | 1.34mi |
| 31672 Sea Bluff Ln Laguna Beach, CA | 1.0 | 1.0 | 800 | $4,995 | $6.24 | 43d | 1 | 1.37mi |
| 31671 Seacove Dr Unit A Laguna Beach, CA | 1.0 | 1.0 | 940 | $4,495 | $4.78 | 43d | 1 | 1.38mi |
| 31671 Seacove Dr Unit A Laguna Beach, CA | 1.0 | 1.0 | 940 | $4,495 | $4.78 | 24d | 1 | 1.38mi |
| 31656 Wildwood Rd Laguna Beach, CA | 2.0 | 1.0 | 890 | $11,000 | $12.36 | 43d | 1 | 1.38mi |
| 31676 Seacove Dr Laguna Beach, CA | 2.0 | 2.0 | 1489 | $15,000 | $10.07 | 11d | 1 | 1.39mi |
Listing history 7 events
-
2026-06-18days on market $636,000 Active 7 DOM
-
2026-06-17days on market $636,000 Active 6 DOM
-
2026-06-16days on market $636,000 Active 5 DOM
-
2026-06-15days on market $636,000 Active 4 DOM
-
2026-06-13days on market $636,000 Active 2 DOM
-
2026-06-13remarks 695-char remark
-
2026-06-13$636,000 Active 1 DOM
ⓘ Source: listings_history table (triggers on properties + properties_extension) + one-shot
backfill from property_details.listing_events for pre-trigger history.
Climate risk First Street
- Flood 8/10 Severe FEMA zone X (unshaded) · 79% chance over 30 yrs
- Wildfire 3/10 Moderate
- Heat 4/10 Moderate 7 d/yr ≥86°F today · 22 d/yr by 30 yrs out
- Wind 1/10 Low
- Air quality 4/10 Moderate 5 unhealthy d/yr today · 5 by 30 yrs out
Nearby sold comps map
Loading sold comps map…
Walkable amenities ~0.75 mi
Loading nearby amenities…
Taxation est. · year 1
- Rental income
- $80,968
- − Mortgage interest
- −$35,626
- − Property taxes
- −$9,540
- − Insurance
- −$3,978
- − Repairs & maintenance
- −$6,477
- − Management
- −$6,477
- − Depreciation
- −$18,502
- Taxable income
- $368
- Est. tax owed @ 24.0%
- −$88
- After-tax cash flow
- $10,336/yr
For passive investors: Depreciation is non-cash, so a rental often shows a tax loss while cash-flowing — sheltering income. Rental losses are passive: they offset passive income freely, and up to $25,000/yr can offset ordinary (W-2) income if you actively participate and your MAGI is under $100k (phasing out to $0 by $150k); unused losses carry forward. On sale, claimed depreciation is recaptured at up to 25%, and gains may owe capital-gains tax (a 1031 exchange can defer both). Figures are a year-1 estimate at your 24.0% rate — not tax advice; consult a CPA.
Schools (NCES district)
- District
- Laguna Beach Unified
- NCES district ID
- 0620370
- Math proficiency
- 25% ▼ -53.00%
- Reading proficiency
- 25% ▼ -58.00%
- Median HH income
- $92,428
- Composite
- 26.12/100
- National rank
- #7282
- State rank
- #343 of 517 in CA
Livability — Laguna Beach
- Score
- 68/100
- State rank
- #276
- US rank
- #9291
Category grades
Schools grade is shown separately in the Schools card above.
Census & demographics
- Census place
- Laguna Beach, CA
- County
- Orange County · 3,096,323 people
- City population
- 23,557
- Metro
- Los Angeles-Long Beach-Anaheim, CA
- Population (ZIP)
- 23,557
- Household income
- $146,604
- Rent vs Own
- Severe rent burden
- 1265.0
Population outlook (Orange County) Hauer SSP2
- Today (2025)
- 3,477,456 people
- By 2030
- 3,613,117 · +3.9%
- By 2040
- 3,835,945 · +10.3%
- By 2050
- 3,968,736 · +14.1%
- By 2075
- 4,097,053 · +17.8%
- By 2100
- 3,903,633 · +12.3%
Race, ethnicity, and origin ACS 2023
- Neighborhood character
- Predominantly White (81%)
- Race & ethnicity
- White 81% Hispanic / Latino 9% Two or more races 9% Asian 4%
- Hispanic origin (detail)
- Mexican 6%
- Common ancestry
- Slovak 5% Lithuanian 4% Italian 3%
- Foreign-born
- 11% · Canada, South Korea
- Languages at home
- 86% English-only · Spanish 6% Other Indo-European 3% German/W. Germanic 2%
Political lean MEDSL · Orange
- 2024 margin
- Toss-up / Even · D 49.7% · R 47.1% · Other 3.2%
- 2008→2024 swing
- +5.2pp toward D · 2008: -2.6pp · 2024: 2.6pp
- All cycles
- 2024: D+2.6 2020: D+9.0 2016: D+7.7 2012: R+8.3 2008: R+2.6
Not yet ingested
- Civics
- —
Market trends
- HPI YoY
- ▲ 6.19%
- Current HPI
- 397.9008
- Rent YoY
- ▼ -0.21%
- Metro
- Los Angeles-Long Beach-Anaheim, CA
- State GDP YoY
- ▲ 3.21%
- F500 in state
- 116
Industry mix (Fortune 500 HQ in CA)
| Industry | F500 HQs | Revenue |
|---|---|---|
| Technology | 27 | $1,492B |
|
||
| Financial Services | 3 | $174B |
|
||
| Retail | 3 | $44B |
|
||
| Insurance | 3 | $26B |
|
||
| Media / Entertainment | 2 | $115B |
|
||
| Pharmaceuticals / Biotech | 2 | $62B |
|
||
Price history
+291.4% since first listed18 events — show timeline
- 2026-06-11 Listed $636,000 CRMLS
- 2017-11-08 Sold (MLS) $135,000 CRMLS
- 2017-10-14 Pending — CRMLS
- 2017-08-30 Relisted — CRMLS
- 2017-08-16 Pending — CRMLS
- 2017-08-01 Price Changed $179,000 CRMLS
- 2017-07-03 Listed $195,000 CRMLS
- 2016-07-06 Listing Removed — CRMLS
- 2016-06-18 Listed $204,500 CRMLS
- 2015-03-20 Sold (MLS) $142,500 CRMLS
- 2015-03-05 Pending — CRMLS
- 2014-10-09 Price Changed $159,000 CRMLS
- 2014-08-22 Relisted — CRMLS
- 2014-08-20 Pending — CRMLS
- 2014-06-27 Price Changed $169,000 CRMLS
- 2014-06-27 Listed $169,999 CRMLS
- 2005-06-23 Sold (MLS) $159,000 CRMLS
- 2004-09-07 Listed $162,500 CRMLS
Property tax history
-3.4%/yrLatest (2025): $238 · +0.0% YoY. Source: county tax records.
Cash-flow waterfall
monthlySold comps — $/sqft
last 12 mo · ≤1 miLoading sold comps…