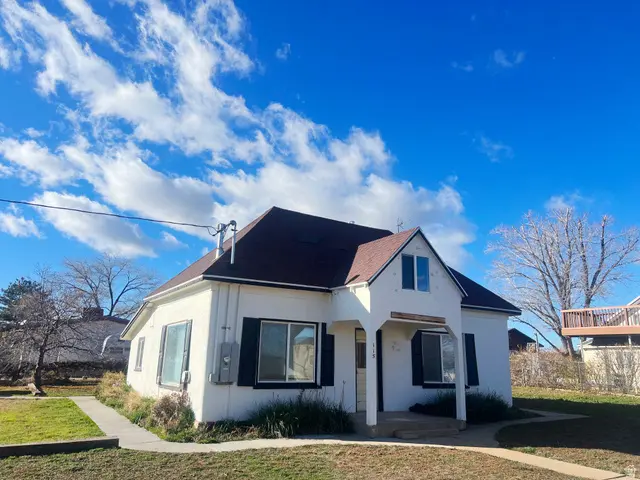
115 N 400 W · Blanding, UT
Flood risk 1/10 · Minimal
- FEMA flood zone
- —
- Chance of flooding over 30 yrs
- 0.0%
- Est. flood insurance / yr
- —
Fire risk 7/10 · Major
- Est. fire insurance / yr
- $453 – $841
Heat risk 3/10 · Minor
- Hot days now (above 93°F)
- 7 days/yr
- Hot days in 30 yrs
- 17 days/yr
Wind risk 1/10 · Minimal
- Chance of severe wind over 30 yrs
- —
Air-quality risk 1/10 · Minimal
- Unhealthy air days now
- 0 days/yr
- Unhealthy air days in 30 yrs
- 0 days/yr
Risk factors via First Street. Map © Google.
Why this score? — see what drove the D grade
The composite is a weighted blend of 9 inputs, each scored 0–100. Each bar is that input's sub-score; the figure is the points it added to the 100-point composite (weight × sub-score).
- Cash flow +15.0/30.0
- ARV discount +7.5/15.0
- DSCR +4.6/10.0
- Schools +3.5/10.0
- Livability +3.4/5.0
- 1% rule +3.2/10.0
- Rent growth +2.5/5.0
- Condition / age +2.5/5.0
- Appreciation +0.0/10.0
$164,950
🖨 Deal sheet 📄 Offer letter ✓ Due diligence
Listing remarks
Quaint, well-maintained home with rustic charm and convenient location to town. Large lot with mature landscaping, large storage sheds, dog run, covered patio for hot tub. The interior features original hardwood floors throughout, light-filled living room with built-in cabinets, spacious kitchen, full bath. Priced to sell. PHOTO DISCLAIMER: Some images in this listing have been virtually staged.
Key facts
- Large storage sheds
- Covered patio
- Dog run
Tags
Property features AI
Finance
- Other: Zoned single-family (R2)
- Financial info: REO / Bank owned
Exterior
- Parking: Five total parking spaces (all open)
- Utilities: Natural gas connected; Electricity connected; Sewer connected; Culinary water connected
- Home design: Rambler/Ranch style; Faces east; Single-family property; Built in 1950
- Construction: Asphalt and stucco construction materials; Asphalt roof; Built and currently standing
- Exterior features: Corner lot with mountain views; Dog run; Hot tub; Landscaped areas with mature trees
Interior
- Kitchen: Refrigerator
- Bedrooms: One main-level bedroom
- Flooring: Hardwood floors
- Bathrooms: One full bathroom
- Heating & cooling: Gas radiant heating; Evaporative cooling
- Interior features: Blinds on windows; Outbuildings on the property; Covered patio
Neighborhood map
What this means for you Summary
Snapshot
- This is a 1-bed/1.0-bath other listed at $165k.
Deal economics
- At list price, monthly cash flow is $51 ($613/yr) — positive.
- The deal already cash-flows at list — no discount required.
- To meet the 1% rule (rent ≥ 1% of price), the offer needs to be $135k (18.0% below list).
- Recommended offer: $135k (18.0% below list) — sets the bar for 1% rule.
Location & tenants
- Location reads 68/100 on livability (#114 in UT) — a middle-class / working-renter tenant base. Strengths: crime A+, cost of living A+, housing A+; Watch: amenities F, commute F, health & safety F.
- San Juan District (rural): math 42% / reading 41% proficiency, ranked #47 of 80 in UT (top 59%) — families likely to look elsewhere, expect single-tenant / working-renter base with shorter leases; 66% free/reduced lunch — lower-income household profile, screen leases tightly.
- Zoned schools: Blanding School (math 40% / reading 37%, grade F, #346 of 585 statewide, top 59%, 565 students, 100% FRL); Albert R. Lyman Middle (math 36% / reading 39%, grade F, #85 of 138 statewide, top 62%, 319 students, 99% FRL); San Juan High (math 27% / reading 42%, grade F, #95 of 171 statewide, top 61%, 428 students, 100% FRL) — zoned schools average 99% FRL vs 66% district-wide (33 pts higher); higher-poverty schools than district average — tighter screening recommended.
- Market conditions: 26 active listings in the ZIP; 51 units permitted in San Juan County in 2024 (0 in 5+ unit buildings).
Forward outlook
- Local home prices are declining (-3.0%/yr); year-one equity from $1k of loan paydown is wiped out by about $5k of value loss. Plan a longer hold.
- San Juan County population projected at +22% by 2050 — long-run rental-demand tailwind backs the buy-and-hold thesis.
Negotiation context
- It's been on market 29 days — a 2% lower offer ($162k) is reasonable based on typical stale-listing flexibility.
- 4 sale attempts since 3y ago; this cycle's ask has dropped $10k (6%) from the opening price — seller is motivated, your offer sets the floor, not the list.
Risks & watch-outs
- Watch-outs: built in 1940 — expect roof / HVAC / electrical / plumbing capex.
- Climate carrying-cost: major wildfire risk — expect insurance premiums to compound above CPI over the hold.
Questions for the listing agent
- Built in 1940 — when were the roof, HVAC, electrical panel, plumbing, and water heater last replaced?
- Is there a deadline driving the sale (1031 exchange, divorce, estate, relocation)? That informs how much negotiation room exists.
- The area grade is low — what's the realistic commute time and amenity access for the typical tenant pool here? Any planned neighborhood developments (good or bad) we should know about?
- What's the average days-on-market for RENTAL listings here right now (not sales)? A rising rental-DOM trend means longer vacancies and softer asking-rent achievability than the comps imply.
- What's the recent tenant-quality profile in this submarket — average credit score on applications, eviction rate, late-payment / NSF rate, and stable-employment percentage? A property-management company in the area should have these aggregated.
- How much new for-sale + rental construction is in the pipeline within 1–3 miles? Heavy new supply typically softens prices + rents 12–24 months out; constrained supply supports both.
Investment metrics
- 1% rule
- 0.82% ✗
- Cap rate
- 6.66%
- Cash-on-cash
- 1.33%
- DSCR
- 1.06
- GRM
- 10.2
CMA / ARV
No comps found within radius.
Projected returns pro-forma
-3.0% appreciation · 3.0% rent growth · sell at horizon
- IRR
- -14.2%
- Equity multiple
- 0.49×
- Total profit
- $-23,532
- Equity at exit
- $24,595
- IRR
- -5.5%
- Equity multiple
- 0.64×
- Total profit
- $-16,526
- Equity at exit
- $14,262
Cash invested: $46,186 (down + closing). Projections, not guarantees.
Landlord ↔ Tenant lean methodology
- Overall (STATE)
- 86 Strongly Landlord-Friendly
- State Utah
- 86 Strongly Landlord-Friendly · R+15
- County
- — inherits STATE
- City
- — inherits STATE
ZIP-level market 84511
- Home prices YoY
- -14.8%
- Active inventory
- 26
- Price-to-rent
- 10.2×
Monthly cashflow live
- Estimated rent
- $1,353 medium interval (Pro) →
- Mortgage (P&I)
- −$865
- Tax from tax record
- −$84 /mo · $1,011/yr
- Insurance
- −$69
- HOA
- −$0
- Vacancy / Maint / Mgmt
- −$284
- Net cashflow
- $51
Break-even live
UW: 25.0% down · 7.5% · 30yr · 1.5% tax · 5.0% vac · 8.0% maint · 8.0% mgmt
Financing live
Cash to close
- Down payment
- $41,238
- Closing costs
- $4,948
- Reserves months
- —
- Total cash needed
- —
Loan-product check · same deal, 3 products live
Conventional
25% down · 7.5% · 30yr
- Down + closing
- —
- Monthly P&I
- —
- Monthly cashflow
- —
- DSCR
- —
- Eligible?
- —
Personal DTI + credit; lowest rate.
DSCR
20% down · 8.5% · 30yr
- Down + closing
- —
- Monthly P&I
- —
- Monthly cashflow
- —
- DSCR
- —
- Eligible?
- —
No personal income docs; deal must DSCR.
Hard money
10% down · 12.0% · 12mo
- Down + closing
- —
- Monthly P&I
- —
- Monthly cashflow
- —
- DSCR
- —
- Eligible?
- —
Short-term bridge; refi at stabilization.
Listing history 22 events
-
2026-06-18days on market $164,950 Active 29 DOM
-
2026-06-17days on market $164,950 Active 28 DOM
-
2026-06-16days on market $164,950 Active 27 DOM
-
2026-06-15days on market $164,950 Active 26 DOM
-
2026-06-14days on market $164,950 Active 24 DOM
-
2026-06-10days on market $164,950 Active 21 DOM
-
2026-06-09days on market $164,950 Active 20 DOM
-
2026-06-08days on market $164,950 Active 19 DOM
-
2026-06-07pricedays on market $164,950 Active 18 DOM
-
2026-06-03days on market $174,950 Active 14 DOM
-
2026-06-02days on market $174,950 Active 13 DOM
-
2026-06-01days on market $174,950 Active 12 DOM
-
2026-05-31days on market $174,950 Active 11 DOM
-
2026-05-31days on market $174,950 Active 10 DOM
-
2026-05-20$174,950 Active
-
2024-09-25historical
-
2024-07-01status Active
-
2024-07-01price $249,500
-
2024-06-25historical
-
2023-12-24$252,000 Active
-
2023-11-18historical
-
2023-05-19$278,000 Active
ⓘ Source: listings_history table (triggers on properties + properties_extension) + one-shot
backfill from property_details.listing_events for pre-trigger history.
Tax reassessment forecast UT · Resets to sale price
- Current annual tax
- $1,011 · $84/mo
- Projected year-2 tax
- $1,089 · $91/mo
- Expected delta
- +$78/yr (+$6/mo · 7.7%)
ⓘ Screening estimate from a state-policy table — verify with the county assessor before closing.
Climate risk First Street
- Flood 1/10 Low 0% chance over 30 yrs
- Wildfire 7/10 Severe
- Heat 3/10 Moderate 7 d/yr ≥93°F today · 17 d/yr by 30 yrs out
- Wind 1/10 Low
- Air quality 1/10 Low 0 unhealthy d/yr today · 0 by 30 yrs out
Nearby sold comps map
Loading sold comps map…
Walkable amenities ~0.75 mi
Loading nearby amenities…
Taxation est. · year 1
- Rental income
- $16,239
- − Mortgage interest
- −$9,240
- − Property taxes
- −$1,011
- − Insurance
- −$825
- − Repairs & maintenance
- −$1,299
- − Management
- −$1,299
- − Depreciation
- −$4,799
- Taxable loss
- −$2,234
- Est. tax savings @ 24.0%
- +$536
- After-tax cash flow
- $1,149/yr
For passive investors: Depreciation is non-cash, so a rental often shows a tax loss while cash-flowing — sheltering income. Rental losses are passive: they offset passive income freely, and up to $25,000/yr can offset ordinary (W-2) income if you actively participate and your MAGI is under $100k (phasing out to $0 by $150k); unused losses carry forward. On sale, claimed depreciation is recaptured at up to 25%, and gains may owe capital-gains tax (a 1031 exchange can defer both). Figures are a year-1 estimate at your 24.0% rate — not tax advice; consult a CPA.
Schools (NCES district)
- District
- San Juan District
- NCES district ID
- 4900900
- Math proficiency
- 42% ▲ 10.00%
- Reading proficiency
- 41% ▲ 9.00%
- Median HH income
- $40,036
- Composite
- 34.8/100
- National rank
- #5110
- State rank
- #47 of 80 in UT
Livability — Blanding
- Score
- 68/100
- State rank
- #114
- US rank
- #9473
Category grades
Schools grade is shown separately in the Schools card above.
Census & demographics
- Census place
- Blanding, UT
- Population (ZIP)
- 4,248
Population outlook (San Juan County) Hauer SSP2
- Today (2025)
- 17,398 people
- By 2030
- 18,188 · +4.5%
- By 2040
- 19,669 · +13.1%
- By 2050
- 21,156 · +21.6%
- By 2075
- 25,075 · +44.1%
- By 2100
- 27,319 · +57.0%
Race, ethnicity, and origin ACS 2023
- Neighborhood character
- Diverse neighborhood (Simpson 0.58)
- Race & ethnicity
- White 64% Native American 23% Hispanic / Latino 6% Two or more races 3% Asian 2% Pacific Islander 1%
- Hispanic origin (detail)
- Mexican 3%
- Common ancestry
- Serbian 3% Italian 3% Lithuanian 2%
- Foreign-born
- 4% · Canada
- Languages at home
- 84% English-only · Other Asian/Pacific 2% Spanish 2% Russian/Polish/Slavic 1%
Political lean MEDSL · San Juan
- 2024 margin
- R (+16.3) · D 40.8% · R 57.1% · Other 2.1%
- 2008→2024 swing
- -11.8pp toward R · 2008: -4.5pp · 2024: -16.3pp
- All cycles
- 2024: R+16.3 2020: R+6.1 2016: R+11.8 2012: R+18.3 2008: R+4.5
Not yet ingested
- Civics
- —
Market trends
- HPI YoY
- ▼ -39.17%
- Current HPI
- 224.7858
- Rent YoY
- —
- Metro
- —
- State GDP YoY
- ▲ 3.54%
- F500 in state
- 2
Industry mix (Fortune 500 HQ in UT)
| Industry | F500 HQs | Revenue |
|---|---|---|
| Financial Services | 1 | $3B |
|
||
Price history
-37.1% since first listed8 events — show timeline
- 2026-05-20 Listed $174,950 WFRMLS
- 2024-09-25 Listing Removed — WFRMLS
- 2024-07-01 Relisted — WFRMLS
- 2024-07-01 Price Changed $249,500 WFRMLS
- 2024-06-25 Listing Removed — WFRMLS
- 2023-12-24 Listed $252,000 WFRMLS
- 2023-11-18 Listing Removed — WFRMLS
- 2023-05-19 Listed $278,000 WFRMLS
Property tax history
+8.4%/yrLatest (2025): $1,011 · +1.7% YoY. Source: county tax records.
Cash-flow waterfall
monthlySold comps — $/sqft
last 12 mo · ≤1 miLoading sold comps…