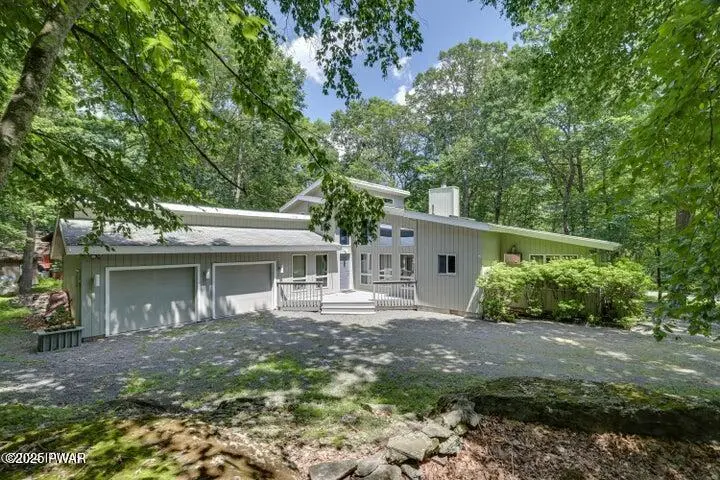
108 Heron Bay · Hemlock Farms, PA
Flood risk 1/10 · Minimal
- FEMA flood zone
- X (unshaded)
- Chance of flooding over 30 yrs
- 0.0%
- Est. flood insurance / yr
- $473 – $860
Fire risk 4/10 · Minor
- Est. fire insurance / yr
- $511 – $949
Heat risk 2/10 · Minimal
- Hot days now (above 91°F)
- 7 days/yr
- Hot days in 30 yrs
- 15 days/yr
Wind risk 3/10 · Minor
- Chance of severe wind over 30 yrs
- 7.0%
Air-quality risk 2/10 · Minimal
- Unhealthy air days now
- 1 days/yr
- Unhealthy air days in 30 yrs
- 2 days/yr
Risk factors via First Street. Map © Google.
Why this score? — see what drove the D+ grade
The composite is a weighted blend of 9 inputs, each scored 0–100. Each bar is that input's sub-score; the figure is the points it added to the 100-point composite (weight × sub-score).
- Cash flow +14.5/30.0
- Appreciation +10.0/10.0
- DSCR +4.4/10.0
- Schools +4.2/10.0
- 1% rule +4.1/10.0
- Livability +3.4/5.0
- Rent growth +2.5/5.0
- Condition / age +2.5/5.0
- ARV discount +0.0/15.0
$449,000
🖨 Deal sheet (PDF) 📄 Offer letter ✓ Due diligence
Listing remarks
Custom ContemporaryEnjoy the stunning open floor plan with lots of glass in this contemporary getaway with seasonal lakeview. Featuring 3 bedrooms 2 baths with master bedroom suite and Jacuzzi bath. Kitchen has granite counters and stainless appliances with breakfast counter, living/dining area with cathedral ceilings, beautiful hardwood floors and lots of glass. Large sunroom with custom french doors. Large open entertaining decks, 2 plus two car garage and more. a home you'll never want to leave. .. .. call today NEW ROOF
Key facts
- Seasonal lakeview
- Stainless appliances
- Jacuzzi bath
Tags
Neighborhood map
What this means for you Summary
Snapshot
- This is a 3-bed/2.0-bath single-family listed at $449k.
Deal economics
- At list price, monthly cash flow is $99 ($1k/yr) — positive.
- The deal already cash-flows at list — no discount required.
- To meet the 1% rule (rent ≥ 1% of price), the offer needs to be $409k (9.0% below list).
- Recommended offer: $409k (9.0% below list) — sets the bar for 1% rule.
Location & tenants
- Location reads 68/100 on livability (#884 in PA) — a middle-class / working-renter tenant base. Strengths: crime A+, housing A+, health & safety A+; Watch: schools C-, amenities F, commute F.
- Wallenpaupack Area SD (rural): math 39% / reading 59% proficiency, ranked #192 of 539 in PA (top 36%) — families likely to look elsewhere, expect single-tenant / working-renter base with shorter leases.
- Market conditions: 374 active listings in the ZIP; 4 comparable units currently listed for rent nearby; rentals leasing fast (median 3d on market — plan ~1-2 weeks tenant-placement turnaround); 213 units permitted in Pike County in 2024 (0 in 5+ unit buildings).
Forward outlook
- In year one you build about $48k of equity ($3k loan paydown + $45k appreciation (10.0% local appreciation)).
- Pike County population projected at -25% by 2050 — secular population decline; favor cash flow + early exit over multi-decade hold.
- At projected returns (10.0% appreciation + 3.0% rent growth), your $126k cash investment doubles in ~3 years — after that, you're playing with house money.
- By year 2, paydown + projected appreciation supports a ~$77k cash-out refi (75% LTV) — recoverable capital for the next deal without selling this one.
Negotiation context
- Only 8 days on market — expect competitive offers; lowballing is unlikely to land.
- 11 sale attempts since 6y ago with the ask held roughly flat each time — persistent listings suggest the price (not the market) is what's stuck; bring a comps-based counter.
- Current owner paid $310k; 45% above their basis — modest negotiation headroom, anchor on the comps not their cost.
Questions for the listing agent
- What does the HOA fee cover, when was the last increase, and are there any pending special assessments or reserve-fund shortfalls?
- Is there a deadline driving the sale (1031 exchange, divorce, estate, relocation)? That informs how much negotiation room exists.
- The area grade is low — what's the realistic commute time and amenity access for the typical tenant pool here? Any planned neighborhood developments (good or bad) we should know about?
- What's the average days-on-market for RENTAL listings here right now (not sales)? A rising rental-DOM trend means longer vacancies and softer asking-rent achievability than the comps imply.
- What's the recent tenant-quality profile in this submarket — average credit score on applications, eviction rate, late-payment / NSF rate, and stable-employment percentage? A property-management company in the area should have these aggregated.
- How much new for-sale + rental construction is in the pipeline within 1–3 miles? Heavy new supply typically softens prices + rents 12–24 months out; constrained supply supports both.
Investment metrics
- 1% rule
- 0.91% ✗
- Cap rate
- 6.56%
- Cash-on-cash
- 0.94%
- DSCR
- 1.04
- GRM
- 9.2
CMA / ARV
- ARV (on-the-fly)
- $383,538
- Comps found
- 12
Show comp detail 12 sales within ~0.75 mi
| Address | Dist | Beds/Ba | Sqft | Sold | Price | $/sf | Match |
|---|---|---|---|---|---|---|---|
| 809 Widgeon Ct | 0.20mi | 3/3.0 | 1,911 (-3%) | 6mo | $730,000 | $382 | 76 |
| 104 Summer Hill Rd | 0.43mi | 3/2.0 | 2,064 (+4%) | 1mo | $330,000 | $160 | 72 |
| 806 Wren Ct | 0.22mi | 3/2.5 | 2,130 (+8%) | 4mo | $228,000 | $107 | 72 |
| 107 Long Spur Ln | 0.40mi | 3/2.5 | 2,010 (+2%) | 6mo | $430,000 | $214 | 71 |
| 107 Rimrock Ln | 0.72mi | 3/2.0 | 2,000 (+1%) | 5mo | $250,000 | $125 | 60 |
| 803 Fetlock Ct | 0.49mi | 3/2.0 | 1,837 (-7%) | 7mo | $290,000 | $158 | 59 |
| 125 Broadmoor Dr | 0.44mi | 3/2.5 | 2,152 (+9%) | 5mo | $335,000 | $156 | 58 |
| 803 Widgeon Ct | 0.28mi | 4/3.0 (+1) | 2,152 (+9%) | 8mo | $702,500 | $326 | 57 |
| 216 Canoebrook Dr | 0.72mi | 3/2.5 | 2,083 (+5%) | 1mo | $405,000 | $194 | 55 |
| 801 Saddlebrook Spur Spur | 0.53mi | 3/2.0 | 1,728 (-13%) | 4mo | $550,500 | $319 | 51 |
| 106 Fetlock Dr | 0.40mi | 3/3.0 | 1,700 (-14%) | 7mo | $255,000 | $150 | 48 |
| 118 Ledgeway Ln | 0.47mi | 3/2.5 | 1,716 (-13%) | 8mo | $399,999 | $233 | 47 |
Match score weights: distance 35% · size 25% · config 20% · recency 20%. Top-matched comps best support the ARV.
Projected returns pro-forma
10.0% appreciation · 3.0% rent growth · sell at horizon
- IRR
- 25.0%
- Equity multiple
- 3.00×
- Total profit
- $250,913
- Equity at exit
- $404,495
- IRR
- 22.0%
- Equity multiple
- 6.84×
- Total profit
- $734,098
- Equity at exit
- $872,308
Cash invested: $125,720 (down + closing). Projections, not guarantees.
Landlord ↔ Tenant lean methodology
- Overall (STATE)
- 62 Landlord-Friendly
- State Pennsylvania
- 62 Landlord-Friendly · EVEN
- County
- — inherits STATE
- City
- — inherits STATE
ZIP-level market 18428
- Home prices YoY
- 9.2%
- Active inventory
- 374
- Price-to-rent
- 9.2×
Monthly cashflow live
- Estimated rent
- $4,085 medium interval (Pro) →
- Mortgage (P&I)
- −$2,355
- Tax from tax record
- −$337 /mo · $4,043/yr
- Insurance
- −$187
- HOA
- −$250
- Vacancy / Maint / Mgmt
- −$858
- Net cashflow
- $99
Break-even live
Sensitivity live
| Price | -10% $353 | -5% $226 | +0% $99 | +5% $-28 | +10% $-155 |
|---|---|---|---|---|---|
| Rent | -10% $-224 | -5% $-62 | +0% $99 | +5% $260 | +10% $422 |
| Rate | -1.0pp $325 | -0.5pp $213 | base $99 | +0.5pp $-17 | +1.0pp $-136 |
UW: 25.0% down · 7.5% · 30yr · 1.5% tax · 5.0% vac · 8.0% maint · 8.0% mgmt
Financing live
Cash to close
- Down payment
- $112,250
- Closing costs
- $13,470
- Reserves months
- —
- Total cash needed
- —
Loan-product check · same deal, 3 products live
Conventional
25% down · 7.5% · 30yr
- Down + closing
- —
- Monthly P&I
- —
- Monthly cashflow
- —
- DSCR
- —
- Eligible?
- —
Personal DTI + credit; lowest rate.
DSCR
20% down · 8.5% · 30yr
- Down + closing
- —
- Monthly P&I
- —
- Monthly cashflow
- —
- DSCR
- —
- Eligible?
- —
No personal income docs; deal must DSCR.
Hard money
10% down · 12.0% · 12mo
- Down + closing
- —
- Monthly P&I
- —
- Monthly cashflow
- —
- DSCR
- —
- Eligible?
- —
Short-term bridge; refi at stabilization.
Rent comps 4 comps
| Address | Beds | Baths | Sqft | Rent | $/sqft | DOM | Units | Dist |
|---|---|---|---|---|---|---|---|---|
| 101 Pommel Dr Hawley, PA | 3.0 | 2.0 | 1691 | $4,400 | $2.60 | 2d | 1 | 0.37mi |
| 402 Canoe Brook Dr Hawley, PA | 3.0 | 2.0 | 2055 | $3,500 | $1.70 | 0d | 1 | 0.90mi |
| 106 Corral Ln Hawley, PA | 3.0 | 2.0 | 2150 | $4,000 | $1.86 | 5d | 1 | 1.19mi |
| 113 Portage Ln Milford, PA | 3.0 | 2.0 | 1400 | $4,000 | $2.86 | 0d | 1 | 1.35mi |
HOA detail
- Monthly dues
- $250 · $3,000/yr
Listing history 20 events
-
2026-04-25status Pending
-
2026-04-17$449,000 Active
-
2026-01-06status Active
-
2025-12-04status Pending
-
2025-11-04status Active
-
2025-10-17status Active
-
2025-10-04status Pending
-
2025-09-25price $425,000
-
2025-07-14status Active
-
2025-06-15status Pending
-
2025-04-19status Active
-
2025-04-16$449,000 Active
-
2024-09-06status Active
-
2024-08-23status Pending
-
2024-07-13$459,000 Active
-
2020-12-31soldstatus
-
2020-12-31soldstatus $310,000
-
2020-11-12$389,000
-
2020-11-12$389,000
-
2000-02-07soldstatus $221,000
ⓘ Source: listings_history table (triggers on properties + properties_extension) + one-shot
backfill from property_details.listing_events for pre-trigger history.
Tax reassessment forecast PA · Partial reset (capped growth)
- Current annual tax
- $4,043 · $337/mo
- Projected year-2 tax
- $5,569 · $464/mo
- Expected delta
- +$1,526/yr (+$127/mo · 37.7%)
ⓘ Screening estimate from a state-policy table — verify with the county assessor before closing.
Climate risk First Street
- Flood 1/10 Low FEMA zone X (unshaded) · 0% chance over 30 yrs
- Wildfire 4/10 Moderate
- Heat 2/10 Low 7 d/yr ≥91°F today · 15 d/yr by 30 yrs out
- Wind 3/10 Moderate 7% chance of damaging wind over 30 yrs
- Air quality 2/10 Low 1 unhealthy d/yr today · 2 by 30 yrs out
Nearby sold comps map
Loading sold comps map…
Walkable amenities ~0.75 mi
Loading nearby amenities…
Taxation est. · year 1
- Rental income
- $49,025
- − Mortgage interest
- −$25,151
- − Property taxes
- −$4,043
- − Insurance
- −$2,245
- − Repairs & maintenance
- −$3,922
- − Management
- −$3,922
- − HOA
- −$3,000
- − Depreciation
- −$13,062
- Taxable loss
- −$6,320
- Est. tax savings @ 24.0%
- +$1,517
- After-tax cash flow
- $2,703/yr
For passive investors: Depreciation is non-cash, so a rental often shows a tax loss while cash-flowing — sheltering income. Rental losses are passive: they offset passive income freely, and up to $25,000/yr can offset ordinary (W-2) income if you actively participate and your MAGI is under $100k (phasing out to $0 by $150k); unused losses carry forward. On sale, claimed depreciation is recaptured at up to 25%, and gains may owe capital-gains tax (a 1031 exchange can defer both). Figures are a year-1 estimate at your 24.0% rate — not tax advice; consult a CPA.
Schools (NCES district)
- District
- Wallenpaupack Area SD
- NCES district ID
- 4224750
- Math proficiency
- 39% ▼ -10.00%
- Reading proficiency
- 59% ▼ -5.00%
- Median HH income
- $51,027
- Composite
- 41.97/100
- National rank
- #3345
- State rank
- #192 of 539 in PA
Livability — Hemlock Farms
- Score
- 68/100
- State rank
- #884
- US rank
- #9421
Category grades
Schools grade is shown separately in the Schools card above.
Census & demographics
- Census place
- Hemlock Farms, PA
- Population (ZIP)
- 12,446
Population outlook (Pike County) Hauer SSP2
- Today (2025)
- 53,548 people
- By 2030
- 51,622 · -3.6%
- By 2040
- 46,490 · -13.2%
- By 2050
- 40,372 · -24.6%
- By 2075
- 31,951 · -40.3%
- By 2100
- 26,821 · -49.9%
Race, ethnicity, and origin ACS 2023
- Neighborhood character
- Predominantly White (85%)
- Race & ethnicity
- White 85% Hispanic / Latino 8% Two or more races 6% Black 1% Asian 1%
- Hispanic origin (detail)
- Puerto Rican 5%
- Common ancestry
- Romanian 5% Portuguese 3% Italian 2%
- Foreign-born
- 5% · Canada
- Languages at home
- 91% English-only · Spanish 5% Russian/Polish/Slavic 1% Other Asian/Pacific 1%
Political lean MEDSL · Pike
- 2024 margin
- Strong R (+24.1) · D 37.6% · R 61.6%
- 2008→2024 swing
- -19.8pp toward R · 2008: -4.2pp · 2024: -24.1pp
- All cycles
- 2024: R+24.1 2020: R+19.0 2016: R+26.0 2012: R+11.0 2008: R+4.2
Not yet ingested
- Civics
- —
Market trends
- HPI YoY
- ▲ 28.60%
- Current HPI
- 340.8254
- Rent YoY
- —
- Metro
- —
- State GDP YoY
- ▲ 1.68%
- F500 in state
- 34
Industry mix (Fortune 500 HQ in PA)
| Industry | F500 HQs | Revenue |
|---|---|---|
| Healthcare | 2 | $309B |
|
||
| Insurance | 2 | $27B |
|
||
| Telecommunications / Media | 1 | $124B |
|
||
| Industrial Distribution | 1 | $22B |
|
||
| Financial Services | 1 | $20B |
|
||
| Chemicals / Materials | 1 | $18B |
|
||
Price history
+103.2% since first listed20 events — show timeline
- 2026-04-25 Pending — PWMLS
- 2026-04-17 Listed $449,000 PWMLS
- 2026-01-06 Relisted — PWMLS
- 2025-12-04 Pending — PWMLS
- 2025-11-04 Relisted — PWMLS
- 2025-10-17 Relisted — PWMLS
- 2025-10-04 Pending — PWMLS
- 2025-09-25 Price Changed $425,000 PWMLS
- 2025-07-14 Relisted — PWMLS
- 2025-06-15 Pending — PWMLS
- 2025-04-19 Relisted — PWMLS
- 2025-04-16 Listed $449,000 PWMLS
- 2024-09-06 Relisted — PWMLS
- 2024-08-23 Pending — PWMLS
- 2024-07-13 Listed $459,000 PWMLS
- 2020-12-31 Sold (MLS) $310,000 PWMLS
- 2020-12-31 Sold (MLS) — PWMLS
- 2020-11-12 Listed $389,000 PWMLS
- 2020-11-12 Listed $389,000 PWMLS
- 2000-02-07 Sold (Public Records) $221,000 Public Records
Property tax history
+2.8%/yrLatest (2026): $4,043 · +3.0% YoY. Source: county tax records.
Cash-flow waterfall
monthlySold comps — $/sqft
last 12 mo · ≤1 miLoading sold comps…