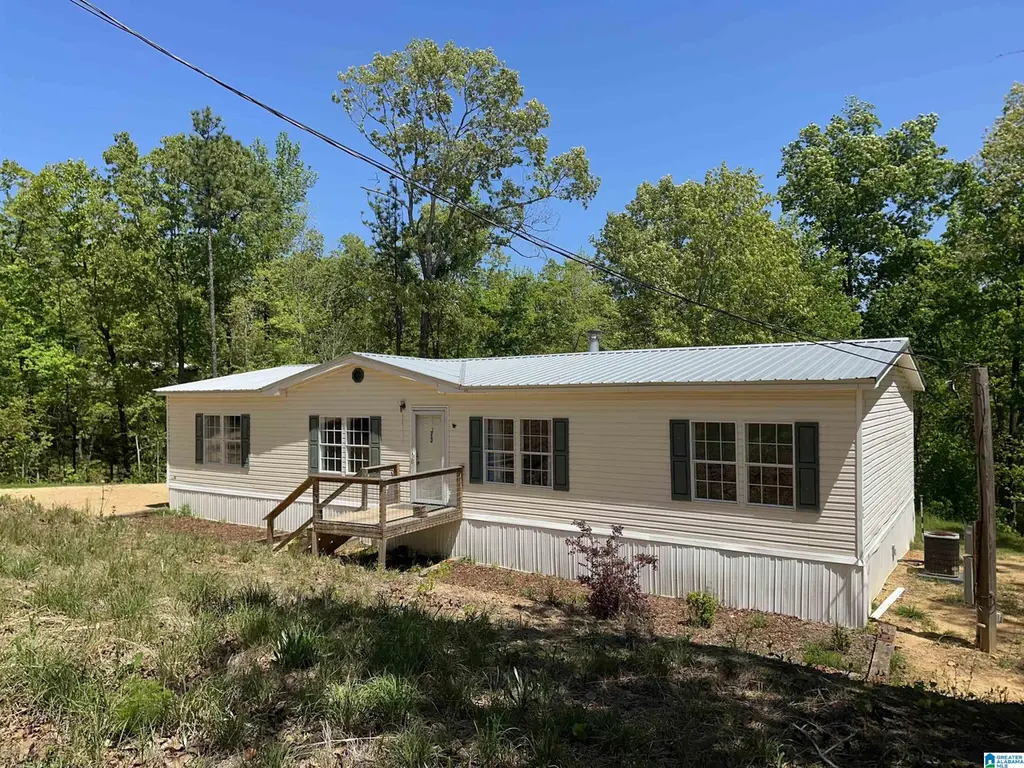
73 Chickadee Dr · Chelsea, AL
Flood risk 1/10 · Minimal
- FEMA flood zone
- X (unshaded)
- Chance of flooding over 30 yrs
- 0.0%
- Est. flood insurance / yr
- $507 – $1,088
Fire risk 6/10 · Moderate
- Est. fire insurance / yr
- $916 – $1,700
Heat risk 6/10 · Moderate
- Hot days now (above 108°F)
- 7 days/yr
- Hot days in 30 yrs
- 19 days/yr
Wind risk 6/10 · Moderate
- Chance of severe wind over 30 yrs
- 27.0%
Air-quality risk 4/10 · Minor
- Unhealthy air days now
- 4 days/yr
- Unhealthy air days in 30 yrs
- 6 days/yr
Risk factors via First Street. Map © Google.
Why this score? — see what drove the B- grade
The composite is a weighted blend of 9 inputs, each scored 0–100. Each bar is that input's sub-score; the figure is the points it added to the 100-point composite (weight × sub-score).
- Cash flow +26.1/30.0
- DSCR +8.8/10.0
- ARV discount +7.5/15.0
- 1% rule +5.9/10.0
- Appreciation +5.3/10.0
- Schools +3.9/10.0
- Livability +3.5/5.0
- Rent growth +2.5/5.0
- Condition / age +2.5/5.0
$199,900
🖨 Deal sheet (PDF) 📄 Offer letter ✓ Due diligence
Listing remarks MLS
Welcome to 73 Chickadee Drive located on Old 280 and zoned for Chelsea schools! NO HOA! This spacious home has 4 bedrooms and 2 bathrooms spread out over 2,100sqft. The kitchen has tons of counter and cabinet space, all appliances, walk-in pantry, eat-in area and access to the back porch. The massive living room has a woodburning fireplace and is open to the kitchen. Private master bedroom with huge walk-in closet and built-in shelves. The master bath has a large garden tub, separate shower and double sinks. The 3 additional bedrooms all have walk-in closets and share a full bath. Enjoy the privacy from the open back porch overlooking almost 2 acres of wooded land.
Key facts
- No hoa
- Walk-in pantry
- 1.78 acre lot
Tags
Neighborhood map
What this means for you Summary
Snapshot
- This is a 4-bed/2.0-bath other listed at $200k.
Deal economics
- At list price, monthly cash flow is $503 ($6k/yr) — positive.
- The deal already cash-flows at list — no discount required.
- Meets the 1% rule at list price ($2k rent vs $200k).
- Recommended offer: $176k (12.0% below list) — sets the bar for market timing.
- Cap rate 9.3% vs local median 4.1% in Chelsea — top-decile yield for the area; either an underpriced asset or a hidden risk that comps aren't pricing in. Stress-test before assuming the spread holds.
Location & tenants
- Location reads 69/100 on livability (#52 in AL) — a middle-class / working-renter tenant base. Strengths: crime A+, employment A+, housing A+; Watch: amenities F, commute F, health & safety F.
- Shelby County (suburban): math 30% / reading 58% proficiency, ranked #16 of 129 in AL (top 12%) — families likely to look elsewhere, expect single-tenant / working-renter base with shorter leases.
- Market conditions: 95 active listings in the ZIP; 5 comparable units currently listed for rent nearby; rentals leasing fast (median 13d on market — plan ~1-2 weeks tenant-placement turnaround); 987 units permitted in Shelby County in 2024 (0 in 5+ unit buildings).
Forward outlook
- In year one you build about $3k of equity ($1k loan paydown + $1k appreciation (0.7% local appreciation)).
- Shelby County population projected at +23% by 2050 — long-run rental-demand tailwind backs the buy-and-hold thesis.
- At projected returns (0.7% appreciation + 3.0% rent growth), your $56k cash investment doubles in ~6 years — after that, you're playing with house money.
- By year 10, paydown + projected appreciation supports a ~$31k cash-out refi (75% LTV) — recoverable capital for the next deal without selling this one.
Negotiation context
- It's been on market 223 days — a 12% lower offer ($176k) is reasonable based on typical stale-listing flexibility.
Risks & watch-outs
- Climate carrying-cost: major wind risk, 27% chance of damaging wind over 30y; major wildfire risk; extreme-heat days projected 7→19/yr by 2055 (HVAC capex compounding) — expect insurance premiums to compound above CPI over the hold.
Questions for the listing agent
- It's been on market 223 days. Have you received any prior offers? Is the seller open to a 12% concession, seller financing, or rate buy-down credit?
- Why hasn't it sold? Are there any deal-killer items the seller is aware of (foundation, flood, title, zoning, code violations)?
- Is there a deadline driving the sale (1031 exchange, divorce, estate, relocation)? That informs how much negotiation room exists.
- Schools are B-rated — typically a magnet for longer-tenancy family renters. What's the average tenant stay here, and is there a school-zone premium baked into asking?
- What's the average days-on-market for RENTAL listings here right now (not sales)? A rising rental-DOM trend means longer vacancies and softer asking-rent achievability than the comps imply.
- What's the recent tenant-quality profile in this submarket — average credit score on applications, eviction rate, late-payment / NSF rate, and stable-employment percentage? A property-management company in the area should have these aggregated.
- How much new for-sale + rental construction is in the pipeline within 1–3 miles? Heavy new supply typically softens prices + rents 12–24 months out; constrained supply supports both.
Investment metrics
- 1% rule
- 1.09% ✓
- Cap rate
- 9.31%
- Cash-on-cash
- 10.78%
- DSCR
- 1.48
- GRM
- 7.7
CMA / ARV
No comps found within radius.
Projected returns pro-forma
0.7% appreciation · 3.0% rent growth · sell at horizon
- IRR
- 11.7%
- Equity multiple
- 1.59×
- Total profit
- $32,752
- Equity at exit
- $65,103
- IRR
- 15.7%
- Equity multiple
- 2.85×
- Total profit
- $103,434
- Equity at exit
- $84,138
Cash invested: $55,972 (down + closing). Projections, not guarantees.
Landlord ↔ Tenant lean methodology
- Overall (STATE)
- 90 Strongly Landlord-Friendly
- State Alabama
- 90 Strongly Landlord-Friendly · R+15
- County
- — inherits STATE
- City
- — inherits STATE
ZIP-level market 35147
- Home prices YoY
- 0.3%
- Active inventory
- 95
- Price-to-rent
- 7.7×
Monthly cashflow live
- Estimated rent
- $2,171 high interval (Pro) →
- Mortgage (P&I)
- −$1,048
- Tax from tax record
- −$81 /mo · $969/yr
- Insurance
- −$83
- HOA
- −$0
- Vacancy / Maint / Mgmt
- −$456
- Net cashflow
- $503
Break-even live
Sensitivity live
| Price | -10% $616 | -5% $560 | +0% $503 | +5% $446 | +10% $390 |
|---|---|---|---|---|---|
| Rent | -10% $331 | -5% $417 | +0% $503 | +5% $589 | +10% $675 |
| Rate | -1.0pp $604 | -0.5pp $554 | base $503 | +0.5pp $451 | +1.0pp $399 |
UW: 25.0% down · 7.5% · 30yr · 1.5% tax · 5.0% vac · 8.0% maint · 8.0% mgmt
Financing live
Cash to close
- Down payment
- $49,975
- Closing costs
- $5,997
- Reserves months
- —
- Total cash needed
- —
Loan-product check · same deal, 3 products live
Conventional
25% down · 7.5% · 30yr
- Down + closing
- —
- Monthly P&I
- —
- Monthly cashflow
- —
- DSCR
- —
- Eligible?
- —
Personal DTI + credit; lowest rate.
DSCR
20% down · 8.5% · 30yr
- Down + closing
- —
- Monthly P&I
- —
- Monthly cashflow
- —
- DSCR
- —
- Eligible?
- —
No personal income docs; deal must DSCR.
Hard money
10% down · 12.0% · 12mo
- Down + closing
- —
- Monthly P&I
- —
- Monthly cashflow
- —
- DSCR
- —
- Eligible?
- —
Short-term bridge; refi at stabilization.
Rent comps 5 comps
| Address | Beds | Baths | Sqft | Rent | $/sqft | DOM | Units | Dist |
|---|---|---|---|---|---|---|---|---|
| 204 Chelsea Park Rd Chelsea, AL | 5.0 | 3.0 | 2382 | $2,150 | $0.90 | 17d | 1 | 0.85mi |
| 173 Chelsea Park Rd Chelsea, AL | 3.0 | 2.0 | 1694 | $2,070 | $1.22 | 4d | 1 | 0.91mi |
| 464 Crossbridge Rd Chelsea, AL | 4.0 | 2.5 | 1858 | $2,175 | $1.17 | 12d | 1 | 0.92mi |
| 224 Park Crest Run Chelsea, AL | 4.0 | 2.0 | 1774 | $2,195 | $1.24 | 4d | 1 | 1.10mi |
| 4072 Park Crossings Dr Chelsea, AL | 4.0 | 2.5 | 2344 | $2,296 | $0.98 | 44d | 1 | 1.24mi |
Listing history 16 events
-
2026-06-15days on market $199,900 Active 223 DOM
-
2026-06-13days on market $199,900 Active 221 DOM
-
2026-06-13days on market $199,900 Active 220 DOM
-
2026-06-10days on market $199,900 Active 218 DOM
-
2026-06-09days on market $199,900 Active 217 DOM
-
2026-06-08days on market $199,900 Active 216 DOM
-
2026-06-07days on market $199,900 Active 215 DOM
-
2026-06-05days on market $199,900 Active 212 DOM
-
2026-06-03days on market $199,900 Active 211 DOM
-
2026-06-02days on market $199,900 Active 210 DOM
-
2026-06-01days on market $199,900 Active 209 DOM
-
2026-05-31days on market $199,900 Active 208 DOM
-
2025-11-04$199,900 Active 673-char remark
Show marketing remark (673 chars)
Welcome to 73 Chickadee Drive located on Old 280 and zoned for Chelsea schools! NO HOA! This spacious home has 4 bedrooms and 2 bathrooms spread out over 2,100sqft. The kitchen has tons of counter and cabinet space, all appliances, walk-in pantry, eat-in area and access to the back porch. The massive living room has a woodburning fireplace and is open to the kitchen. Private master bedroom with huge walk-in closet and built-in shelves. The master bath has a large garden tub, separate shower and double sinks. The 3 additional bedrooms all have walk-in closets and share a full bath. Enjoy the privacy from the open back porch overlooking almost 2 acres of wooded land.
-
2025-05-09price $200,000
-
2025-03-26price $205,000
-
2025-02-27price $215,000
ⓘ Source: listings_history table (triggers on properties + properties_extension) + one-shot
backfill from property_details.listing_events for pre-trigger history.
Tax reassessment forecast AL · Resets to sale price
- Current annual tax
- $969 · $81/mo
- Projected year-2 tax
- $969 · $81/mo
- Expected delta
- $0/yr ($0/mo · 0.0%)
ⓘ Screening estimate from a state-policy table — verify with the county assessor before closing.
Climate risk First Street
- Flood 1/10 Low FEMA zone X (unshaded) · 0% chance over 30 yrs
- Wildfire 6/10 Major
- Heat 6/10 Major 7 d/yr ≥108°F today · 19 d/yr by 30 yrs out
- Wind 6/10 Major 27% chance of damaging wind over 30 yrs
- Air quality 4/10 Moderate 4 unhealthy d/yr today · 6 by 30 yrs out
Nearby sold comps map
Loading sold comps map…
Walkable amenities ~0.75 mi
Loading nearby amenities…
Taxation est. · year 1
- Rental income
- $26,056
- − Mortgage interest
- −$11,198
- − Property taxes
- −$969
- − Insurance
- −$1,000
- − Repairs & maintenance
- −$2,084
- − Management
- −$2,084
- − Depreciation
- −$5,815
- Taxable income
- $2,906
- Est. tax owed @ 24.0%
- −$697
- After-tax cash flow
- $5,339/yr
For passive investors: Depreciation is non-cash, so a rental often shows a tax loss while cash-flowing — sheltering income. Rental losses are passive: they offset passive income freely, and up to $25,000/yr can offset ordinary (W-2) income if you actively participate and your MAGI is under $100k (phasing out to $0 by $150k); unused losses carry forward. On sale, claimed depreciation is recaptured at up to 25%, and gains may owe capital-gains tax (a 1031 exchange can defer both). Figures are a year-1 estimate at your 24.0% rate — not tax advice; consult a CPA.
Schools (NCES district)
- District
- Shelby County
- NCES district ID
- 0103030
- Math proficiency
- 30% ▼ -28.00%
- Reading proficiency
- 58% ▲ 2.00%
- Median HH income
- $66,672
- Composite
- 39.29/100
- National rank
- #3995
- State rank
- #16 of 129 in AL
Livability — Chelsea
- Score
- 69/100
- State rank
- #52
- US rank
- #8363
Category grades
Schools grade is shown separately in the Schools card above.
Census & demographics
- City population
- 15,068
- Population (ZIP)
- 6,971
Population outlook (Shelby County) Hauer SSP2
- Today (2025)
- 237,024 people
- By 2030
- 249,868 · +5.4%
- By 2040
- 272,778 · +15.1%
- By 2050
- 291,062 · +22.8%
- By 2075
- 326,049 · +37.6%
- By 2100
- 335,870 · +41.7%
Race, ethnicity, and origin ACS 2023
- Neighborhood character
- Predominantly White (76%)
- Race & ethnicity
- White 76% Hispanic / Latino 10% Black 10% Two or more races 10%
- Hispanic origin (detail)
- Mexican 6%
- Common ancestry
- Serbian 3% Slovak 1% Lithuanian 1%
- Foreign-born
- 4% · Canada
- Languages at home
- 90% English-only · Spanish 9%
Political lean MEDSL · Shelby
- 2024 margin
- Solid R (+40.9) · D 29.0% · R 69.9% · Other 1.1%
- 2008→2024 swing
- +12.6pp toward D · 2008: -53.4pp · 2024: -40.9pp
- All cycles
- 2024: R+40.9 2020: R+40.4 2016: R+50.3 2012: R+55.6 2008: R+53.4
Not yet ingested
- Civics
- —
Market trends
- HPI YoY
- ▲ 0.70%
- Current HPI
- 200.0103
- Rent YoY
- —
- Metro
- —
- State GDP YoY
- ▲ 2.94%
- F500 in state
- 4
Industry mix (Fortune 500 HQ in AL)
| Industry | F500 HQs | Revenue |
|---|---|---|
| Financial Services | 1 | $8B |
|
||
| Healthcare | 1 | $5B |
|
||
Price history
-7.0% since first listed4 events — show timeline
- 2025-11-04 Listed $199,900 Greater Alabama MLS
- 2025-05-09 Price Changed $200,000 Greater Alabama MLS
- 2025-03-26 Price Changed $205,000 Greater Alabama MLS
- 2025-02-27 Price Changed $215,000 Greater Alabama MLS
Property tax history
+89.0%/yrLatest (2025): $969 · +5.4% YoY. Source: county tax records.
Cash-flow waterfall
monthlySold comps — $/sqft
last 12 mo · ≤1 miLoading sold comps…