 🏷️ Likely Rental
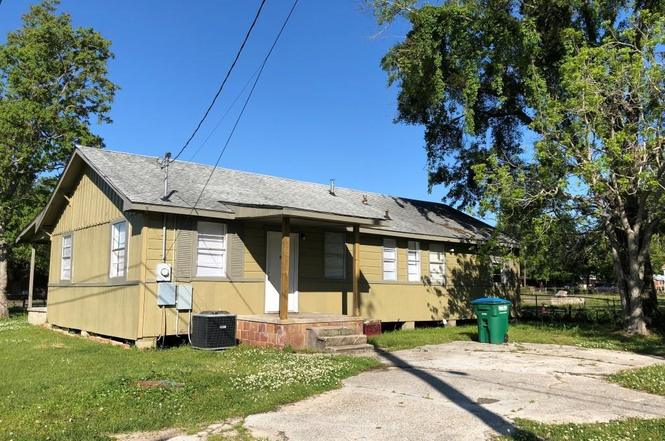
1412 Jo Ellen Cir · Gulfport, MS
Flood risk 3/10 · Minor
- FEMA flood zone
- AE
- Chance of flooding over 30 yrs
- 0.2%
- Est. flood insurance / yr
- $1,737 – $8,500
Fire risk 1/10 · Minimal
- Est. fire insurance / yr
- $1,241 – $2,305
Heat risk 10/10 · Severe
- Hot days now (above 106°F)
- 7 days/yr
- Hot days in 30 yrs
- 23 days/yr
Wind risk 9/10 · Severe
- Chance of severe wind over 30 yrs
- 99.0%
Air-quality risk 1/10 · Minimal
- Unhealthy air days now
- 0 days/yr
- Unhealthy air days in 30 yrs
- 0 days/yr
Risk factors via First Street. Map © Google.
Why this score? — see what drove the B grade
The composite is a weighted blend of 9 inputs, each scored 0–100. Each bar is that input's sub-score; the figure is the points it added to the 100-point composite (weight × sub-score).
- Cash flow +30.0/30.0
- 1% rule +10.0/10.0
- DSCR +10.0/10.0
- ARV discount +7.5/15.0
- Rent growth +5.0/5.0
- Livability +3.7/5.0
- Schools +3.4/10.0
- Condition / age +2.5/5.0
- Appreciation +0.0/10.0
$83,000
🖨 Deal sheet (PDF) 📄 Offer letter ✓ Due diligence
Listing remarks
Don't miss this great investment opporunity. This home has been a rental in our portfolio for 5 years. and is currently cash flowing. The Seller has kept the property well maintained. Improvments include recent paint, flooring thru out, light fixtures and appliances. The electrical and plumbing systems are current and the exterior siding has been replaced. HVAC is 5 years old. Roof was replaced 12months ago. Receive your first rent payment at closing. This tenant occupied property is cash flowing at $1050/month. Current lease expires 05/31/2027.
Key facts
- Plumbing systems
- Appliances
- Recent paint
Tags
Property features AI
Exterior
- Parking: Driveway
- Utilities: Public water; Public sewer; Cable available
- Home design: Single-family house; One story; Living area reported from public records
- Construction: Siding exterior; Pillar/post/pier foundation; Asphalt roof; Built (year reported from public records)
- Exterior features: Front-yard fencing; Porch
Interior
- Kitchen: Oven; Refrigerator
- Bedrooms: Family room (listed as a main living area)
- Flooring: Vinyl flooring
- Bathrooms: 1 full bathroom; 1 half bathroom (1.5 total)
- Heating & cooling: Central heating (electric); Central air conditioning (electric)
- Interior features: Ceiling fans
Neighborhood map
What this means for you Summary
Snapshot
- This is a 3-bed/1.5-bath single-family listed at $83k.
Deal economics
- At list price, monthly cash flow is $96 ($1k/yr) — positive.
- The deal already cash-flows at list — no discount required.
- Meets the 1% rule at list price ($1k rent vs $83k).
- Recommended offer: $78k (6.0% below list) — sets the bar for market timing.
- Cap rate 13.8% vs local median 4.9% in Gulfport — top-decile yield for the area; either an underpriced asset or a hidden risk that comps aren't pricing in. Stress-test before assuming the spread holds.
Location & tenants
- Location reads 73/100 on livability (#15 in MS) — a middle-class / working-renter tenant base. Strengths: cost of living A+, housing A+, health & safety A+; Watch: amenities F, commute F, employment F.
- Gulfport School District (urban): math 41% / reading 42% proficiency, ranked #37 of 130 in MS (top 28%) — families likely to look elsewhere, expect single-tenant / working-renter base with shorter leases; 67% free/reduced lunch — lower-income household profile, screen leases tightly.
- Zoned schools: Gulfport Central Middle School (math 20% / reading 23%, grade F, #109 of 179 statewide, top 62%, 585 students, 100% FRL); Gulfport High School (math 42% / reading 36%, grade F, #54 of 197 statewide, top 28%, 1,728 students, 100% FRL) — zoned schools average 100% FRL vs 67% district-wide (33 pts higher); higher-poverty schools than district average — tighter screening recommended.
- Market conditions: Rents rising fast (+10.5%/yr); 254 active listings in the ZIP; 14 comparable units currently listed for rent nearby; rentals lingering (median 46d on market — plan ~5-8 weeks vacancy on turnover, expect pricing pressure); 50% of comp listings sitting > 30 days — soft ceiling on asking rent; lower-income renter base — watch delinquency; 2,194 units permitted in Harrison County in 2024 (0 in 5+ unit buildings).
Forward outlook
- Local home prices are declining (-3.0%/yr); year-one equity from $574 of loan paydown is wiped out by about $2k of value loss. Plan a longer hold.
- Harrison County population projected at +27% by 2050 — long-run rental-demand tailwind backs the buy-and-hold thesis.
- At projected returns (-3.0% appreciation + 8.0% rent growth), your $23k cash investment doubles in ~8 years — after that, you're playing with house money.
Negotiation context
- It's been on market 71 days — a 6% lower offer ($78k) is reasonable based on typical stale-listing flexibility.
- 9 sale attempts since 12y ago; this cycle's ask is 7805% above the opening price — seller raised mid-cycle; expect resistance to lowballs.
- Current owner paid $32k; list at $83k implies a 155% gain — meaningful room to come down on a strong offer.
Risks & watch-outs
- Watch-outs: flood insurance adds $427/mo.
- Climate carrying-cost: in FEMA flood zone AE (mandatory federal flood insurance); severe wind risk, 99% chance of damaging wind over 30y; extreme-heat days projected 7→23/yr by 2055 (HVAC capex compounding) — expect insurance premiums to compound above CPI over the hold.
Questions for the listing agent
- It's been on market 71 days. Have you received any prior offers? Is the seller open to a 6% concession, seller financing, or rate buy-down credit?
- Built in 1965 — when were the roof, HVAC, electrical panel, plumbing, and water heater last replaced?
- What's the actual annual flood-insurance premium (NFIP or private), and is the property in a SFHA with mandatory coverage?
- Why hasn't it sold? Are there any deal-killer items the seller is aware of (foundation, flood, title, zoning, code violations)?
- Is there a deadline driving the sale (1031 exchange, divorce, estate, relocation)? That informs how much negotiation room exists.
- Schools are D-rated, which usually means shorter tenancies and higher turnover. Who's the typical renter profile here, and what's been the actual vacancy rate?
- What's the average days-on-market for RENTAL listings here right now (not sales)? A rising rental-DOM trend means longer vacancies and softer asking-rent achievability than the comps imply.
- What's the recent tenant-quality profile in this submarket — average credit score on applications, eviction rate, late-payment / NSF rate, and stable-employment percentage? A property-management company in the area should have these aggregated.
- How much new for-sale + rental construction is in the pipeline within 1–3 miles? Heavy new supply typically softens prices + rents 12–24 months out; constrained supply supports both.
Investment metrics
- 1% rule
- 1.63% ✓
- Cap rate
- 13.84%
- Cash-on-cash
- 26.96%
- DSCR
- 2.20
- GRM
- 5.1
CMA / ARV
- ARV (on-the-fly)
- $181,050
- Comps found
- 12
Show comp detail 12 sales within ~0.75 mi
| Address | Dist | Beds/Ba | Sqft | Sold | Price | $/sf | Match |
|---|---|---|---|---|---|---|---|
| 1601 Lewis Ave | 0.41mi | 4/2.0 (+1) | 1,300 (+2%) | 1mo | $145,000 | $112 | 70 |
| 1710 62nd Ave | 0.47mi | 3/2.0 | 1,315 (+3%) | 9mo | $169,400 | $129 | 63 |
| 4340 Betts Cir | 0.67mi | 3/1.5 | 1,305 (+2%) | 2mo | $129,900 | $100 | 63 |
| 828 Woodward Ave | 0.57mi | 2/1.0 (-1) | 1,286 (+1%) | 5mo | $217,900 | $169 | 61 |
| 1015 Joseph Ave | 0.40mi | 3/1.0 | 1,161 (-9%) | 5mo | $139,000 | $120 | 61 |
| 1523 Stewart Ave | 0.26mi | 3/2.0 | 1,127 (-12%) | 8mo | $160,000 | $142 | 60 |
| 1608 Lewis Ave | 0.39mi | 3/2.0 | 1,100 (-14%) | 0mo | $115,000 | $105 | 57 |
| 1209 E Old Pass Rd | 0.56mi | 3/2.0 | 1,408 (+10%) | 1mo | $217,000 | $154 | 54 |
| 1920 49th Ave | 0.59mi | 3/1.0 | 1,421 (+12%) | 5mo | $115,000 | $81 | 47 |
| 721 Regnault Ave | 0.56mi | 2/2.0 (-1) | 1,100 (-14%) | 1mo | $269,000 | $245 | 44 |
| 801 Allendale Ave | 0.59mi | 2/1.0 (-1) | 1,110 (-13%) | 1mo | $165,000 | $149 | 44 |
| 1158 E Old Pass Rd | 0.69mi | 4/1.0 (+1) | 1,206 (-5%) | 13mo | $189,000 | $157 | 41 |
Match score weights: distance 35% · size 25% · config 20% · recency 20%. Top-matched comps best support the ARV.
Projected returns pro-forma
-3.0% appreciation · 8.0% rent growth · sell at horizon
- IRR
- 0.0%
- Equity multiple
- 1.00×
- Total profit
- $41
- Equity at exit
- $12,376
- IRR
- 16.2%
- Equity multiple
- 2.78×
- Total profit
- $41,453
- Equity at exit
- $7,176
Cash invested: $23,240 (down + closing). Projections, not guarantees.
Landlord ↔ Tenant lean methodology
- Overall (STATE)
- 90 Strongly Landlord-Friendly
- State Mississippi
- 90 Strongly Landlord-Friendly · R+11
- County
- — inherits STATE
- City
- — inherits STATE
ZIP-level market 39501
- Home prices YoY
- -34.5%
- Rents YoY
- 10.5%
- Active inventory
- 254
- Price-to-rent
- 5.1×
Monthly cashflow live
- Estimated rent
- $1,351 high interval (Pro) →
- Mortgage (P&I)
- −$435
- Tax from tax record
- −$76 /mo · $908/yr
- Insurance
- −$35
- Flood insurance flood zone
- −$427 /mo · $5,118/yr
- HOA
- −$0
- Vacancy / Maint / Mgmt
- −$284
- Net cashflow
- $96
Break-even live
Sensitivity live
| Price | -10% $143 | -5% $119 | +0% $96 | +5% $72 | +10% $49 |
|---|---|---|---|---|---|
| Rent | -10% $-11 | -5% $42 | +0% $96 | +5% $149 | +10% $202 |
| Rate | -1.0pp $137 | -0.5pp $117 | base $96 | +0.5pp $74 | +1.0pp $52 |
UW: 25.0% down · 7.5% · 30yr · 1.5% tax · 5.0% vac · 8.0% maint · 8.0% mgmt
Financing live
Cash to close
- Down payment
- $20,750
- Closing costs
- $2,490
- Reserves months
- —
- Total cash needed
- —
Loan-product check · same deal, 3 products live
Conventional
25% down · 7.5% · 30yr
- Down + closing
- —
- Monthly P&I
- —
- Monthly cashflow
- —
- DSCR
- —
- Eligible?
- —
Personal DTI + credit; lowest rate.
DSCR
20% down · 8.5% · 30yr
- Down + closing
- —
- Monthly P&I
- —
- Monthly cashflow
- —
- DSCR
- —
- Eligible?
- —
No personal income docs; deal must DSCR.
Hard money
10% down · 12.0% · 12mo
- Down + closing
- —
- Monthly P&I
- —
- Monthly cashflow
- —
- DSCR
- —
- Eligible?
- —
Short-term bridge; refi at stabilization.
Rent comps 14 comps
| Address | Beds | Baths | Sqft | Rent | $/sqft | DOM | Units | Dist |
|---|---|---|---|---|---|---|---|---|
| 1412 Jo Ellen Cir Gulfport, MS | 3.0 | 1.5 | 1275 | $1,050 | $0.82 | 15d | 1 | 0.04mi |
| 1206 Beach Ave Gulfport, MS | 3.0 | 2.0 | 1076 | $1,500 | $1.39 | 15d | 1 | 0.22mi |
| 1129 Woodward Ave Gulfport, MS | 3.0 | 1.0 | 1719 | $1,300 | $0.76 | 15d | 1 | 0.38mi |
| 4409 Ford St Gulfport, MS | 2.0 | 1.0 | 1000 | $1,500 | $1.50 | 45d | 1 | 0.69mi |
| 4319 Lewis St Gulfport, MS | 3.0 | 2.0 | 1371 | $1,649 | $1.20 | 15d | 1 | 0.71mi |
| 1221 42nd Ave Gulfport, MS | 3.0 | 1.0 | 1000 | $1,400 | $1.40 | 45d | 1 | 0.80mi |
| 4115 8th St Gulfport, MS | 2.0 | 2.5 | 1514 | $2,375 | $1.57 | 45d | 1 | 0.87mi |
| 4115 8th St Gulfport, MS | 2.0 | 2.5 | 1514 | $2,375 | $1.57 | 15d | 1 | 0.87mi |
| 3633 Southward Dr Gulfport, MS | 2.0 | 2.0 | 900 | $1,000 | $1.11 | 45d | 1 | 1.13mi |
| 1513 34th Ave Gulfport, MS | 2.0 | 2.0 | 884 | $1,250 | $1.41 | 45d | 1 | 1.36mi |
| 3305 12th St Gulfport, MS | 2.0 | 1.5 | 1100 | $1,295 | $1.18 | 45d | 1 | 1.38mi |
| 2986 58th Ave Gulfport, MS | 3.0 | 2.0 | 1153 | $1,295 | $1.12 | 15d | 1 | 1.41mi |
| 1106 32nd Ave Gulfport, MS | 3.0 | 2.0 | 1200 | $1,300 | $1.08 | 45d | 1 | 1.50mi |
| 3008 50th Ave Gulfport, MS | 3.0 | 2.0 | 1054 | $1,050 | $1.00 | 15d | 1 | 1.50mi |
Listing history 8 events
-
2026-06-22days on market $83,000 Active 71 DOM
-
2026-06-18days on market $83,000 Active 68 DOM
-
2026-06-17days on market $83,000 Active 67 DOM
-
2026-06-16days on market $83,000 Active 66 DOM
-
2026-06-15days on market $83,000 Active 65 DOM
-
2026-06-14days on market $83,000 Active 63 DOM
-
2026-06-13remarks 552-char remark
-
2026-06-13$83,000 Active 62 DOM
ⓘ Source: listings_history table (triggers on properties + properties_extension) + one-shot
backfill from property_details.listing_events for pre-trigger history.
Tax reassessment forecast MS · Resets to sale price
- Current annual tax
- $908 · $76/mo
- Projected year-2 tax
- $908 · $76/mo
- Expected delta
- $0/yr ($0/mo · 0.0%)
ⓘ Screening estimate from a state-policy table — verify with the county assessor before closing.
Climate risk First Street
- Flood 3/10 Moderate FEMA zone AE · 20% chance over 30 yrs
- Wildfire 1/10 Low
- Heat 10/10 Extreme 7 d/yr ≥106°F today · 23 d/yr by 30 yrs out
- Wind 9/10 Extreme 99% chance of damaging wind over 30 yrs
- Air quality 1/10 Low 0 unhealthy d/yr today · 0 by 30 yrs out
Nearby sold comps map
Loading sold comps map…
Walkable amenities ~0.75 mi
Loading nearby amenities…
Taxation est. · year 1
- Rental income
- $16,217
- − Mortgage interest
- −$4,649
- − Property taxes
- −$908
- − Insurance
- −$5,534
- − Repairs & maintenance
- −$1,297
- − Management
- −$1,297
- − Depreciation
- −$2,415
- Taxable income
- $116
- Est. tax owed @ 24.0%
- −$28
- After-tax cash flow
- $1,118/yr
For passive investors: Depreciation is non-cash, so a rental often shows a tax loss while cash-flowing — sheltering income. Rental losses are passive: they offset passive income freely, and up to $25,000/yr can offset ordinary (W-2) income if you actively participate and your MAGI is under $100k (phasing out to $0 by $150k); unused losses carry forward. On sale, claimed depreciation is recaptured at up to 25%, and gains may owe capital-gains tax (a 1031 exchange can defer both). Figures are a year-1 estimate at your 24.0% rate — not tax advice; consult a CPA.
Schools (NCES district)
- District
- Gulfport School District
- NCES district ID
- 2801710
- Math proficiency
- 41% ▼ -15.00%
- Reading proficiency
- 42% ▼ -6.00%
- Median HH income
- $35,712
- Composite
- 34.38/100
- National rank
- #5213
- State rank
- #37 of 130 in MS
Livability — Gulfport
- Score
- 73/100
- State rank
- #15
- US rank
- #5010
Category grades
Schools grade is shown separately in the Schools card above.
Census & demographics
- Census place
- Gulfport, MS
- County
- Harrison County · 178,171 people
- City population
- 96,188
- Metro
- Gulfport-Biloxi, MS
- Population (ZIP)
- 22,565
- Household income
- $34,758
- Rent vs Own
- Severe rent burden
- 1516.0
Population outlook (Harrison County) Hauer SSP2
- Today (2025)
- 228,444 people
- By 2030
- 241,942 · +5.9%
- By 2040
- 267,531 · +17.1%
- By 2050
- 291,062 · +27.4%
- By 2075
- 346,711 · +51.8%
- By 2100
- 378,165 · +65.5%
Race, ethnicity, and origin ACS 2023
- Neighborhood character
- Diverse neighborhood (Simpson 0.56)
- Race & ethnicity
- Black 59% White 29% Two or more races 7% Hispanic / Latino 5%
- Hispanic origin (detail)
- Mexican 2%
- Common ancestry
- Lithuanian 2% Serbian 1% Slovak 1%
- Foreign-born
- 2% · Canada
- Languages at home
- 95% English-only · Spanish 4%
Political lean MEDSL · Harrison
- 2024 margin
- Strong R (+28.9) · D 35.0% · R 63.9% · Other 1.1%
- 2008→2024 swing
- -2.9pp toward R · 2008: -26.0pp · 2024: -28.9pp
- All cycles
- 2024: R+28.9 2020: R+25.2 2016: R+30.7 2012: R+26.6 2008: R+26.0
Not yet ingested
- Civics
- —
Market trends
- HPI YoY
- ▼ -110.16%
- Current HPI
- 208.998
- Rent YoY
- ▲ 10.49%
- Metro
- Gulfport-Biloxi, MS
- State GDP YoY
- —
- F500 in state
- 0
Price history
-95.9% since first listed22 events — show timeline
- 2026-06-14 Rental Removed $1,050 APPFOLIO
- 2026-06-12 Relisted — MLSU
- 2026-05-30 Listed for Rent $1,050 APPFOLIO
- 2025-09-08 Relisted — MLSU
- 2025-08-26 Pending — MLSU
- 2025-08-26 Listing Removed — MLSU
- 2025-08-26 Listing Removed — MLSU
- 2025-06-24 Listed $83,000 MLSU
- 2025-04-11 Listing Removed — MLSU
- 2025-01-27 Rental Removed $1,000 APPFOLIO
- 2025-01-10 Listed for Rent $1,000 APPFOLIO
- 2024-04-12 Listed $83,000 MLSU
- 2021-10-01 Listing Removed — MLSU
- 2021-10-01 Listing Removed — MLSU
- 2021-03-18 Listed $65,000 MLSU
- 2018-01-29 Sold (Public Records) $32,500 Public Records
- 2018-01-19 Sold (MLS) — MLSU
- 2017-10-27 Listed $34,999 MLSU
- 2017-09-27 Sold (Public Records) — Public Records
- 2016-05-04 Sold (Public Records) — Public Records
- 2014-02-01 Listed $25,900 MLSU
- 2013-04-12 Sold (Public Records) — Public Records
Property tax history
+1.0%/yrLatest (2025): $908 · +4.3% YoY. Source: county tax records.
Cash-flow waterfall
monthlySold comps — $/sqft
last 12 mo · ≤1 miLoading sold comps…