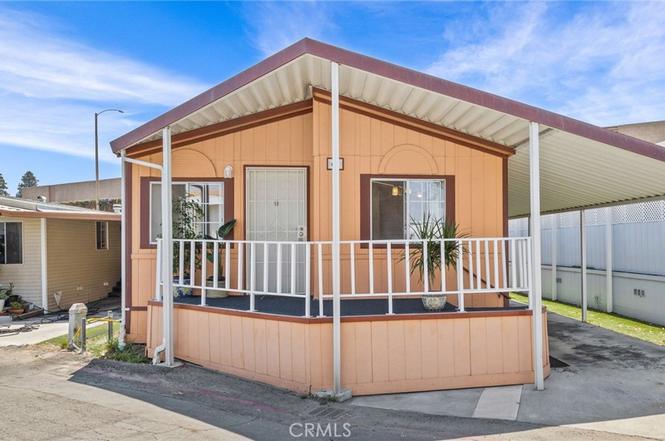
17261 GOTHARD St #67 · Huntington Beach, CA
Flood risk 10/10 · Severe
- FEMA flood zone
- X
- Chance of flooding over 30 yrs
- 0.99%
- Est. flood insurance / yr
- $507 – $1,088
Fire risk 1/10 · Minimal
- Est. fire insurance / yr
- $659 – $1,223
Heat risk 5/10 · Moderate
- Hot days now (above 85°F)
- 7 days/yr
- Hot days in 30 yrs
- 23 days/yr
Wind risk 1/10 · Minimal
- Chance of severe wind over 30 yrs
- —
Air-quality risk 4/10 · Minor
- Unhealthy air days now
- 5 days/yr
- Unhealthy air days in 30 yrs
- 7 days/yr
Risk factors via First Street. Map © Google.
Why this score? — see what drove the B+ grade
The composite is a weighted blend of 9 inputs, each scored 0–100. Each bar is that input's sub-score; the figure is the points it added to the 100-point composite (weight × sub-score).
- Cash flow +30.0/30.0
- ARV discount +15.0/15.0
- 1% rule +10.0/10.0
- DSCR +10.0/10.0
- Schools +5.5/10.0
- Livability +3.4/5.0
- Rent growth +2.8/5.0
- Condition / age +2.5/5.0
- Appreciation +0.0/10.0
$110,000
🖨 Deal sheet 📄 Offer letter ✓ Due diligence
Listing remarks
PRICE IMPROVEMENT! Welcome to Beachview Mobile Home Park, a serene 55+/45 age-restricted community in Huntington Beach. This charming home offers a comfortable living space with Cathedral ceiling, two bedrooms and two bathrooms. Notable features include a pantry, an indoor laundry room, and window coverings for added privacy. The dual-pane windows enhance energy efficiency, while carpeting in the living room, hallway, and bedrooms creates a cozy atmosphere. The owner's suite boasts a convenient curb-less shower, and the kitchen is equipped with a Frigidaire refrigerator, Microwave, Magic Chef range, and a dishwasher. Additionally, the property includes a washer and dryer, along with two sto
Key facts
- Curb-less shower
- Dual-pane windows
- Two storage sheds
Tags
Property features AI
Finance
- Other: Park name: BEACHVIEW MHP; Access via city streets; paved road frontage
- Financial info: Monthly land lease: $1,950 (park-provided amount; buyer to verify)
- HOA & community: Senior community; Manager approval required; Pets: call for details; Community features include biking and street lighting; Located in Beachview MHP (land lease park)
Exterior
- Parking: Assigned carport spaces; Attached carport with 2 parking spaces
- Utilities: Natural gas connected; Electricity on property and connected; Water connected (District/Public); Public sewer / sewer connected; Cable available; Telephone in street
- Home design: Single-story mobile home (Model: LAKE SPRINGS); Entry at front door; One level; Mobile dimensions approximately 20' x 48'; Mobile home remains; Shingle roof
- Construction: Masonite exterior; Pier jacks foundation; Built (year per public records)
- Exterior features: Covered front porch; Deck; Patio; Association pool access; Two sheds; Zero lot line; No fencing; Wood skirt
Interior
- Kitchen: Gas range and gas oven; Microwave; Refrigerator; Dishwasher; Laminate counters; Gas water heater
- Bedrooms: All bedrooms on main floor; Main floor bedroom
- Flooring: Vinyl flooring; Carpet
- Bathrooms: 2 full bathrooms; Bathrooms with shower in tub, walk-in shower, exhaust fan(s), and laminate counters
- Heating & cooling: Central furnace
- Interior features: Turnkey condition; High ceilings (9 feet+); Pantry; Double pane windows; Unfurnished
- Laundry & utility: Inside laundry; Washer included; Dryer included; Water heater unit
Neighborhood map
What this means for you Summary
Snapshot
- This is a 2-bed/2.0-bath manufactured listed at $110k.
Deal economics
- At list price, monthly cash flow is $1k ($15k/yr) — positive.
- The deal already cash-flows at list — no discount required.
- Meets the 1% rule at list price ($3k rent vs $110k).
- Recommended offer: $97k (12.0% below list) — sets the bar for market timing.
- Cap rate 21.1% vs local median 1.6% in Huntington Beach — top-decile yield for the area; either an underpriced asset or a hidden risk that comps aren't pricing in. Stress-test before assuming the spread holds.
Location & tenants
- Location reads 67/100 on livability (#306 in CA) — a middle-class / working-renter tenant base. Strengths: employment A+, commute A-, schools B+; Watch: amenities C-, cost of living F, health & safety F.
- Ocean View (suburban): math 57% / reading 63% proficiency, ranked #207 of 1,400 in CA (top 15%) — acceptable for families but not a draw, mixed tenant base, ~2y average lease.
- Market conditions: Rents rising (+1.2%/yr); 75 active listings in the ZIP; 40 comparable units currently listed for rent nearby; rentals leasing fast (median 1d on market — plan ~1-2 weeks tenant-placement turnaround); solid renter incomes; 6,974 units permitted in Orange County in 2024 (3,839 in 5+ unit buildings).
- This rent runs 31% of the median local income ($105k/yr) — at the standard rent-burdened threshold; future hikes will face affordability resistance.
Forward outlook
- Local home prices are declining (-3.0%/yr); year-one equity from $761 of loan paydown is wiped out by about $3k of value loss. Plan a longer hold.
- Orange County population projected at +14% by 2050 — modest demand growth; plan on rents tracking national, not racing it.
- At projected returns (-3.0% appreciation + 1.2% rent growth), your $31k cash investment doubles in ~3 years — after that, you're playing with house money.
Negotiation context
- It's been on market 314 days — a 12% lower offer ($97k) is reasonable based on typical stale-listing flexibility.
- 2 sale attempts since 22y ago; this cycle's ask has dropped $12k (10%) from the opening price — seller is motivated, your offer sets the floor, not the list.
- Current owner paid $90k; 22% above their basis — modest negotiation headroom, anchor on the comps not their cost.
Risks & watch-outs
- Watch-outs: flood insurance adds $66/mo.
- Climate carrying-cost: severe flood risk; extreme-heat days projected 7→23/yr by 2055 (HVAC capex compounding) — expect insurance premiums to compound above CPI over the hold.
Questions for the listing agent
- It's been on market 314 days. Have you received any prior offers? Is the seller open to a 12% concession, seller financing, or rate buy-down credit?
- What's the actual annual flood-insurance premium (NFIP or private), and is the property in a SFHA with mandatory coverage?
- Why hasn't it sold? Are there any deal-killer items the seller is aware of (foundation, flood, title, zoning, code violations)?
- Is there a deadline driving the sale (1031 exchange, divorce, estate, relocation)? That informs how much negotiation room exists.
- Schools are B-rated — typically a magnet for longer-tenancy family renters. What's the average tenant stay here, and is there a school-zone premium baked into asking?
- What's the average days-on-market for RENTAL listings here right now (not sales)? A rising rental-DOM trend means longer vacancies and softer asking-rent achievability than the comps imply.
- What's the recent tenant-quality profile in this submarket — average credit score on applications, eviction rate, late-payment / NSF rate, and stable-employment percentage? A property-management company in the area should have these aggregated.
- How much new for-sale + rental construction is in the pipeline within 1–3 miles? Heavy new supply typically softens prices + rents 12–24 months out; constrained supply supports both.
Investment metrics
- 1% rule
- 2.44% ✓
- Cap rate
- 21.08%
- Cash-on-cash
- 52.83%
- DSCR
- 3.35
- GRM
- 3.4
CMA / ARV
- ARV (on-the-fly)
- $171,840
- Comps found
- 7
Show comp detail 7 sales within ~0.75 mi
| Address | Dist | Beds/Ba | Sqft | Sold | Price | $/sf | Match |
|---|---|---|---|---|---|---|---|
| 17261 GOTHARD St #50 | 0.00mi | 2/2.0 | 940 (-2%) | 3mo | $84,000 | $89 | 94 |
| 17261 Gothard St #63 | 0.00mi | 2/1.0 | 880 (-8%) | 7mo | $84,000 | $95 | 76 |
| 17261 GOTHARD St #51 | 0.00mi | 2/2.0 | 1,050 (+9%) | 12mo | $112,000 | $107 | 74 |
| 17261 Gothard #26 | 0.04mi | 2/2.0 | 920 (-4%) | 22mo | $165,000 | $179 | 73 |
| 17261 Gothard St #34 | 0.00mi | 2/2.0 | 1,040 (+8%) | 20mo | $195,000 | $188 | 69 |
| 7850 Slater #38 | 0.62mi | 2/2.0 | 960 (0%) | 8mo | $175,000 | $182 | 64 |
| 7850 Slater Ave Spc 66 | 0.64mi | 3/2.0 (+1) | 1,056 (+10%) | 20mo | $215,000 | $204 | 32 |
Match score weights: distance 35% · size 25% · config 20% · recency 20%. Top-matched comps best support the ARV.
Projected returns pro-forma
-3.0% appreciation · 1.2% rent growth · sell at horizon
- IRR
- 45.9%
- Equity multiple
- 2.94×
- Total profit
- $59,615
- Equity at exit
- $16,401
- IRR
- 50.9%
- Equity multiple
- 5.52×
- Total profit
- $139,128
- Equity at exit
- $9,511
Cash invested: $30,800 (down + closing). Projections, not guarantees.
Landlord ↔ Tenant lean methodology
- Overall (STATE)
- 18 Strongly Tenant-Friendly
- State California
- 18 Strongly Tenant-Friendly · D+13
- County
- — inherits STATE
- City
- — inherits STATE
ZIP-level market 92647
- Rents YoY
- 1.2%
- Active inventory
- 75
- Price-to-rent
- 3.4×
Monthly cashflow live
- Estimated rent
- $2,679 high interval (Pro) →
- Mortgage (P&I)
- −$577
- Tax est. 1.5%
- −$138 /mo · $1,650/yr
- Insurance
- −$46
- Flood insurance flood zone
- −$66 /mo · $798/yr
- HOA
- −$0
- Vacancy / Maint / Mgmt
- −$562
- Net cashflow
- $1,289
Break-even live
UW: 25.0% down · 7.5% · 30yr · 1.5% tax · 5.0% vac · 8.0% maint · 8.0% mgmt
Financing live
Cash to close
- Down payment
- $27,500
- Closing costs
- $3,300
- Reserves months
- —
- Total cash needed
- —
Loan-product check · same deal, 3 products live
Conventional
25% down · 7.5% · 30yr
- Down + closing
- —
- Monthly P&I
- —
- Monthly cashflow
- —
- DSCR
- —
- Eligible?
- —
Personal DTI + credit; lowest rate.
DSCR
20% down · 8.5% · 30yr
- Down + closing
- —
- Monthly P&I
- —
- Monthly cashflow
- —
- DSCR
- —
- Eligible?
- —
No personal income docs; deal must DSCR.
Hard money
10% down · 12.0% · 12mo
- Down + closing
- —
- Monthly P&I
- —
- Monthly cashflow
- —
- DSCR
- —
- Eligible?
- —
Short-term bridge; refi at stabilization.
Rent comps 40 comps
| Address | Beds | Baths | Sqft | Rent | $/sqft | DOM | Units | Dist |
|---|---|---|---|---|---|---|---|---|
| 7302 Elk Cir Huntington Beach, CA | 2.0 | 1.0 | 850 | $2,650 | $3.12 | 11d | 1 | 0.28mi |
| 7302 Elk Cir Apt 4 Huntington Beach, CA | 2.0 | 1.0 | 850 | $2,650 | $3.12 | 1d | 1 | 0.28mi |
| 7261 La Mancha Cir Unit C Huntington Beach, CA | 2.0 | 2.0 | 921 | $2,500 | $2.71 | 22d | 1 | 0.49mi |
| 6762 Warner Ave Huntington Beach, CA | 2.0 | 1.5 | 920 | $2,750 | $2.99 | 1d | 6 | 0.50mi |
| 17441 Koledo Ln Apt D Huntington Beach, CA | 2.0 | 2.0 | 900 | $2,375 | $2.64 | 1d | 1 | 0.55mi |
| 7771 Sycamore Dr Unit SYCAMORE7771-C Huntington Beach, CA | 2.0 | 1.5 | 800 | $2,550 | $3.19 | 14d | 1 | 0.56mi |
| 17371 Queens Ln Apt 4 Huntington Beach, CA | 2.0 | 1.0 | 800 | $2,295 | $2.87 | 1d | 1 | 0.58mi |
| 6700 Warner Ave Huntington Beach, CA | 2.0 | 1.0–2.0 | 875 | $3,260 | $3.73 | 1d | 1 | 0.59mi |
| 7701 Warner Ave Unit A004 Huntington Beach, CA | 1.0 | 1.0 | 750 | $2,585 | $3.45 | 1d | 1 | 0.60mi |
| 7701 Warner Ave Apt A11 Huntington Beach, CA | 1.0 | 1.0 | 750 | $2,445 | $3.26 | 10d | 1 | 0.60mi |
| 7701 Warner Ave Unit B024 Huntington Beach, CA | 1.0 | 1.0 | 750 | $2,505 | $3.34 | 19d | 1 | 0.60mi |
| 7701 Warner Ave Unit A010 Huntington Beach, CA | 1.0 | 1.0 | 750 | $2,445 | $3.26 | 16d | 1 | 0.60mi |
| 7701 Warner Ave Unit E081 Huntington Beach, CA | 1.0 | 1.0 | 750 | $2,445 | $3.26 | 1d | 1 | 0.60mi |
| 7701 Warner Ave Apt G115 Huntington Beach, CA | 1.0 | 1.0 | 750 | $2,535 | $3.38 | 1d | 1 | 0.60mi |
| 16682 Goldenwest St Unit 2 Huntington Beach, CA | 2.0 | 2.0 | 900 | $2,800 | $3.11 | 1d | 1 | 0.61mi |
| 17301 Keelson Ln Huntington Beach, CA | 2.0 | 1.0 | 691 | $2,770 | $4.01 | 1d | 5 | 0.62mi |
| 16612 Bartlett Ln Unit 4 Huntington Beach, CA | 2.0 | 1.0 | 1000 | $2,600 | $2.60 | 19d | 1 | 0.67mi |
| 6600 Warner Ave Huntington Beach, CA | 1.0 | 1.0 | 754 | $2,348 | $3.11 | 7d | 4 | 0.68mi |
| 6600 Warner Ave Huntington Beach, OS | 1.0 | 1.0 | 769 | $2,185 | $2.84 | 1d | 2 | 0.68mi |
| 7802 Speer Dr Unit C Huntington Beach, CA | 2.0 | 2.0 | 900 | $2,595 | $2.88 | 1d | 1 | 0.68mi |
| 6600 Warner Ave #138 Huntington Beach, CA | 1.0 | 1.0 | 754 | $2,700 | $3.58 | 19d | 1 | 0.71mi |
| 16761 Viewpoint Ln Huntington Beach, CA | 2.0 | 1.5–2.0 | 938 | $2,863 | $3.05 | 1d | 15 | 0.72mi |
| 6551 Warner Ave Huntington Beach, CA | 1.0 | 1.0 | 770 | $2,520 | $3.27 | 1d | 6 | 0.76mi |
| 7822 Newman Ave Unit B Huntington Beach, CA | 2.0 | 1.5 | 950 | $2,500 | $2.63 | 1d | 1 | 0.77mi |
| 16673 Viewpoint Ln Huntington Beach, CA | 2.0 | 1.0 | 847 | $2,795 | $3.30 | 13d | 1 | 0.79mi |
| 7921 Moonshadow Cir Unit 4 Huntington Beach, CA | 2.0 | 1.0 | 950 | $2,545 | $2.68 | 1d | 1 | 0.81mi |
| 7901 Newman Ave Apt C Huntington Beach, CA | 2.0 | 2.0 | 900 | $2,425 | $2.69 | 1d | 1 | 0.82mi |
| 8081 Holland Dr Huntington Beach, CA | 1.0–2.0 | 1.0 | 790 | $2,878 | $3.64 | 1d | 9 | 0.83mi |
| 6401 Warner Ave Huntington Beach, CA | 2.0–3.0 | 1.0–2.5 | 1145 | $2,460 | $2.15 | 1d | 16 | 0.87mi |
| 17610 Cameron Ln Unit H Huntington Beach, CA | 2.0 | 2.5 | 1020 | $2,700 | $2.65 | 1d | 1 | 0.89mi |
| 17972 Baron Cir Unit 4 Huntington Beach, CA | 2.0 | 1.0 | 876 | $2,695 | $3.08 | 1d | 1 | 0.90mi |
| 7811 Talbert Ave Huntington Beach, CA | 2.0 | 1.0 | 950 | $2,969 | $3.13 | 1d | 1 | 0.90mi |
| 6242 Warner Ave Huntington Beach, CA | 1.0–2.0 | 1.0–2.0 | 830 | $2,925 | $3.52 | 1d | 12 | 0.97mi |
| 8200 Warner Ave Huntington Beach, CA | 2.0 | 1.0 | 937 | $2,800 | $2.99 | 1d | 3 | 0.99mi |
| 18242 Parkview Ln #106 Huntington Beach, CA | 1.0 | 1.0 | 593 | $1,950 | $3.29 | 2d | 1 | 1.04mi |
| 7912 Glencoe Dr Huntington Beach, CA | 3.0 | 1.0 | 1100 | $3,900 | $3.55 | 1d | 1 | 1.06mi |
| 17081 Evergreen Cir Unit D Huntington Beach, CA | 1.0 | 1.0 | 900 | $2,295 | $2.55 | 1d | 1 | 1.07mi |
| 7601 Amazon Dr Unit 2 Huntington Beach, CA | 2.0 | 2.0 | 1000 | $2,650 | $2.65 | 1d | 1 | 1.11mi |
| 7290 Edinger Ave Huntington Beach, CA | 1.0–2.0 | 1.0–2.0 | 941 | $3,824 | $4.06 | 1d | 19 | 1.16mi |
| 17031 Pinehurst Ln Unit B Huntington Beach, CA | 2.0 | 2.0 | 800 | $3,000 | $3.75 | 1d | 1 | 1.17mi |
Listing history 19 events
-
2026-06-18days on market $110,000 Active 314 DOM
-
2026-06-17days on market $110,000 Active 313 DOM
-
2026-06-16days on market $110,000 Active 312 DOM
-
2026-06-15days on market $110,000 Active 311 DOM
-
2026-06-13days on market $110,000 Active 309 DOM
-
2026-06-13days on market $110,000 Active 308 DOM
-
2026-06-10days on market $110,000 Active 306 DOM
-
2026-06-09days on market $110,000 Active 305 DOM
-
2026-06-08days on market $110,000 Active 304 DOM
-
2026-06-07days on market $110,000 Active 303 DOM
-
2026-06-04days on market $110,000 Active 300 DOM
-
2026-06-03days on market $110,000 Active 299 DOM
-
2026-06-02days on market $110,000 Active 298 DOM
-
2026-06-01days on market $110,000 Active 297 DOM
-
2026-05-31days on market $110,000 Active 296 DOM
-
2026-03-19price $110,000
-
2025-08-08$122,000 Active
-
2005-01-15soldstatus $90,000
-
2004-11-28$90,000
ⓘ Source: listings_history table (triggers on properties + properties_extension) + one-shot
backfill from property_details.listing_events for pre-trigger history.
Climate risk First Street
- Flood 10/10 Extreme FEMA zone X · 99% chance over 30 yrs
- Wildfire 1/10 Low
- Heat 5/10 Major 7 d/yr ≥85°F today · 23 d/yr by 30 yrs out
- Wind 1/10 Low
- Air quality 4/10 Moderate 5 unhealthy d/yr today · 7 by 30 yrs out
Nearby sold comps map
Loading sold comps map…
Walkable amenities ~0.75 mi
Loading nearby amenities…
Taxation est. · year 1
- Rental income
- $32,143
- − Mortgage interest
- −$6,162
- − Property taxes
- −$1,650
- − Insurance
- −$1,348
- − Repairs & maintenance
- −$2,571
- − Management
- −$2,571
- − Depreciation
- −$3,200
- Taxable income
- $14,641
- Est. tax owed @ 24.0%
- −$3,514
- After-tax cash flow
- $11,959/yr
For passive investors: Depreciation is non-cash, so a rental often shows a tax loss while cash-flowing — sheltering income. Rental losses are passive: they offset passive income freely, and up to $25,000/yr can offset ordinary (W-2) income if you actively participate and your MAGI is under $100k (phasing out to $0 by $150k); unused losses carry forward. On sale, claimed depreciation is recaptured at up to 25%, and gains may owe capital-gains tax (a 1031 exchange can defer both). Figures are a year-1 estimate at your 24.0% rate — not tax advice; consult a CPA.
Schools (NCES district)
- District
- Ocean View
- NCES district ID
- 0628140
- Math proficiency
- 57% ▬ 0.00%
- Reading proficiency
- 63% ▼ -1.00%
- Median HH income
- $77,469
- Composite
- 55.3/100
- National rank
- #2725
- State rank
- #207 of 1400 in CA
Livability — Huntington Beach
- Score
- 67/100
- State rank
- #306
- US rank
- #10298
Category grades
Schools grade is shown separately in the Schools card above.
Census & demographics
- Census place
- Huntington Beach, CA
- County
- Orange County · 3,096,323 people
- City population
- 194,835
- Metro
- Los Angeles-Long Beach-Anaheim, CA
- Population (ZIP)
- 59,047
- Household income
- $105,110
- Rent vs Own
- Severe rent burden
- 3065.0
Population outlook (Orange County) Hauer SSP2
- Today (2025)
- 3,477,456 people
- By 2030
- 3,613,117 · +3.9%
- By 2040
- 3,835,945 · +10.3%
- By 2050
- 3,968,736 · +14.1%
- By 2075
- 4,097,053 · +17.8%
- By 2100
- 3,903,633 · +12.3%
Race, ethnicity, and origin ACS 2023
- Neighborhood character
- Diverse neighborhood (Simpson 0.66)
- Race & ethnicity
- White 50% Hispanic / Latino 27% Two or more races 15% Asian 14% Black 2%
- Hispanic origin (detail)
- Mexican 22%
- Common ancestry
- Lithuanian 3% Italian 2% Romanian 2%
- Foreign-born
- 21% · Canada, Vietnam, China
- Languages at home
- 68% English-only · Spanish 15% Vietnamese 6% Other Indo-European 3%
Political lean MEDSL · Orange
- 2024 margin
- Toss-up / Even · D 49.7% · R 47.1% · Other 3.2%
- 2008→2024 swing
- +5.2pp toward D · 2008: -2.6pp · 2024: 2.6pp
- All cycles
- 2024: D+2.6 2020: D+9.0 2016: D+7.7 2012: R+8.3 2008: R+2.6
Not yet ingested
- Civics
- —
Market trends
- HPI YoY
- ▼ -1044.38%
- Current HPI
- 401.8266
- Rent YoY
- ▲ 1.20%
- Metro
- Los Angeles-Long Beach-Anaheim, CA
- State GDP YoY
- ▲ 3.21%
- F500 in state
- 116
Industry mix (Fortune 500 HQ in CA)
| Industry | F500 HQs | Revenue |
|---|---|---|
| Technology | 27 | $1,492B |
|
||
| Financial Services | 3 | $174B |
|
||
| Retail | 3 | $44B |
|
||
| Insurance | 3 | $26B |
|
||
| Media / Entertainment | 2 | $115B |
|
||
| Pharmaceuticals / Biotech | 2 | $62B |
|
||
Price history
+22.2% since first listed4 events — show timeline
- 2026-03-19 Price Changed $110,000 CRMLS
- 2025-08-08 Listed $122,000 CRMLS
- 2005-01-15 Sold (MLS) $90,000 CRMLS
- 2004-11-28 Listed $90,000 CRMLS
Property tax history
-3.4%/yrLatest (2025): $142 · -4.6% YoY. Source: county tax records.
Cash-flow waterfall
monthlySold comps — $/sqft
last 12 mo · ≤1 miLoading sold comps…