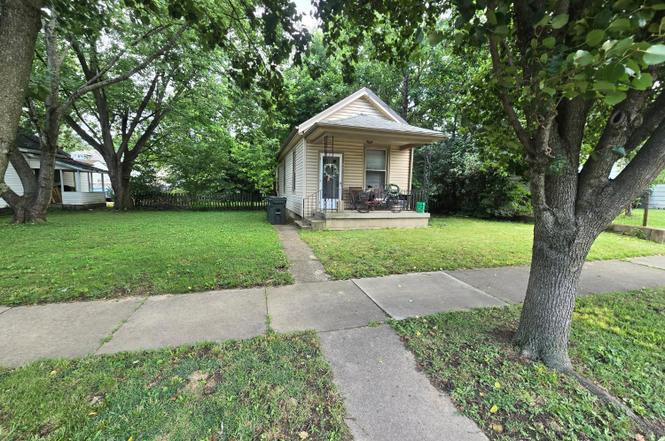
985 Kahn Ave · Hamilton, OH
Flood risk 6/10 · Moderate
- FEMA flood zone
- X (unshaded)
- Chance of flooding over 30 yrs
- 0.68%
- Est. flood insurance / yr
- $507 – $1,088
Fire risk 1/10 · Minimal
- Est. fire insurance / yr
- $713 – $1,323
Heat risk 4/10 · Minor
- Hot days now (above 104°F)
- 7 days/yr
- Hot days in 30 yrs
- 19 days/yr
Wind risk 2/10 · Minimal
- Chance of severe wind over 30 yrs
- 1.0%
Air-quality risk 3/10 · Minor
- Unhealthy air days now
- 2 days/yr
- Unhealthy air days in 30 yrs
- 3 days/yr
Risk factors via First Street. Map © Google.
Why this score? — see what drove the B grade
The composite is a weighted blend of 9 inputs, each scored 0–100. Each bar is that input's sub-score; the figure is the points it added to the 100-point composite (weight × sub-score).
- Cash flow +30.0/30.0
- 1% rule +10.0/10.0
- DSCR +10.0/10.0
- ARV discount +7.5/15.0
- Livability +3.7/5.0
- Schools +3.6/10.0
- Rent growth +3.2/5.0
- Condition / age +2.5/5.0
- Appreciation +0.0/10.0
$50,000
🖨 Deal sheet 📄 Offer letter ✓ Due diligence
Listing remarks
Great Opportunity for Hands-On Buyers! This charming fixer-upper boasts tons of potential in a quaint little home right near the heart of Hamilton. Just minutes from downtown with easy access to 129 for your eastbound commute. Come check it out and envision the possibilities! Please note: The home is being sold as-is, where-is with no repairs to be made by the Seller. Offers submitted will be reviewed by June 22, 2026, at which time the owner will make a decision. The owner reserves the right to accept a strong offer at any time prior.
Key facts
- 7,545 sq ft lot
- 2 garage spots
- Built 1900
Property features AI
Finance
- Other: Residential zoning
- Financial info: Lease not considered
- HOA & community: No HOA
Exterior
- Parking: Detached garage with 2 garage spaces; Driveway
- Utilities: Public water; Public sewer; Natural gas
- Home design: Traditional single-family home; One level
- Construction: Vinyl siding; Shingle roof; Poured foundation; Built as single-family construction
- Exterior features: Vinyl windows
Interior
- Bedrooms: 1 bedroom on the main level
- Bathrooms: 1 full bathroom with tub on the main level
- Interior features: 3 total rooms; Full unfinished basement
Neighborhood map
What this means for you Summary
Snapshot
- This is a 1-bed/1.0-bath single-family listed at $50k.
Deal economics
- At list price, monthly cash flow is $505 ($6k/yr) — positive.
- The deal already cash-flows at list — no discount required.
- Meets the 1% rule at list price ($1k rent vs $50k).
- Cap rate 18.4% vs local median 4.6% in Hamilton — top-decile yield for the area; either an underpriced asset or a hidden risk that comps aren't pricing in. Stress-test before assuming the spread holds.
Location & tenants
- Location reads 73/100 on livability (#332 in OH) — a middle-class / working-renter tenant base. Strengths: cost of living A+, housing A+, schools B; Watch: crime C-, amenities C-, employment D.
- Hamilton City (suburban): math 42% / reading 45% proficiency, ranked #517 of 656 in OH (top 79%) — families likely to look elsewhere, expect single-tenant / working-renter base with shorter leases; 63% free/reduced lunch — lower-income household profile, screen leases tightly.
- Market conditions: Rents rising (+3.0%/yr); 196 active listings in the ZIP; 7 comparable units currently listed for rent nearby; rentals at typical pace (median 24d on market — plan ~3-4 weeks tenant-placement turnaround); 43% of comp listings sitting > 30 days — soft ceiling on asking rent; solid renter incomes; 1,163 units permitted in Butler County in 2024 (356 in 5+ unit buildings).
- This rent is only 14% of the median local income ($92k/yr) — well below the 30% rent-burden line; pricing power to push rent on renewal without tenant pushback.
Forward outlook
- Local home prices are declining (-3.0%/yr); year-one equity from $346 of loan paydown is wiped out by about $2k of value loss. Plan a longer hold.
- At projected returns (-3.0% appreciation + 3.0% rent growth), your $14k cash investment doubles in ~3 years — after that, you're playing with house money.
Negotiation context
- Only 3 days on market — expect competitive offers; lowballing is unlikely to land.
- Current owner paid $35k; 43% above their basis — modest negotiation headroom, anchor on the comps not their cost.
Risks & watch-outs
- Watch-outs: built in 1900 — expect roof / HVAC / electrical / plumbing capex.
- Climate carrying-cost: major flood risk — expect insurance premiums to compound above CPI over the hold.
Questions for the listing agent
- Built in 1900 — when were the roof, HVAC, electrical panel, plumbing, and water heater last replaced?
- Is there a deadline driving the sale (1031 exchange, divorce, estate, relocation)? That informs how much negotiation room exists.
- Schools are B-rated — typically a magnet for longer-tenancy family renters. What's the average tenant stay here, and is there a school-zone premium baked into asking?
- What's the average days-on-market for RENTAL listings here right now (not sales)? A rising rental-DOM trend means longer vacancies and softer asking-rent achievability than the comps imply.
- What's the recent tenant-quality profile in this submarket — average credit score on applications, eviction rate, late-payment / NSF rate, and stable-employment percentage? A property-management company in the area should have these aggregated.
- How much new for-sale + rental construction is in the pipeline within 1–3 miles? Heavy new supply typically softens prices + rents 12–24 months out; constrained supply supports both.
Investment metrics
- 1% rule
- 2.18% ✓
- Cap rate
- 18.42%
- Cash-on-cash
- 43.30%
- DSCR
- 2.93
- GRM
- 3.8
CMA / ARV
- ARV (on-the-fly)
- $108,780
- Comps found
- 8
Show comp detail 8 sales within ~0.75 mi
| Address | Dist | Beds/Ba | Sqft | Sold | Price | $/sf | Match |
|---|---|---|---|---|---|---|---|
| 1720 Howell Ave | 0.08mi | 2/1.0 (+1) | 644 (+10%) | 6mo | $120,000 | $186 | 71 |
| 1431 Parkamo Ave | 0.52mi | 1/1.0 | 560 (-5%) | 2mo | $57,000 | $102 | 66 |
| 422 S Thirteenth St | 0.50mi | 1/1.0 | 625 (+6%) | 2mo | $86,000 | $138 | 65 |
| 205 N Fair Ave | 0.53mi | 1/1.0 | 592 (+1%) | 16mo | $109,000 | $184 | 61 |
| 1313 Allstatter Ave | 0.45mi | 2/1.0 (+1) | 632 (+8%) | 16mo | $139,000 | $220 | 48 |
| 210 Bond Ave | 0.68mi | 1/1.0 | 528 (-10%) | 5mo | $65,000 | $123 | 47 |
| 1304 Campbell Ave | 0.58mi | 2/1.0 (+1) | 616 (+5%) | 18mo | $128,000 | $208 | 45 |
| 1779 Shuler Ave | 0.64mi | 2/1.0 (+1) | 660 (+12%) | 22mo | $122,000 | $185 | 26 |
Match score weights: distance 35% · size 25% · config 20% · recency 20%. Top-matched comps best support the ARV.
Projected returns pro-forma
-3.0% appreciation · 2.95% rent growth · sell at horizon
- IRR
- 40.1%
- Equity multiple
- 2.72×
- Total profit
- $24,044
- Equity at exit
- $7,455
- IRR
- 46.4%
- Equity multiple
- 5.45×
- Total profit
- $62,242
- Equity at exit
- $4,323
Cash invested: $14,000 (down + closing). Projections, not guarantees.
Landlord ↔ Tenant lean methodology
- Overall (STATE)
- 73 Landlord-Friendly
- State Ohio
- 73 Landlord-Friendly · R+6
- County
- — inherits STATE
- City
- — inherits STATE
ZIP-level market 45011
- Rents YoY
- 3.0%
- Active inventory
- 196
- Price-to-rent
- 3.8×
Monthly cashflow live
- Estimated rent
- $1,092 high interval (Pro) →
- Mortgage (P&I)
- −$262
- Tax from tax record
- −$75 /mo · $895/yr
- Insurance
- −$21
- HOA
- −$0
- Vacancy / Maint / Mgmt
- −$229
- Net cashflow
- $505
Break-even live
UW: 25.0% down · 7.5% · 30yr · 1.5% tax · 5.0% vac · 8.0% maint · 8.0% mgmt
Financing live
Cash to close
- Down payment
- $12,500
- Closing costs
- $1,500
- Reserves months
- —
- Total cash needed
- —
Loan-product check · same deal, 3 products live
Conventional
25% down · 7.5% · 30yr
- Down + closing
- —
- Monthly P&I
- —
- Monthly cashflow
- —
- DSCR
- —
- Eligible?
- —
Personal DTI + credit; lowest rate.
DSCR
20% down · 8.5% · 30yr
- Down + closing
- —
- Monthly P&I
- —
- Monthly cashflow
- —
- DSCR
- —
- Eligible?
- —
No personal income docs; deal must DSCR.
Hard money
10% down · 12.0% · 12mo
- Down + closing
- —
- Monthly P&I
- —
- Monthly cashflow
- —
- DSCR
- —
- Eligible?
- —
Short-term bridge; refi at stabilization.
Rent comps 7 comps
| Address | Beds | Baths | Sqft | Rent | $/sqft | DOM | Units | Dist |
|---|---|---|---|---|---|---|---|---|
| 350 Vista Dr Unit 2 Hamilton, OH | 1.0 | 1.0 | 700 | $875 | $1.25 | 2d | 1 | 0.43mi |
| 350 Vista Dr Apt 1 Hamilton, OH | 1.0 | 1.0 | 700 | $900 | $1.29 | 44d | 1 | 0.43mi |
| 1324 Campbell Ave Hamilton, OH | 1.0 | 1.0 | 528 | $795 | $1.51 | 23d | 1 | 0.53mi |
| 358 Hampshire Dr Hamilton, OH | 1.0–2.0 | 1.0 | 687 | $985 | $1.43 | 2d | 23 | 0.56mi |
| 358 Hampshire Dr Unit BHA-35607 Hamilton, OH | 1.0 | 1.0 | 630 | $1,075 | $1.71 | 44d | 1 | 0.56mi |
| 358 Hampshire Dr Unit 1FNA-49814 Hamilton, OH | 1.0 | 1.0 | 525 | $985 | $1.88 | 44d | 1 | 0.56mi |
| 829 Maple Ave Apt 1 Hamilton, OH | 1.0 | 1.0 | 731 | $755 | $1.03 | 23d | 1 | 0.75mi |
Listing history 4 events
-
2026-06-18days on market $50,000 Active 3 DOM
-
2026-06-17days on market $50,000 Active 2 DOM
-
2026-06-15remarks 542-char remark
-
2026-06-15$50,000 Active 1 DOM
ⓘ Source: listings_history table (triggers on properties + properties_extension) + one-shot
backfill from property_details.listing_events for pre-trigger history.
Tax reassessment forecast OH · Partial reset (capped growth)
- Current annual tax
- $895 · $75/mo
- Projected year-2 tax
- $895 · $75/mo
- Expected delta
- $0/yr ($0/mo · -0.0%)
ⓘ Screening estimate from a state-policy table — verify with the county assessor before closing.
Climate risk First Street
- Flood 6/10 Major FEMA zone X (unshaded) · 68% chance over 30 yrs
- Wildfire 1/10 Low
- Heat 4/10 Moderate 7 d/yr ≥104°F today · 19 d/yr by 30 yrs out
- Wind 2/10 Low 100% chance of damaging wind over 30 yrs
- Air quality 3/10 Moderate 2 unhealthy d/yr today · 3 by 30 yrs out
Nearby sold comps map
Loading sold comps map…
Walkable amenities ~0.75 mi
Loading nearby amenities…
Taxation est. · year 1
- Rental income
- $13,107
- − Mortgage interest
- −$2,801
- − Property taxes
- −$895
- − Insurance
- −$250
- − Repairs & maintenance
- −$1,049
- − Management
- −$1,049
- − Depreciation
- −$1,455
- Taxable income
- $5,609
- Est. tax owed @ 24.0%
- −$1,346
- After-tax cash flow
- $4,716/yr
For passive investors: Depreciation is non-cash, so a rental often shows a tax loss while cash-flowing — sheltering income. Rental losses are passive: they offset passive income freely, and up to $25,000/yr can offset ordinary (W-2) income if you actively participate and your MAGI is under $100k (phasing out to $0 by $150k); unused losses carry forward. On sale, claimed depreciation is recaptured at up to 25%, and gains may owe capital-gains tax (a 1031 exchange can defer both). Figures are a year-1 estimate at your 24.0% rate — not tax advice; consult a CPA.
Schools (NCES district)
- District
- Hamilton City
- NCES district ID
- 3904410
- Math proficiency
- 42% ▼ -13.00%
- Reading proficiency
- 45% ▼ -10.00%
- Median HH income
- $40,488
- Composite
- 36.48/100
- National rank
- #4656
- State rank
- #517 of 656 in OH
Livability — Hamilton
- Score
- 73/100
- State rank
- #332
- US rank
- #5467
Category grades
Schools grade is shown separately in the Schools card above.
Census & demographics
- Census place
- Hamilton, OH
- County
- Butler County · 381,674 people
- City population
- 140,900
- Metro
- Cincinnati, OH-KY-IN
- Population (ZIP)
- 75,864
- Household income
- $91,873
- Rent vs Own
- Severe rent burden
- 1795.0
Population outlook (Butler County) Hauer SSP2
- Today (2025)
- 387,706 people
- By 2030
- 392,028 · +1.1%
- By 2040
- 395,307 · +2.0%
- By 2050
- 391,116 · +0.9%
- By 2075
- 378,642 · -2.3%
- By 2100
- 343,248 · -11.5%
Race, ethnicity, and origin ACS 2023
- Neighborhood character
- Predominantly White (68%)
- Race & ethnicity
- White 68% Hispanic / Latino 12% Black 11% Two or more races 9% Asian 4%
- Hispanic origin (detail)
- Mexican 7%
- Common ancestry
- Romanian 2% Italian 2% Slovak 2%
- Foreign-born
- 11% · Canada, Vietnam, China
- Languages at home
- 86% English-only · Spanish 8% Other Indo-European 2% Vietnamese 1%
Political lean MEDSL · Butler
- 2024 margin
- Strong R (+26.3) · D 36.4% · R 62.7%
- 2008→2024 swing
- -3.6pp toward R · 2008: -22.6pp · 2024: -26.3pp
- All cycles
- 2024: R+26.3 2020: R+24.0 2016: R+28.3 2012: R+26.2 2008: R+22.6
Not yet ingested
- Civics
- —
Market trends
- HPI YoY
- ▼ -188.67%
- Current HPI
- 259.7868
- Rent YoY
- ▲ 2.95%
- Metro
- Cincinnati, OH-KY-IN
- State GDP YoY
- ▲ 1.98%
- F500 in state
- 48
Industry mix (Fortune 500 HQ in OH)
| Industry | F500 HQs | Revenue |
|---|---|---|
| Insurance | 3 | $145B |
|
||
| Industrial Machinery | 3 | $49B |
|
||
| Financial Services | 3 | $24B |
|
||
| Consumer Goods | 2 | $93B |
|
||
| Aerospace / Defense | 2 | $47B |
|
||
| Utilities | 2 | $33B |
|
||
Price history
+42.9% since first listed2 events — show timeline
- 2026-06-13 Listed $50,000 Cincy MLS
- 1994-09-23 Sold (Public Records) $35,000 Public Records
Property tax history
-1.5%/yrLatest (2025): $895 · +0.4% YoY. Source: county tax records.
Cash-flow waterfall
monthlySold comps — $/sqft
last 12 mo · ≤1 miLoading sold comps…