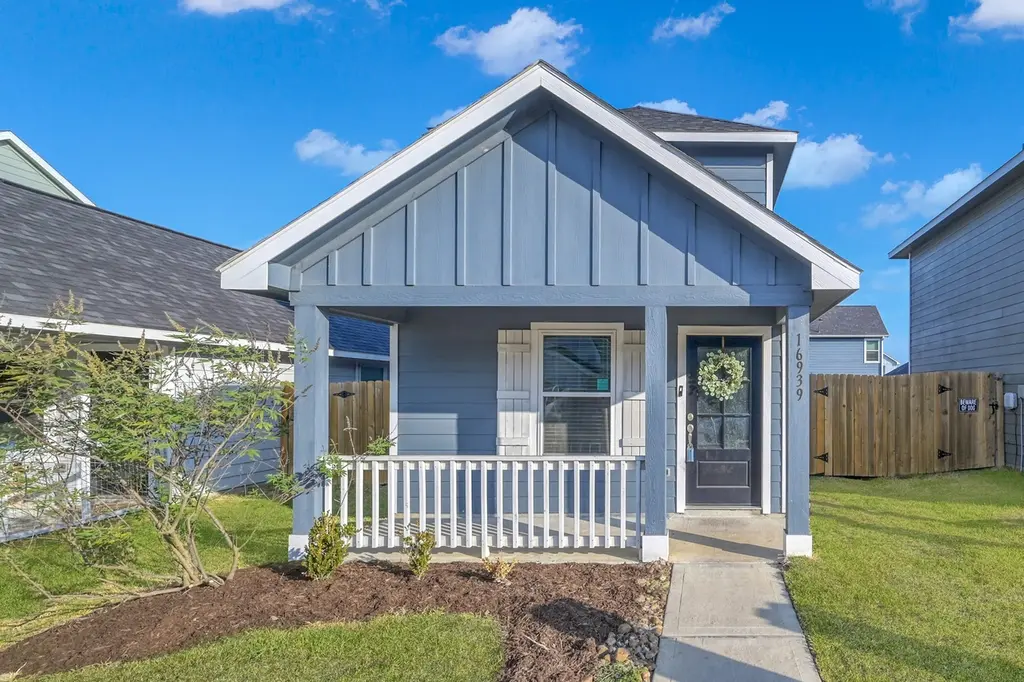
16939 Marie Village Dr · Deerwood, TX
Flood risk 1/10 · Minimal
- FEMA flood zone
- X (unshaded)
- Chance of flooding over 30 yrs
- 0.0%
- Est. flood insurance / yr
- $507 – $1,088
Fire risk 6/10 · Moderate
- Est. fire insurance / yr
- $1,222 – $2,270
Heat risk 8/10 · Major
- Hot days now (above 112°F)
- 7 days/yr
- Hot days in 30 yrs
- 24 days/yr
Wind risk 8/10 · Major
- Chance of severe wind over 30 yrs
- 99.0%
Air-quality risk 2/10 · Minimal
- Unhealthy air days now
- 2 days/yr
- Unhealthy air days in 30 yrs
- 2 days/yr
Risk factors via First Street. Map © Google.
Why this score? — see what drove the D grade
The composite is a weighted blend of 9 inputs, each scored 0–100. Each bar is that input's sub-score; the figure is the points it added to the 100-point composite (weight × sub-score).
- Cash flow +11.5/30.0
- ARV discount +10.7/15.0
- 1% rule +5.3/10.0
- Schools +5.1/10.0
- Condition / age +4.0/5.0
- DSCR +3.4/10.0
- Rent growth +2.5/5.0
- Livability +2.5/5.0
- Appreciation +0.0/10.0
$164,500
🖨 Deal sheet (PDF) 📄 Offer letter ✓ Due diligence
Listing remarks MLS
Lowest price home per square foot in the neighborhood! Enjoy relaxing mornings on the spacious covered front porch, while inside you’ll find durable, low-maintenance vinyl flooring throughout the main living areas. The kitchen is designed to impress with granite countertops, an undermount sink, and crisp white cabinetry, plus an outdoor storage shed for added convenience. The first-floor primary suite offers privacy and comfort, while upstairs features two generously sized bedrooms and a full bathroom—perfect for family or guests. Even better, the refrigerator, washer, and dryer are all included, making your move seamless. Located within Conroe ISD, this home checks all the boxes. Schedule your showing today—this one won’t last long!
Key facts
- Covered front porch
- Vinyl flooring
- Undermount sink
Tags
Neighborhood map
What this means for you Summary
Snapshot
- This is a 3-bed/2.0-bath single-family listed at $164k. Condition is rated good.
Deal economics
- At list price, monthly cash flow is $-55 ($-656/yr) — negative.
- To cash-flow at today's rent, offer at most $155k (5.9% below list).
- Meets the 1% rule at list price ($2k rent vs $164k).
- Recommended offer: $155k (6.0% below list) — sets the bar for market timing.
Location & tenants
- Location reads: area grade D — affects rentability + tenant quality, not the cash-flow math above.
- Conroe ISD (other): math 57% / reading 57% proficiency, ranked #69 of 826 in TX (top 8%) — acceptable for families but not a draw, mixed tenant base, ~2y average lease.
- Zoned schools: Creighton El (math 31% / reading 27%, grade F, #2,668 of 4,322 statewide, top 63%, 940 students, 92% FRL); Moorhead J H (math 35% / reading 42%, grade F, #704 of 1,662 statewide, top 43%, 1,391 students, 82% FRL); Caney Creek H S (math 33% / reading 42%, grade F, #888 of 1,632 statewide, top 55%, 2,504 students, 79% FRL) — zoned schools average 84% FRL vs 34% district-wide (50 pts higher); higher-poverty schools than district average — tighter screening recommended.
- Zoned-school proficiency averages 35% at this address vs 57% district-wide (-22 pts) — the specific schools serving this property underperform the Conroe ISD average; the district grade overstates school quality for this exact location.
- Market conditions: 416 active listings in the ZIP; 3 comparable units currently listed for rent nearby; rentals at typical pace (median 26d on market — plan ~3-4 weeks tenant-placement turnaround); solid renter incomes; 13,259 units permitted in Montgomery County in 2024 (1,402 in 5+ unit buildings).
Forward outlook
- Local home prices are declining (-3.0%/yr); year-one equity from $1k of loan paydown is wiped out by about $5k of value loss. Plan a longer hold.
- Montgomery County population projected at +65% by 2050 — long-run rental-demand tailwind backs the buy-and-hold thesis.
Negotiation context
- It's been on market 65 days — a 6% lower offer ($155k) is reasonable based on typical stale-listing flexibility.
- 5 sale attempts since 3y ago with the ask held roughly flat each time — persistent listings suggest the price (not the market) is what's stuck; bring a comps-based counter.
Risks & watch-outs
- Watch-outs: property tax is 3.2% of price.
- Climate carrying-cost: severe wind risk, 99% chance of damaging wind over 30y; major wildfire risk; extreme-heat days projected 7→24/yr by 2055 (HVAC capex compounding) — expect insurance premiums to compound above CPI over the hold.
Questions for the listing agent
- What do current leases actually rent for vs. the listed asking? Can we see a recent rent roll and the last 12 months of T-12 income?
- It's been on market 65 days. Have you received any prior offers? Is the seller open to a 6% concession, seller financing, or rate buy-down credit?
- Property tax is high relative to price — has the assessment been appealed recently, and will the sale trigger a re-assessment?
- What does the HOA fee cover, when was the last increase, and are there any pending special assessments or reserve-fund shortfalls?
- Why hasn't it sold? Are there any deal-killer items the seller is aware of (foundation, flood, title, zoning, code violations)?
- Is there a deadline driving the sale (1031 exchange, divorce, estate, relocation)? That informs how much negotiation room exists.
- The area grade is low — what's the realistic commute time and amenity access for the typical tenant pool here? Any planned neighborhood developments (good or bad) we should know about?
- What's the average days-on-market for RENTAL listings here right now (not sales)? A rising rental-DOM trend means longer vacancies and softer asking-rent achievability than the comps imply.
- What's the recent tenant-quality profile in this submarket — average credit score on applications, eviction rate, late-payment / NSF rate, and stable-employment percentage? A property-management company in the area should have these aggregated.
- How much new for-sale + rental construction is in the pipeline within 1–3 miles? Heavy new supply typically softens prices + rents 12–24 months out; constrained supply supports both.
Investment metrics
- 1% rule
- 1.03% ✓
- Cap rate
- 5.89%
- Cash-on-cash
- -1.42%
- DSCR
- 0.94
- GRM
- 8.1
CMA / ARV
- ARV (median comp)
- $176,940
- List price
- $164,500
- Delta
- -7.03%
- Verdict
- FAIR
- Comps
- 20 within 1.0 mi
Show comp detail 12 sales within ~0.75 mi
| Address | Dist | Beds/Ba | Sqft | Sold | Price | $/sf | Match |
|---|---|---|---|---|---|---|---|
| 9706 Marie Village Ct | 0.25mi | 3/2.0 | 1,120 (-2%) | 2mo | $167,900 | $150 | 84 |
| 9900 Opal Stone Way | 0.10mi | 3/2.0 | 1,170 (+3%) | 9mo | $181,000 | $155 | 83 |
| 16955 Marie Village Dr | 0.02mi | 3/2.0 | 1,240 (+9%) | 5mo | $170,000 | $137 | 80 |
| 16842 N N Marie Village Dr | 0.14mi | 3/2.0 | 1,000 (-12%) | 3mo | $159,900 | $160 | 70 |
| 15597 Briar Forest Dr | 0.29mi | 3/2.0 | 1,216 (+7%) | 13mo | $202,950 | $167 | 64 |
| 16348 Jasmine Marie Pl | 0.16mi | 3/2.0 | 1,000 (-12%) | 9mo | $192,500 | $193 | 64 |
| 16515 Jasmine Marie Pl | 0.22mi | 3/2.0 | 1,255 (+10%) | 10mo | $177,000 | $141 | 64 |
| 16737 N Marie Village Dr | 0.10mi | 3/2.0 | 1,256 (+10%) | 18mo | $209,000 | $166 | 63 |
| 16811 North Marie Vlg | 0.13mi | 3/2.0 | 1,023 (-10%) | 18mo | $184,990 | $181 | 62 |
| 16499 Valerie Marie Pl | 0.18mi | 3/2.0 | 1,000 (-12%) | 11mo | $199,999 | $200 | 62 |
| 15515 Taylorcrest Dr | 0.41mi | 3/2.0 | 1,216 (+7%) | 10mo | $200,000 | $164 | 62 |
| 16635 Colleen Pl | 0.07mi | 2/1.0 (-1) | 1,000 (-12%) | 8mo | $139,900 | $140 | 61 |
Match score weights: distance 35% · size 25% · config 20% · recency 20%. Top-matched comps best support the ARV.
Projected returns pro-forma
-3.0% appreciation · 3.0% rent growth · sell at horizon
- IRR
- -18.5%
- Equity multiple
- 0.35×
- Total profit
- $-29,957
- Equity at exit
- $24,527
- IRR
- -10.6%
- Equity multiple
- 0.35×
- Total profit
- $-29,834
- Equity at exit
- $14,223
Cash invested: $46,060 (down + closing). Projections, not guarantees.
Landlord ↔ Tenant lean methodology
- Overall (STATE)
- 87 Strongly Landlord-Friendly
- State Texas
- 87 Strongly Landlord-Friendly · R+5
- County
- — inherits STATE
- City
- — inherits STATE
ZIP-level market 77306
- Home prices YoY
- -4.1%
- Active inventory
- 416
- Price-to-rent
- 8.1×
Monthly cashflow live
- Estimated rent
- $1,690 medium interval (Pro) →
- Mortgage (P&I)
- −$863
- Tax from tax record
- −$437 /mo · $5,248/yr
- Insurance
- −$69
- HOA
- −$21
- Vacancy / Maint / Mgmt
- −$355
- Net cashflow
- $-55
Break-even live
Sensitivity live
| Price | -10% $38 | -5% $-8 | +0% $-55 | +5% $-101 | +10% $-148 |
|---|---|---|---|---|---|
| Rent | -10% $-188 | -5% $-121 | +0% $-55 | +5% $12 | +10% $79 |
| Rate | -1.0pp $28 | -0.5pp $-13 | base $-55 | +0.5pp $-97 | +1.0pp $-141 |
UW: 25.0% down · 7.5% · 30yr · 1.5% tax · 5.0% vac · 8.0% maint · 8.0% mgmt
Financing live
Cash to close
- Down payment
- $41,125
- Closing costs
- $4,935
- Reserves months
- —
- Total cash needed
- —
Loan-product check · same deal, 3 products live
Conventional
25% down · 7.5% · 30yr
- Down + closing
- —
- Monthly P&I
- —
- Monthly cashflow
- —
- DSCR
- —
- Eligible?
- —
Personal DTI + credit; lowest rate.
DSCR
20% down · 8.5% · 30yr
- Down + closing
- —
- Monthly P&I
- —
- Monthly cashflow
- —
- DSCR
- —
- Eligible?
- —
No personal income docs; deal must DSCR.
Hard money
10% down · 12.0% · 12mo
- Down + closing
- —
- Monthly P&I
- —
- Monthly cashflow
- —
- DSCR
- —
- Eligible?
- —
Short-term bridge; refi at stabilization.
Rent comps 3 comps
| Address | Beds | Baths | Sqft | Rent | $/sqft | DOM | Units | Dist |
|---|---|---|---|---|---|---|---|---|
| 15581 Briar Forest Dr Conroe, TX | 4.0 | 2.0 | 1400 | $1,545 | $1.10 | 0d | 1 | 0.28mi |
| 10050 Cerritos Dr Conroe, TX | 4.0 | 2.0 | 1400 | $1,499 | $1.07 | 26d | 1 | 0.41mi |
| 6621 W Forest Rd Conroe, TX | 3.0 | 2.0 | 952 | $1,450 | $1.52 | 45d | 1 | 0.80mi |
HOA detail
- Monthly dues
- $21 · $252/yr
Listing history 27 events
-
2026-06-21days on market $164,500 Active 65 DOM
-
2026-06-18days on market $164,500 Active 62 DOM
-
2026-06-17days on market $164,500 Active 61 DOM
-
2026-06-16days on market $164,500 Active 60 DOM
-
2026-06-15days on market $164,500 Active 59 DOM
-
2026-06-13days on market $164,500 Active 57 DOM
-
2026-06-09days on market $164,500 Active 53 DOM
-
2026-06-08days on market $164,500 Active 52 DOM
-
2026-06-07days on market $164,500 Active 51 DOM
-
2026-06-04days on market $164,500 Active 48 DOM
-
2026-06-03days on market $164,500 Active 47 DOM
-
2026-06-02days on market $164,500 Active 46 DOM
-
2026-06-01days on market $164,500 Active 45 DOM
-
2026-05-31days on market $164,500 Active 44 DOM
-
2026-04-17$164,500 Active 767-char remark
Show marketing remark (767 chars)
Lowest price home per square foot in the neighborhood! Enjoy relaxing mornings on the spacious covered front porch, while inside you’ll find durable, low-maintenance vinyl flooring throughout the main living areas. The kitchen is designed to impress with granite countertops, an undermount sink, and crisp white cabinetry, plus an outdoor storage shed for added convenience. The first-floor primary suite offers privacy and comfort, while upstairs features two generously sized bedrooms and a full bathroom—perfect for family or guests. Even better, the refrigerator, washer, and dryer are all included, making your move seamless. Located within Conroe ISD, this home checks all the boxes. Schedule your showing today—this one won’t last long!
-
2026-04-17historical
Show marketing remark (767 chars)
Lowest price home per square foot in the neighborhood! Enjoy relaxing mornings on the spacious covered front porch, while inside you’ll find durable, low-maintenance vinyl flooring throughout the main living areas. The kitchen is designed to impress with granite countertops, an undermount sink, and crisp white cabinetry, plus an outdoor storage shed for added convenience. The first-floor primary suite offers privacy and comfort, while upstairs features two generously sized bedrooms and a full bathroom—perfect for family or guests. Even better, the refrigerator, washer, and dryer are all included, making your move seamless. Located within Conroe ISD, this home checks all the boxes. Schedule your showing today—this one won’t last long!
-
2026-04-02price $164,500
-
2025-11-18price $179,000
-
2025-10-25$185,000 Active
-
2024-02-09historical $1,600
-
2024-02-09historical
-
2024-02-02$185,000 Active
-
2024-01-31historical
-
2023-12-12price $1,600
-
2023-11-15$1,700
-
2023-09-29price $185,000
-
2023-08-30$190,000 Active
ⓘ Source: listings_history table (triggers on properties + properties_extension) + one-shot
backfill from property_details.listing_events for pre-trigger history.
Tax reassessment forecast TX · Resets to sale price
- Current annual tax
- $5,248 · $437/mo
- Projected year-2 tax
- $5,248 · $437/mo
- Expected delta
- $0/yr ($0/mo · 0.0%)
ⓘ Screening estimate from a state-policy table — verify with the county assessor before closing.
Climate risk First Street
- Flood 1/10 Low FEMA zone X (unshaded) · 0% chance over 30 yrs
- Wildfire 6/10 Major
- Heat 8/10 Severe 7 d/yr ≥112°F today · 24 d/yr by 30 yrs out
- Wind 8/10 Severe 99% chance of damaging wind over 30 yrs
- Air quality 2/10 Low 2 unhealthy d/yr today · 2 by 30 yrs out
Nearby sold comps map
Loading sold comps map…
Walkable amenities ~0.75 mi
Loading nearby amenities…
Taxation est. · year 1
- Rental income
- $20,276
- − Mortgage interest
- −$9,215
- − Property taxes
- −$5,248
- − Insurance
- −$822
- − Repairs & maintenance
- −$1,622
- − Management
- −$1,622
- − HOA
- −$252
- − Depreciation
- −$4,785
- Taxable loss
- −$3,290
- Est. tax savings @ 24.0%
- +$790
- After-tax cash flow
- $134/yr
For passive investors: Depreciation is non-cash, so a rental often shows a tax loss while cash-flowing — sheltering income. Rental losses are passive: they offset passive income freely, and up to $25,000/yr can offset ordinary (W-2) income if you actively participate and your MAGI is under $100k (phasing out to $0 by $150k); unused losses carry forward. On sale, claimed depreciation is recaptured at up to 25%, and gains may owe capital-gains tax (a 1031 exchange can defer both). Figures are a year-1 estimate at your 24.0% rate — not tax advice; consult a CPA.
Condition & rehab AI · 12 photos
This home is in good condition with a fresh paint job and modern updates, making it a great investment opportunity.
Value-add opportunities
- Resale Paint exterior siding — Enhances curb appeal and value
- Resale Trim and paint front porch — Improves first impression
- Resale Replace outdoor light fixtures — Modernizes exterior lighting
Renovation cost estimate screening
Value-add ROI direction
- Resale Paint exterior siding — Enhances curb appeal and value ↑
- Resale Trim and paint front porch — Improves first impression ↑
- Resale Replace outdoor light fixtures — Modernizes exterior lighting ↑
ⓘ Cost ranges are severity-bucket heuristics (US national rule-of-thumb). Get contractor quotes + a written scope before underwriting a rehab budget.
Schools (NCES district)
- District
- Conroe ISD
- NCES district ID
- 4815000
- Math proficiency
- 57% ▼ -6.00%
- Reading proficiency
- 57% ▼ -1.00%
- Median HH income
- $71,541
- Composite
- 50.65/100
- National rank
- #1833
- State rank
- #69 of 826 in TX
Livability — Deerwood
No livability data for this city. (Only ~50 U.S. cities are tracked.)
Census & demographics
- County
- Montgomery County · 663,713 people
- Metro
- Houston-The Woodlands-Sugar Land, TX
- Population (ZIP)
- 18,086
- Household income
- $76,257
- Rent vs Own
- Severe rent burden
- 231.0
Population outlook (Montgomery County) Hauer SSP2
- Today (2025)
- 713,896 people
- By 2030
- 805,263 · +12.8%
- By 2040
- 992,708 · +39.1%
- By 2050
- 1,179,590 · +65.2%
- By 2075
- 1,628,084 · +128.1%
- By 2100
- 1,937,880 · +171.5%
Race, ethnicity, and origin ACS 2023
- Neighborhood character
- Majority Hispanic (55%)
- Race & ethnicity
- Hispanic / Latino 55% White 41% Two or more races 11% Black 2%
- Hispanic origin (detail)
- Mexican 51%
- Common ancestry
- Iranian 1% Slovak 1% Lithuanian 1%
- Foreign-born
- 21% · Canada
- Languages at home
- 53% English-only · Spanish 45% German/W. Germanic 1%
Political lean MEDSL · Montgomery
- 2024 margin
- Solid R (+45.5) · D 26.8% · R 72.3%
- 2008→2024 swing
- +7.2pp toward D · 2008: -52.7pp · 2024: -45.5pp
- All cycles
- 2024: R+45.5 2020: R+43.8 2016: R+51.4 2012: R+60.7 2008: R+52.7
Not yet ingested
- Civics
- —
Market trends
- HPI YoY
- ▼ -13.02%
- Current HPI
- 306.3801
- Rent YoY
- —
- Metro
- Houston-The Woodlands-Sugar Land, TX
- State GDP YoY
- ▲ 3.95%
- F500 in state
- 110
Industry mix (Fortune 500 HQ in TX)
| Industry | F500 HQs | Revenue |
|---|---|---|
| Energy | 16 | $1,198B |
|
||
| Technology | 5 | $198B |
|
||
| Engineering / Construction | 4 | $72B |
|
||
| Energy Services | 3 | $60B |
|
||
| Utilities | 3 | $41B |
|
||
| Healthcare | 2 | $330B |
|
||
Price history
-13.4% since first listed13 events — show timeline
- 2026-04-17 Listing Removed — HARMLS
- 2026-04-17 Listed $164,500 HARMLS
- 2026-04-02 Price Changed $164,500 HARMLS
- 2025-11-18 Price Changed $179,000 HARMLS
- 2025-10-25 Listed $185,000 HARMLS
- 2024-02-09 Rental Removed $1,600 HARMLS
- 2024-02-09 Listing Removed — HARMLS
- 2024-02-02 Listed $185,000 HARMLS
- 2024-01-31 Listing Removed — HARMLS
- 2023-12-12 Price Changed $1,600 HARMLS
- 2023-11-15 Listed for Rent $1,700 HARMLS
- 2023-09-29 Price Changed $185,000 HARMLS
- 2023-08-30 Listed $190,000 HARMLS
Property tax history
+46.2%/yrLatest (2025): $5,248 · +0.5% YoY. Source: county tax records.
Cash-flow waterfall
monthlySold comps — $/sqft
last 12 mo · ≤1 miLoading sold comps…