 7-Plex
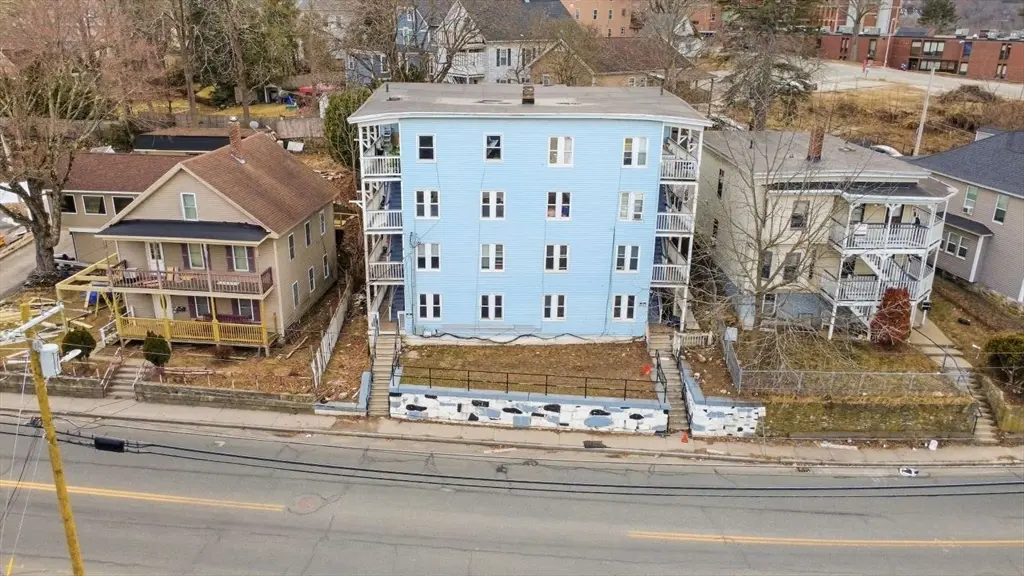
573 Main St · Southbridge Town, MA
Flood risk 1/10 · Minimal
- FEMA flood zone
- X (unshaded)
- Chance of flooding over 30 yrs
- 0.0%
- Est. flood insurance / yr
- $473 – $860
Fire risk 1/10 · Minimal
- Est. fire insurance / yr
- $915 – $1,699
Heat risk 4/10 · Minor
- Hot days now (above 94°F)
- 8 days/yr
- Hot days in 30 yrs
- 17 days/yr
Wind risk 6/10 · Moderate
- Chance of severe wind over 30 yrs
- 27.0%
Air-quality risk 2/10 · Minimal
- Unhealthy air days now
- 2 days/yr
- Unhealthy air days in 30 yrs
- 2 days/yr
Risk factors via First Street. Map © Google.
Why this score? — see what drove the C grade
The composite is a weighted blend of 9 inputs, each scored 0–100. Each bar is that input's sub-score; the figure is the points it added to the 100-point composite (weight × sub-score).
- Cash flow +30.0/30.0
- DSCR +10.0/10.0
- 1% rule +9.3/10.0
- Livability +2.8/5.0
- Rent growth +2.5/5.0
- Condition / age +2.5/5.0
- Schools +1.0/10.0
- ARV discount +0.0/15.0
- Appreciation +0.0/10.0
$1,050,000
🖨 Deal sheet (PDF) 📄 Offer letter ✓ Due diligence
Multi-family units
County records classify this as Multi-Family (5+ Unit). Listing-text estimate: 7 units. confirmed
5+ unit building — per-unit beds/baths from public records are typically unavailable; the breakdown below (if shown) is an estimate from the listing text.
Listing remarks MLS
7-unit multifamily investment opportunity featuring a mix of spacious 2- and 3-bedroom units across four levels, totaling over 7,700 sq ft of living area. Current rents are below market with two vacant units, providing immediate opportunity for lease-up and income growth. Property offers off-street parking, separate living layouts, and consistent rental demand in the area. Currently two vacant units, potentially being filled soon* Select units have been updated, and the building has been maintained over time. Tenants are responsible for their own utilities. Ideal for investors seeking in-place income with the ability to increase cash flow through rent optimization and stabilization. Financials reflect current rent roll only; buyer to perform due diligence.
Key facts
- Updated units
- Maintained building
- Off-street parking
Tags
Neighborhood map
What this means for you Summary
Snapshot
- This is a 7 × 3-bed/1.0-bath units multifamily listed at $1.05M.
Deal economics
- At list price, monthly cash flow is $5k ($65k/yr) — positive. Per door: $773/mo.
- The deal already cash-flows at list — no discount required.
- Meets the 1% rule at list price ($15k rent vs $1.05M).
- Recommended offer: $1.02M (3.0% below list) — sets the bar for market timing.
- Cap rate 12.5% vs local median 3.6% in Southbridge Town — top-decile yield for the area; either an underpriced asset or a hidden risk that comps aren't pricing in. Stress-test before assuming the spread holds.
Location & tenants
- Location reads 56/100 on livability (#235 in MA) — a working-class tenant base; expect higher turnover. Strengths: housing A+; Watch: cost of living C-, employment D, amenities F.
- Southbridge (suburban): math 5% / reading 17% proficiency, ranked #301 of 302 in MA (top 100%) — low school quality limits family demand, transient renter base, plan for 1-2y turnover; 63% free/reduced lunch — lower-income household profile, screen leases tightly.
- Zoned schools: Southbridge Middle School (math 4% / reading 11%, grade F, #298 of 305 statewide, top 98%, 405 students, 0% FRL) — zoned schools average 0% FRL vs 63% district-wide (63 pts lower); this property's tenant base skews higher-income than the district average.
- Market conditions: 41 active listings in the ZIP; 2,293 units permitted in Worcester County in 2024 (1,205 in 5+ unit buildings).
- At $14,990/mo this rent would consume 271% of the median local household income ($66k/yr) (locally 1217% of renters already pay >50% of income on rent) — very limited rent-growth headroom before tenants either downsize or default.
Forward outlook
- Local home prices are declining (-3.0%/yr); year-one equity from $7k of loan paydown is wiped out by about $32k of value loss. Plan a longer hold.
- At projected returns (-3.0% appreciation + 3.0% rent growth), your $294k cash investment doubles in ~6 years — after that, you're playing with house money.
Negotiation context
- It's been on market 43 days — a 3% lower offer ($1.02M) is reasonable based on typical stale-listing flexibility.
- 2 sale attempts since 2y ago with the ask held roughly flat each time — persistent listings suggest the price (not the market) is what's stuck; bring a comps-based counter.
Risks & watch-outs
- Watch-outs: built in 1915 — expect roof / HVAC / electrical / plumbing capex.
- Climate carrying-cost: major wind risk, 27% chance of damaging wind over 30y — expect insurance premiums to compound above CPI over the hold.
Questions for the listing agent
- It's been on market 43 days. Have you received any prior offers? Is the seller open to a 3% concession, seller financing, or rate buy-down credit?
- Can we see the unit-by-unit rent roll, current vacancy, and any below-market leases? What's the average tenancy length?
- What capital expenditures (roof, boiler, parking lot, exteriors) have been made in the last 5 years, and what's planned in the next 2?
- Built in 1915 — when were the roof, HVAC, electrical panel, plumbing, and water heater last replaced?
- Is there a deadline driving the sale (1031 exchange, divorce, estate, relocation)? That informs how much negotiation room exists.
- Schools are F-rated, which usually means shorter tenancies and higher turnover. Who's the typical renter profile here, and what's been the actual vacancy rate?
- What's the average days-on-market for RENTAL listings here right now (not sales)? A rising rental-DOM trend means longer vacancies and softer asking-rent achievability than the comps imply.
- What's the recent tenant-quality profile in this submarket — average credit score on applications, eviction rate, late-payment / NSF rate, and stable-employment percentage? A property-management company in the area should have these aggregated.
- How much new apartment / multifamily construction is in the pipeline within 1–3 miles? Heavy new supply (>2% of stock underway) typically softens rents 12–24 months out; light construction supports rent growth.
Investment metrics
- 1% rule
- 1.43% ✓
- Cap rate
- 12.47%
- Cash-on-cash
- 22.07%
- DSCR
- 1.98
- GRM
- 5.8
CMA / ARV
- ARV (median comp)
- $765,619
- List price
- $1,050,000
- Delta
- 37.14%
- Verdict
- OVERPRICED
- Comps
- 9 within 1.0 mi
Projected returns pro-forma
-3.0% appreciation · 3.0% rent growth · sell at horizon
- IRR
- 14.8%
- Equity multiple
- 1.59×
- Total profit
- $173,990
- Equity at exit
- $156,558
- IRR
- 23.5%
- Equity multiple
- 3.02×
- Total profit
- $593,863
- Equity at exit
- $90,785
Cash invested: $294,000 (down + closing). Projections, not guarantees.
Landlord ↔ Tenant lean methodology
- Overall (STATE)
- 20 Strongly Tenant-Friendly
- State Massachusetts
- 20 Strongly Tenant-Friendly · D+15
- County
- — inherits STATE
- City
- — inherits STATE
ZIP-level market 01550
- Home prices YoY
- -7.8%
- Active inventory
- 41
- Price-to-rent
- 40.9×
Monthly cashflow live
- Estimated rent
- $14,990 high interval (Pro) →
- Mortgage (P&I)
- −$5,506
- Tax from tax record
- −$491 /mo · $5,888/yr
- Insurance
- −$438
- HOA
- −$0
- Vacancy / Maint / Mgmt
- −$3,148
- Net cashflow
- $5,408
Break-even live
Sensitivity live
| Price | -10% $6,002 | -5% $5,705 | +0% $5,408 | +5% $5,110 | +10% $4,813 |
|---|---|---|---|---|---|
| Rent | -10% $4,223 | -5% $4,816 | +0% $5,408 | +5% $6,000 | +10% $6,592 |
| Rate | -1.0pp $5,936 | -0.5pp $5,675 | base $5,408 | +0.5pp $5,136 | +1.0pp $4,859 |
7-unit breakdown (identical units grouped — click to expand)
| Units | Beds | Baths | Est. rent |
|---|---|---|---|
| 7× units | 3 | 1 | $14,987 |
| #1 | 3 | 1 | $2,141 |
| #2 | 3 | 1 | $2,141 |
| #3 | 3 | 1 | $2,141 |
| #4 | 3 | 1 | $2,141 |
| #5 | 3 | 1 | $2,141 |
| #6 | 3 | 1 | $2,141 |
| #7 | 3 | 1 | $2,141 |
| Total (7 units) | $14,990 | ||
UW: 25.0% down · 7.5% · 30yr · 1.5% tax · 5.0% vac · 8.0% maint · 8.0% mgmt
Financing live
Cash to close
- Down payment
- $262,500
- Closing costs
- $31,500
- Reserves months
- —
- Total cash needed
- —
Loan-product check · same deal, 3 products live
Conventional
25% down · 7.5% · 30yr
- Down + closing
- —
- Monthly P&I
- —
- Monthly cashflow
- —
- DSCR
- —
- Eligible?
- —
Personal DTI + credit; lowest rate.
DSCR
20% down · 8.5% · 30yr
- Down + closing
- —
- Monthly P&I
- —
- Monthly cashflow
- —
- DSCR
- —
- Eligible?
- —
No personal income docs; deal must DSCR.
Hard money
10% down · 12.0% · 12mo
- Down + closing
- —
- Monthly P&I
- —
- Monthly cashflow
- —
- DSCR
- —
- Eligible?
- —
Short-term bridge; refi at stabilization.
Listing history 4 events
-
2026-04-13$1,050,000 New 766-char remark
Show marketing remark (766 chars)
7-unit multifamily investment opportunity featuring a mix of spacious 2- and 3-bedroom units across four levels, totaling over 7,700 sq ft of living area. Current rents are below market with two vacant units, providing immediate opportunity for lease-up and income growth. Property offers off-street parking, separate living layouts, and consistent rental demand in the area. Currently two vacant units, potentially being filled soon* Select units have been updated, and the building has been maintained over time. Tenants are responsible for their own utilities. Ideal for investors seeking in-place income with the ability to increase cash flow through rent optimization and stabilization. Financials reflect current rent roll only; buyer to perform due diligence.
-
2024-11-14historical $1,750
-
2024-11-12price $1,750
-
2024-08-24$1,950
ⓘ Source: listings_history table (triggers on properties + properties_extension) + one-shot
backfill from property_details.listing_events for pre-trigger history.
Tax reassessment forecast MA · Partial reset (capped growth)
- Current annual tax
- $5,888 · $491/mo
- Projected year-2 tax
- $9,402 · $783/mo
- Expected delta
- +$3,514/yr (+$293/mo · 59.7%)
ⓘ Screening estimate from a state-policy table — verify with the county assessor before closing.
Climate risk First Street
- Flood 1/10 Low FEMA zone X (unshaded) · 0% chance over 30 yrs
- Wildfire 1/10 Low
- Heat 4/10 Moderate 8 d/yr ≥94°F today · 17 d/yr by 30 yrs out
- Wind 6/10 Major 27% chance of damaging wind over 30 yrs
- Air quality 2/10 Low 2 unhealthy d/yr today · 2 by 30 yrs out
Nearby sold comps map
Loading sold comps map…
Walkable amenities ~0.75 mi
Loading nearby amenities…
Taxation est. · year 1
- Rental income
- $179,880
- − Mortgage interest
- −$58,816
- − Property taxes
- −$5,888
- − Insurance
- −$5,250
- − Repairs & maintenance
- −$14,390
- − Management
- −$14,390
- − Depreciation
- −$30,545
- Taxable income
- $50,599
- Est. tax owed @ 24.0%
- −$12,144
- After-tax cash flow
- $52,748/yr
For passive investors: Depreciation is non-cash, so a rental often shows a tax loss while cash-flowing — sheltering income. Rental losses are passive: they offset passive income freely, and up to $25,000/yr can offset ordinary (W-2) income if you actively participate and your MAGI is under $100k (phasing out to $0 by $150k); unused losses carry forward. On sale, claimed depreciation is recaptured at up to 25%, and gains may owe capital-gains tax (a 1031 exchange can defer both). Figures are a year-1 estimate at your 24.0% rate — not tax advice; consult a CPA.
Schools (NCES district)
- District
- Southbridge
- NCES district ID
- 2511010
- Math proficiency
- 5% ▼ -5.00%
- Reading proficiency
- 17% ▼ -1.00%
- Median HH income
- $45,438
- Composite
- 9.97/100
- National rank
- #9814
- State rank
- #301 of 302 in MA
Livability — Southbridge Town
- Score
- 56/100
- State rank
- #235
- US rank
- #22429
Category grades
Schools grade is shown separately in the Schools card above.
Census & demographics
- Census place
- Southbridge Town, MA
- County
- Worcester County · 487,911 people
- City population
- 17,806
- Metro
- Worcester, MA-CT
- Population (ZIP)
- 17,928
- Household income
- $66,287
- Rent vs Own
- Severe rent burden
- 1217.0
Population outlook (Worcester County) Hauer SSP2
- Today (2025)
- 850,858 people
- By 2030
- 860,403 · +1.1%
- By 2040
- 869,902 · +2.2%
- By 2050
- 869,110 · +2.1%
- By 2075
- 870,120 · +2.3%
- By 2100
- 829,703 · -2.5%
Race, ethnicity, and origin ACS 2023
- Neighborhood character
- Majority White (54%)
- Race & ethnicity
- White 54% Hispanic / Latino 40% Two or more races 21% Black 3%
- Hispanic origin (detail)
- Puerto Rican 35% Dominican 2%
- Common ancestry
- Lithuanian 13% Romanian 4% German 1%
- Foreign-born
- 4% · Canada
- Languages at home
- 65% English-only · Spanish 31% French/Haitian/Cajun 1% Other Indo-European 1%
Political lean MEDSL · Worcester
- 2024 margin
- D (+10.0) · D 53.9% · R 43.9% · Other 2.2%
- 2008→2024 swing
- -3.8pp toward R · 2008: 13.8pp · 2024: 10.0pp
- All cycles
- 2024: D+10.0 2020: D+17.8 2016: D+10.5 2012: D+9.2 2008: D+13.8
Not yet ingested
- Civics
- —
Market trends
- HPI YoY
- ▼ -23.80%
- Current HPI
- 280.5379
- Rent YoY
- —
- Metro
- Worcester, MA-CT
- State GDP YoY
- ▲ 2.28%
- F500 in state
- 38
Industry mix (Fortune 500 HQ in MA)
| Industry | F500 HQs | Revenue |
|---|---|---|
| Technology | 3 | $17B |
|
||
| Insurance | 2 | $84B |
|
||
| Retail | 2 | $76B |
|
||
| Life Sciences | 1 | $43B |
|
||
| Energy Technology | 1 | $31B |
|
||
| Aerospace / Defense | 1 | $18B |
|
||
Price history
+53746.2% since first listed4 events — show timeline
- 2026-04-13 Listed $1,050,000 MLS PIN
- 2024-11-14 Rental Removed $1,750 BUILDIUM
- 2024-11-12 Price Changed $1,750 BUILDIUM
- 2024-08-24 Listed for Rent $1,950 BUILDIUM
Property tax history
+3.2%/yrLatest (2023): $5,888 · +6.2% YoY. Source: county tax records.
Cash-flow waterfall
monthlySold comps — $/sqft
last 12 mo · ≤1 miLoading sold comps…