4620 Avenue · Birmingham, AL
Flood risk 1/10 · Minimal
- FEMA flood zone
- X (unshaded)
- Chance of flooding over 30 yrs
- 0.0%
- Est. flood insurance / yr
- $473 – $860
Fire risk 1/10 · Minimal
- Est. fire insurance / yr
- $916 – $1,700
Heat risk 7/10 · Major
- Hot days now (above 106°F)
- 7 days/yr
- Hot days in 30 yrs
- 19 days/yr
Wind risk 6/10 · Moderate
- Chance of severe wind over 30 yrs
- 27.0%
Air-quality risk 4/10 · Minor
- Unhealthy air days now
- 5 days/yr
- Unhealthy air days in 30 yrs
- 5 days/yr
Risk factors via First Street. Map © Google.
Why this score? — see what drove the C- grade
The composite is a weighted blend of 9 inputs, each scored 0–100. Each bar is that input's sub-score; the figure is the points it added to the 100-point composite (weight × sub-score).
- Cash flow +25.6/30.0
- DSCR +8.5/10.0
- 1% rule +6.7/10.0
- Rent growth +4.3/5.0
- Livability +3.4/5.0
- Condition / age +2.5/5.0
- Schools +0.9/10.0
- ARV discount +0.0/15.0
- Appreciation +0.0/10.0
$110,000
🖨 Deal sheet 📄 Offer letter ✓ Due diligence
Listing remarks
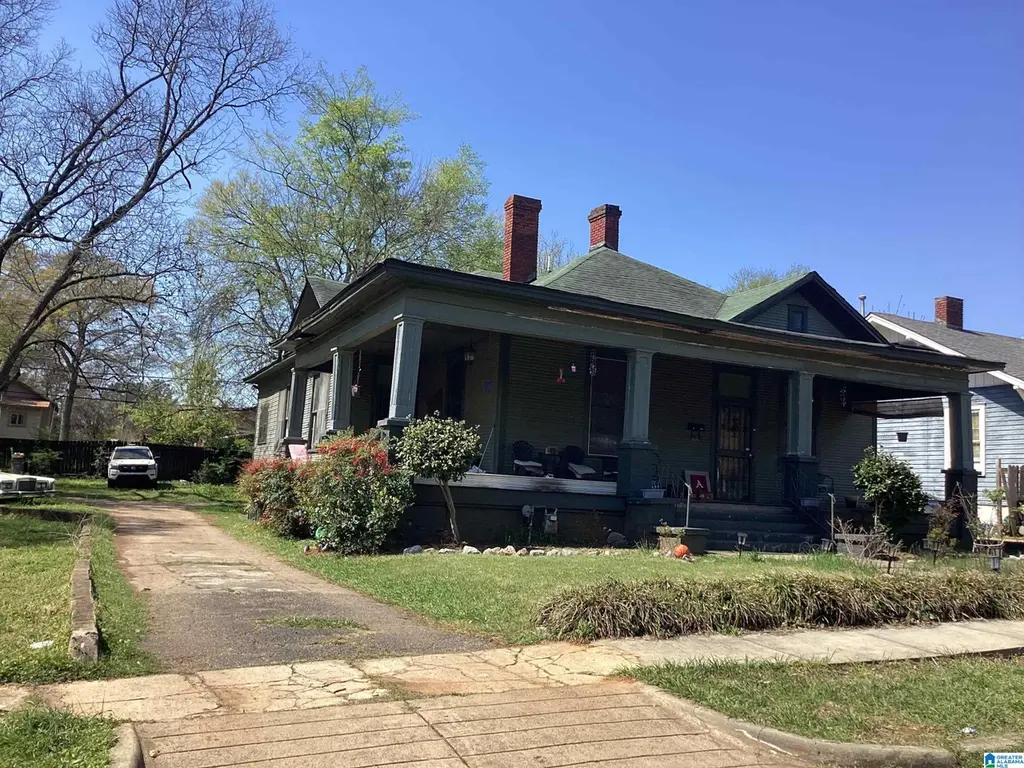
Step into timeless character and endless potential with this charming older home featuring 4 bedrooms and 2.5 baths. Rich in detail, this residence welcomes you with a beautiful fireplace in a spacious living room filled with natural light—perfect for relaxing or entertaining—and a formal dining room ready to host memorable gatherings. Classic architectural touches and original features add warmth and personality throughout, offering the perfect canvas for your personal updates. The layout is both functional and inviting, with generously sized bedrooms and a convenient half bath for guests. While the home could benefit from a little TLC, it is move-in ready—making it ideal
Key facts
- Move-in ready
- Formal dining room
- Original features
Tags
Property features AI
Finance
- Financial info: Down payment assistance available
Exterior
- Parking: Driveway and on-street parking; 2-space carport
- Utilities: Public water; Connected sewer; Gas water heater; Internet service available
- Home design: Existing single-family residence; Not a tri-level, split-level, or split-foyer home
- Construction: Vinyl siding; Crawl space foundation
- Exterior features: Front porch
Interior
- Kitchen: Laminate countertops; Refrigerator; Gas stove
- Bedrooms: Multiple bedrooms located on main level
- Flooring: Hardwood; Tile
- Bathrooms: Two full bathrooms and one half bathroom; Tub/shower combo
- Heating & cooling: Gas heating; Central air conditioning
- Interior features: Smooth ceilings; Hardwood and tile floors; One wood-burning, masonry see-through fireplace serving living room and bedroom
- Laundry & utility: Main-level laundry in a closet; Washer hookup and electric dryer hookup; Floor drain in laundry area; Attic with pull-down access
Neighborhood map
What this means for you Summary
Snapshot
- This is a 4-bed/1.0-bath single-family listed at $110k.
Deal economics
- At list price, monthly cash flow is $260 ($3k/yr) — positive.
- The deal already cash-flows at list — no discount required.
- Meets the 1% rule at list price ($1k rent vs $110k).
- Recommended offer: $107k (3.0% below list) — sets the bar for market timing.
- Cap rate 9.1% vs local median 6.2% in Birmingham — top-decile yield for the area; either an underpriced asset or a hidden risk that comps aren't pricing in. Stress-test before assuming the spread holds.
Location & tenants
- Location reads 67/100 on livability (#78 in AL) — a middle-class / working-renter tenant base. Strengths: commute A+, cost of living A+, housing A+; Watch: amenities C-, crime F, employment F.
- Birmingham City (urban): math 4% / reading 20% proficiency, ranked #116 of 129 in AL (top 90%) — low school quality limits family demand, transient renter base, plan for 1-2y turnover; 82% free/reduced lunch — lower-income household profile, screen leases tightly.
- Zoned schools: Central Park Elementary School (math 0% / reading 12%, grade F, #616 of 627 statewide, top 98%, 447 students, 83% FRL) — zoned schools at 83% FRL track the district average.
- Market conditions: Rents rising fast (+7.2%/yr); 122 active listings in the ZIP; 40 comparable units currently listed for rent nearby; rentals at typical pace (median 24d on market — plan ~3-4 weeks tenant-placement turnaround); 45% of comp listings sitting > 30 days — soft ceiling on asking rent; lower-income renter base — watch delinquency; 2,114 units permitted in Jefferson County in 2024 (556 in 5+ unit buildings).
Forward outlook
- Local home prices are declining (-3.0%/yr); year-one equity from $761 of loan paydown is wiped out by about $3k of value loss. Plan a longer hold.
- Jefferson County population projected to shrink 4% by 2050 — rents likely to lag national; underwrite the cash flow, not the appreciation.
- At projected returns (-3.0% appreciation + 7.2% rent growth), your $31k cash investment doubles in ~8 years — after that, you're playing with house money.
Negotiation context
- It's been on market 49 days — a 3% lower offer ($107k) is reasonable based on typical stale-listing flexibility.
- 2 sale attempts with the ask held roughly flat each time — persistent listings suggest the price (not the market) is what's stuck; bring a comps-based counter.
- Current owner paid $30k; list at $110k implies a 267% gain — meaningful room to come down on a strong offer.
Risks & watch-outs
- Watch-outs: built in 1910 — expect roof / HVAC / electrical / plumbing capex.
- Climate carrying-cost: major wind risk, 27% chance of damaging wind over 30y; extreme-heat days projected 7→19/yr by 2055 (HVAC capex compounding) — expect insurance premiums to compound above CPI over the hold.
Questions for the listing agent
- It's been on market 49 days. Have you received any prior offers? Is the seller open to a 3% concession, seller financing, or rate buy-down credit?
- Built in 1910 — when were the roof, HVAC, electrical panel, plumbing, and water heater last replaced?
- Is there a deadline driving the sale (1031 exchange, divorce, estate, relocation)? That informs how much negotiation room exists.
- Schools are F-rated, which usually means shorter tenancies and higher turnover. Who's the typical renter profile here, and what's been the actual vacancy rate?
- Crime grade is F in this area — have there been break-ins, vandalism, or insurance claims at this property in the last 3 years? What carrier currently insures it and at what premium?
- What's the average days-on-market for RENTAL listings here right now (not sales)? A rising rental-DOM trend means longer vacancies and softer asking-rent achievability than the comps imply.
- What's the recent tenant-quality profile in this submarket — average credit score on applications, eviction rate, late-payment / NSF rate, and stable-employment percentage? A property-management company in the area should have these aggregated.
- How much new for-sale + rental construction is in the pipeline within 1–3 miles? Heavy new supply typically softens prices + rents 12–24 months out; constrained supply supports both.
Investment metrics
- 1% rule
- 1.17% ✓
- Cap rate
- 9.13%
- Cash-on-cash
- 10.14%
- DSCR
- 1.45
- GRM
- 7.1
CMA / ARV
- ARV (median comp)
- $82,852
- List price
- $110,000
- Delta
- 32.77%
- Verdict
- OVERPRICED
- Comps
- 20 within 1.0 mi
Show comp detail 12 sales within ~0.75 mi
| Address | Dist | Beds/Ba | Sqft | Sold | Price | $/sf | Match |
|---|---|---|---|---|---|---|---|
| 4624 Court R | 0.15mi | 3/2.0 (-1) | 1,887 (-3%) | 1mo | $35,000 | $19 | 79 |
| 1563 Martin Ave | 0.46mi | 4/2.0 | 1,848 (-5%) | 6mo | $69,000 | $37 | 61 |
| 3066 Avenue T | 0.50mi | 5/2.5 (+1) | 1,903 (-2%) | 2mo | $230,000 | $121 | 61 |
| 1627 49th St | 0.46mi | 3/1.0 (-1) | 1,863 (-4%) | 9mo | $79,500 | $43 | 59 |
| 1428 41st St | 0.52mi | 3/2.0 (-1) | 2,038 (+5%) | 3mo | $170,750 | $84 | 56 |
| 1632 43rd St | 0.26mi | 3/2.0 (-1) | 1,655 (-15%) | 10mo | $104,000 | $63 | 46 |
| 1611 31st Street Ensley | 0.62mi | 4/1.0 | 1,710 (-12%) | 9mo | $90,000 | $53 | 44 |
| 2116 Warrior Rd | 0.54mi | 3/1.0 (-1) | 1,720 (-11%) | 9mo | $50,000 | $29 | 44 |
| 4716 Avenue | 0.65mi | 3/2.0 (-1) | 1,810 (-7%) | 9mo | $115,000 | $64 | 42 |
| 1305 41st St | 0.71mi | 3/1.0 (-1) | 1,760 (-9%) | 10mo | $65,000 | $37 | 38 |
| 1212 45th St | 0.73mi | 5/3.0 (+1) | 2,120 (+9%) | 9mo | $175,000 | $83 | 30 |
| 1633 29th St | 0.73mi | 3/1.5 (-1) | 1,658 (-14%) | 8mo | $105,000 | $63 | 28 |
Match score weights: distance 35% · size 25% · config 20% · recency 20%. Top-matched comps best support the ARV.
Projected returns pro-forma
-3.0% appreciation · 7.24% rent growth · sell at horizon
- IRR
- 3.6%
- Equity multiple
- 1.15×
- Total profit
- $4,514
- Equity at exit
- $16,401
- IRR
- 16.8%
- Equity multiple
- 2.66×
- Total profit
- $51,084
- Equity at exit
- $9,511
Cash invested: $30,800 (down + closing). Projections, not guarantees.
Landlord ↔ Tenant lean methodology
- Overall (STATE)
- 90 Strongly Landlord-Friendly
- State Alabama
- 90 Strongly Landlord-Friendly · R+15
- County
- — inherits STATE
- City
- — inherits STATE
ZIP-level market 35208
- Home prices YoY
- -18.1%
- Rents YoY
- 7.2%
- Active inventory
- 122
- Price-to-rent
- 7.1×
Monthly cashflow live
- Estimated rent
- $1,292 high interval (Pro) →
- Mortgage (P&I)
- −$577
- Tax est. 1.5%
- −$138 /mo · $1,650/yr
- Insurance
- −$46
- HOA
- −$0
- Vacancy / Maint / Mgmt
- −$271
- Net cashflow
- $260
Break-even live
UW: 25.0% down · 7.5% · 30yr · 1.5% tax · 5.0% vac · 8.0% maint · 8.0% mgmt
Financing live
Cash to close
- Down payment
- $27,500
- Closing costs
- $3,300
- Reserves months
- —
- Total cash needed
- —
Loan-product check · same deal, 3 products live
Conventional
25% down · 7.5% · 30yr
- Down + closing
- —
- Monthly P&I
- —
- Monthly cashflow
- —
- DSCR
- —
- Eligible?
- —
Personal DTI + credit; lowest rate.
DSCR
20% down · 8.5% · 30yr
- Down + closing
- —
- Monthly P&I
- —
- Monthly cashflow
- —
- DSCR
- —
- Eligible?
- —
No personal income docs; deal must DSCR.
Hard money
10% down · 12.0% · 12mo
- Down + closing
- —
- Monthly P&I
- —
- Monthly cashflow
- —
- DSCR
- —
- Eligible?
- —
Short-term bridge; refi at stabilization.
Rent comps 40 comps
| Address | Beds | Baths | Sqft | Rent | $/sqft | DOM | Units | Dist |
|---|---|---|---|---|---|---|---|---|
| 4637 Court S Birmingham, AL | 3.0 | 1.0 | 1225 | $975 | $0.80 | 2d | 1 | 0.12mi |
| 4612 Terrace S Birmingham, AL | 3.0 | 1.0 | 1612 | $1,050 | $0.65 | 43d | 1 | 0.15mi |
| 4732 Court S Birmingham, AL | 3.0 | 1.0 | 1372 | $1,100 | $0.80 | 43d | 1 | 0.17mi |
| 4736 Court S Birmingham, AL | 3.0 | 1.5 | 1300 | $1,200 | $0.92 | 3d | 1 | 0.18mi |
| 4801 Avenue S Birmingham, AL | 3.0 | 1.0 | 1310 | $1,000 | $0.76 | 43d | 1 | 0.20mi |
| 4636 Avenue T Unit T Birmingham, AL | 4.0 | 1.5 | 1842 | $1,500 | $0.81 | 1d | 1 | 0.22mi |
| 4105 Avenue Q Unit Q Birmingham, AL | 3.0 | 3.0 | 1760 | $1,250 | $0.71 | 3d | 1 | 0.24mi |
| 4825 Avenue S Birmingham, AL | 3.0 | 1.0 | 1310 | $1,050 | $0.80 | 16d | 1 | 0.26mi |
| 4817 Court R Birmingham, AL | 3.0 | 2.0 | 1530 | $1,300 | $0.85 | 16d | 1 | 0.26mi |
| 1617 42nd Street Ensley Unit ENSLEY Birmingham, AL | 3.0 | 1.0 | 1413 | $1,030 | $0.73 | 16d | 1 | 0.29mi |
| 1607 43rd Street Ensley Unit ENSLEY Birmingham, AL | 3.0 | 2.0 | 1435 | $1,150 | $0.80 | 23d | 1 | 0.30mi |
| 2017 48th Street Ensley Birmingham, AL | 3.0 | 2.0 | 1383 | $1,250 | $0.90 | 43d | 1 | 0.35mi |
| 2520 Avenue U Unit A Birmingham, AL | 4.0 | 1.0 | 1260 | $1,200 | $0.95 | 43d | 1 | 0.38mi |
| 2133 47th Street Ensley Unit ENSLEY Birmingham, AL | 3.0 | 1.5 | 1308 | $1,300 | $0.99 | 43d | 1 | 0.39mi |
| 1526 42nd Street Ensley Unit ENSLEY Birmingham, AL | 4.0 | 1.5 | 1600 | $1,050 | $0.66 | 43d | 1 | 0.41mi |
| 1509 44th Street Ensley Unit ENSLEY Birmingham, AL | 3.0 | 1.5 | 1260 | $1,123 | $0.89 | 11d | 1 | 0.43mi |
| 1515 45th Street Ensley Unit ENSLEY Birmingham, AL | 3.0 | 1.0 | 1440 | $875 | $0.61 | 3d | 1 | 0.44mi |
| 1563 Martin Ave Birmingham, AL | 4.0 | 2.0 | 1848 | $1,495 | $0.81 | 1d | 1 | 0.44mi |
| 1436 44th Street Ensley Unit ENSLEY Birmingham, AL | 4.0 | 2.0 | 1435 | $1,495 | $1.04 | 1d | 1 | 0.48mi |
| 1632 51st St W Birmingham, AL | 3.0 | 1.0 | 1337 | $1,000 | $0.75 | 2d | 1 | 0.53mi |
| 1632 51st Street Ensley Unit ENSLEY Birmingham, AL | 3.0 | 1.0 | 1337 | $1,100 | $0.82 | 43d | 1 | 0.53mi |
| 200 23rd St SW Birmingham, AL | 5.0 | 1.0 | 1858 | $1,400 | $0.75 | 43d | 1 | 0.62mi |
| 1345 46th Street Ensley Unit ENSLEY Birmingham, AL | 3.0 | 2.0 | 1617 | $1,175 | $0.73 | 3d | 1 | 0.62mi |
| 1724 30th Street Ensley Birmingham, AL | 4.0 | 2.0 | 1428 | $1,395 | $0.98 | 16d | 1 | 0.67mi |
| 3017 Ensley Ave Birmingham, AL | 3.0 | 1.0 | 1540 | $1,400 | $0.91 | 1d | 1 | 0.69mi |
| 1417 Bessemer Rd Birmingham, AL | 3.0 | 1.0 | 1688 | $1,200 | $0.71 | 43d | 1 | 0.69mi |
| 1633 29th Street Ensley Birmingham, AL | 3.0 | 2.0 | 1658 | $1,200 | $0.72 | 43d | 1 | 0.74mi |
| 1545 29th Street Ensley Birmingham, AL | 3.0 | 1.5 | 1331 | $1,200 | $0.90 | 43d | 1 | 0.78mi |
| 1900 Saint Charles Ave SW Birmingham, AL | 4.0 | 2.0 | 1623 | $1,350 | $0.83 | 2d | 1 | 0.79mi |
| 1037 47th Street Ensley Unit ENSLEY Birmingham, AL | 3.0 | 2.0 | 1299 | $1,000 | $0.77 | 43d | 1 | 0.88mi |
| 1872 Princeton Ct SW Birmingham, AL | 5.0 | 2.0 | 1829 | $1,700 | $0.93 | 23d | 1 | 0.88mi |
| 5713 Avenue P Unit P Birmingham, AL | 3.0 | 1.0 | 1300 | $1,100 | $0.85 | 19d | 1 | 0.88mi |
| 709 30th St SW Birmingham, AL | 3.0 | 1.0 | 1273 | $1,000 | $0.79 | 43d | 1 | 0.88mi |
| 2348 Court R Birmingham, AL | 3.0 | 2.0 | 1792 | $1,769 | $0.99 | 1d | 1 | 0.95mi |
| 2348 Court R Birmingham, AL | 3.0 | 2.0 | 2400 | $1,639 | $0.68 | 19d | 1 | 0.95mi |
| 1313 Pike Rd Birmingham, AL | 3.0 | 1.0 | 1437 | $975 | $0.68 | 43d | 1 | 0.95mi |
| 2436 Avenue S Birmingham, AL | 4.0 | 2.0 | 1800 | $1,400 | $0.78 | 3d | 1 | 0.99mi |
| 2108 25th Street Ensley Birmingham, AL | 4.0 | 2.0 | 1446 | $1,300 | $0.90 | 43d | 1 | 1.00mi |
| 1468 Pike Rd Birmingham, AL | 5.0 | 2.0 | 1729 | $1,385 | $0.80 | 43d | 1 | 1.00mi |
| 5808 Court O Birmingham, AL | 3.0 | 1.5 | 1227 | $1,100 | $0.90 | 43d | 1 | 1.00mi |
Listing history 17 events
-
2026-06-18days on market $110,000 Active 49 DOM
-
2026-06-17days on market $110,000 Active 48 DOM
-
2026-06-16days on market $110,000 Active 47 DOM
-
2026-06-15days on market $110,000 Active 46 DOM
-
2026-06-13days on market $110,000 Active 44 DOM
-
2026-06-10days on market $110,000 Active 41 DOM
-
2026-06-09days on market $110,000 Active 40 DOM
-
2026-06-08days on market $110,000 Active 39 DOM
-
2026-06-08status $110,000 Active 38 DOM
-
2026-06-07days on market $110,000 Contingent 38 DOM
-
2026-06-03days on market $110,000 Contingent 34 DOM
-
2026-06-02days on market $110,000 Contingent 33 DOM
-
2026-06-02status $110,000 Contingent 32 DOM
-
2026-06-01days on market $110,000 Active 32 DOM
-
2026-05-31days on market $110,000 Active 31 DOM
-
2026-04-30$110,000 Active 1009-char remark
-
1991-12-16soldstatus $30,000
ⓘ Source: listings_history table (triggers on properties + properties_extension) + one-shot
backfill from property_details.listing_events for pre-trigger history.
Climate risk First Street
- Flood 1/10 Low FEMA zone X (unshaded) · 0% chance over 30 yrs
- Wildfire 1/10 Low
- Heat 7/10 Severe 7 d/yr ≥106°F today · 19 d/yr by 30 yrs out
- Wind 6/10 Major 27% chance of damaging wind over 30 yrs
- Air quality 4/10 Moderate 5 unhealthy d/yr today · 5 by 30 yrs out
Nearby sold comps map
Loading sold comps map…
Walkable amenities ~0.75 mi
Loading nearby amenities…
Taxation est. · year 1
- Rental income
- $15,500
- − Mortgage interest
- −$6,162
- − Property taxes
- −$1,650
- − Insurance
- −$550
- − Repairs & maintenance
- −$1,240
- − Management
- −$1,240
- − Depreciation
- −$3,200
- Taxable income
- $1,458
- Est. tax owed @ 24.0%
- −$350
- After-tax cash flow
- $2,773/yr
For passive investors: Depreciation is non-cash, so a rental often shows a tax loss while cash-flowing — sheltering income. Rental losses are passive: they offset passive income freely, and up to $25,000/yr can offset ordinary (W-2) income if you actively participate and your MAGI is under $100k (phasing out to $0 by $150k); unused losses carry forward. On sale, claimed depreciation is recaptured at up to 25%, and gains may owe capital-gains tax (a 1031 exchange can defer both). Figures are a year-1 estimate at your 24.0% rate — not tax advice; consult a CPA.
Schools (NCES district)
- District
- Birmingham City
- NCES district ID
- 0100390
- Math proficiency
- 4% ▼ -17.00%
- Reading proficiency
- 20% ▼ -4.00%
- Median HH income
- $31,988
- Composite
- 9.49/100
- National rank
- #9850
- State rank
- #116 of 129 in AL
Livability — Birmingham
- Score
- 67/100
- State rank
- #78
- US rank
- #10412
Category grades
Schools grade is shown separately in the Schools card above.
Census & demographics
- Census place
- Birmingham, AL
- County
- Jefferson County · 527,445 people
- City population
- 210,422
- Metro
- Birmingham-Hoover, AL
- Population (ZIP)
- 13,412
- Household income
- $38,561
- Rent vs Own
- Severe rent burden
- 573.0
Population outlook (Jefferson County) Hauer SSP2
- Today (2025)
- 669,185 people
- By 2030
- 669,694 · +0.1%
- By 2040
- 661,388 · -1.2%
- By 2050
- 643,086 · -3.9%
- By 2075
- 577,267 · -13.7%
- By 2100
- 474,758 · -29.1%
Race, ethnicity, and origin ACS 2023
- Neighborhood character
- Predominantly Black (94%)
- Race & ethnicity
- Black 94% White 4% Hispanic / Latino 2% Two or more races 1%
- Foreign-born
- 3% · Canada
- Languages at home
- 96% English-only · Spanish 2%
Political lean MEDSL · Jefferson
- 2024 margin
- D (+10.4) · D 54.6% · R 44.2% · Other 1.2%
- 2008→2024 swing
- +5.4pp toward D · 2008: 5.1pp · 2024: 10.4pp
- All cycles
- 2024: D+10.4 2020: D+13.2 2016: D+7.2 2012: D+6.0 2008: D+5.1
Not yet ingested
- Civics
- —
Market trends
- HPI YoY
- ▼ -33.99%
- Current HPI
- 153.414
- Rent YoY
- ▲ 7.24%
- Metro
- Birmingham-Hoover, AL
- State GDP YoY
- ▲ 2.94%
- F500 in state
- 4
Industry mix (Fortune 500 HQ in AL)
| Industry | F500 HQs | Revenue |
|---|---|---|
| Financial Services | 1 | $8B |
|
||
| Healthcare | 1 | $5B |
|
||
Price history
+266.7% since first listed4 events — show timeline
- 2026-06-07 Relisted — Greater Alabama MLS
- 2026-06-02 Contingent — Greater Alabama MLS
- 2026-04-30 Listed $110,000 Greater Alabama MLS
- 1991-12-16 Sold (Public Records) $30,000 Public Records
Cash-flow waterfall
monthlySold comps — $/sqft
last 12 mo · ≤1 miLoading sold comps…