26573 Fawn Dr · Hempstead, TX
Flood risk 1/10 · Minimal
- FEMA flood zone
- X (unshaded)
- Chance of flooding over 30 yrs
- 0.0%
- Est. flood insurance / yr
- $507 – $1,088
Fire risk 4/10 · Minor
- Est. fire insurance / yr
- $1,222 – $2,270
Heat risk 8/10 · Major
- Hot days now (above 111°F)
- 7 days/yr
- Hot days in 30 yrs
- 21 days/yr
Wind risk 8/10 · Major
- Chance of severe wind over 30 yrs
- 99.0%
Air-quality risk 2/10 · Minimal
- Unhealthy air days now
- 1 days/yr
- Unhealthy air days in 30 yrs
- 1 days/yr
Risk factors via First Street. Map © Google.
Why this score? — see what drove the B+ grade
The composite is a weighted blend of 9 inputs, each scored 0–100. Each bar is that input's sub-score; the figure is the points it added to the 100-point composite (weight × sub-score).
- Cash flow +25.8/30.0
- ARV discount +15.0/15.0
- Appreciation +10.0/10.0
- DSCR +8.6/10.0
- 1% rule +6.8/10.0
- Livability +3.0/5.0
- Schools +2.9/10.0
- Rent growth +2.5/5.0
- Condition / age +2.5/5.0
$118,000
🖨 Deal sheet (PDF) 📄 Offer letter ✓ Due diligence
Listing remarks MLS
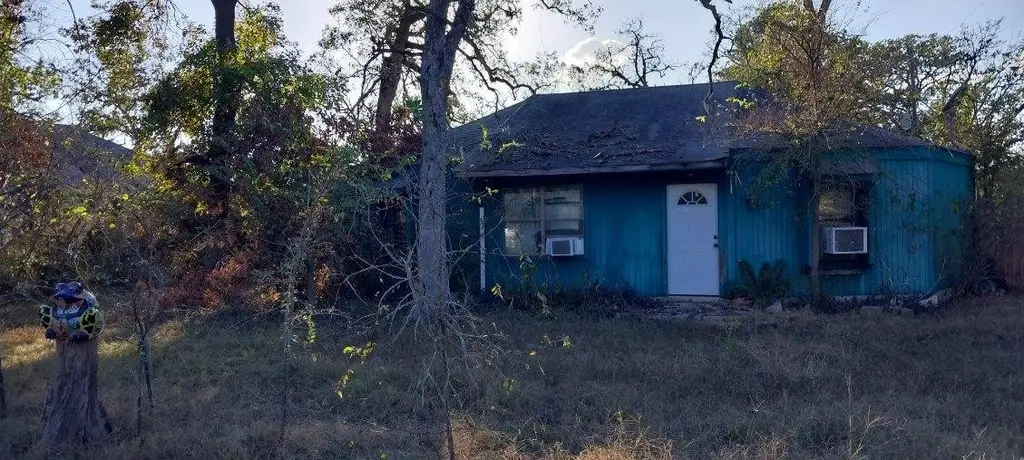
Investor Opportunity!! Welcome to a spacious and mainly cleared half acre property located in the peaceful countryside of Hempstead. The property currently features a 3-bedroom, 2-bathroom home on a half acre lot. Home needs TLC, updates and renovations, all utilities in place. Conveniently located with easy access to Highway 6 and 290, this property is close to both Hempstead and Waller, making it easy to enjoy rural living while still being within reach of modern amenities. Whether you’re looking for a primary residence, a weekend retreat, or an investment opportunity, 26573 Fawn Drive offers endless potential in a serene and picturesque setting. New homes all around in a gated country subdivision with amenities within neighborhood. Don’t miss your chance to own this wonderful piece of Texas countryside!
Key facts
- Half acre property
- Serene setting
- 0.55 acre lot
Tags
Neighborhood map
What this means for you Summary
Snapshot
- This is a 3-bed/2.0-bath single-family listed at $118k.
Deal economics
- At list price, monthly cash flow is $287 ($3k/yr) — positive.
- The deal already cash-flows at list — no discount required.
- Meets the 1% rule at list price ($1k rent vs $118k).
- Recommended offer: $107k (9.0% below list) — sets the bar for market timing.
- Cap rate 9.2% vs local median 2.4% in Hempstead — top-decile yield for the area; either an underpriced asset or a hidden risk that comps aren't pricing in. Stress-test before assuming the spread holds.
Location & tenants
- Location reads 60/100 on livability (#1,099 in TX) — a middle-class / working-renter tenant base. Strengths: cost of living A+, housing A+; Watch: crime D+, employment D, amenities F.
- Waller ISD (rural): math 30% / reading 35% proficiency, ranked #532 of 826 in TX (top 64%) — families likely to look elsewhere, expect single-tenant / working-renter base with shorter leases.
- Zoned schools: Fields Store El (math 47% / reading 43%, grade D-, #1,133 of 4,322 statewide, top 27%, 663 students, 63% FRL); Schultz J H (math 31% / reading 37%, grade F, #892 of 1,662 statewide, top 55%, 1,120 students, 65% FRL); Waller H S (math 25% / reading 40%, grade F, #1,029 of 1,632 statewide, top 64%, 2,639 students, 62% FRL) — zoned schools at 63% FRL track the district average.
- Market conditions: 425 active listings in the ZIP; 483 units permitted in Waller County in 2024 (89 in 5+ unit buildings).
Forward outlook
- In year one you build about $13k of equity ($816 loan paydown + $12k appreciation (10.0% local appreciation)).
- Waller County population projected at +62% by 2050 — long-run rental-demand tailwind backs the buy-and-hold thesis.
- At projected returns (10.0% appreciation + 3.0% rent growth), your $33k cash investment doubles in ~2 years — after that, you're playing with house money.
- By year 3, paydown + projected appreciation supports a ~$32k cash-out refi (75% LTV) — recoverable capital for the next deal without selling this one.
Negotiation context
- It's been on market 108 days — a 9% lower offer ($107k) is reasonable based on typical stale-listing flexibility.
- 3 sale attempts since 17y ago with the ask held roughly flat each time — persistent listings suggest the price (not the market) is what's stuck; bring a comps-based counter.
- Current owner paid $42k; list at $118k implies a 184% gain — meaningful room to come down on a strong offer.
Risks & watch-outs
- Climate carrying-cost: severe wind risk, 99% chance of damaging wind over 30y; extreme-heat days projected 7→21/yr by 2055 (HVAC capex compounding) — expect insurance premiums to compound above CPI over the hold.
Questions for the listing agent
- It's been on market 108 days. Have you received any prior offers? Is the seller open to a 9% concession, seller financing, or rate buy-down credit?
- What does the HOA fee cover, when was the last increase, and are there any pending special assessments or reserve-fund shortfalls?
- Why hasn't it sold? Are there any deal-killer items the seller is aware of (foundation, flood, title, zoning, code violations)?
- Is there a deadline driving the sale (1031 exchange, divorce, estate, relocation)? That informs how much negotiation room exists.
- Schools are F-rated, which usually means shorter tenancies and higher turnover. Who's the typical renter profile here, and what's been the actual vacancy rate?
- Crime grade is D in this area — have there been break-ins, vandalism, or insurance claims at this property in the last 3 years? What carrier currently insures it and at what premium?
- What's the average days-on-market for RENTAL listings here right now (not sales)? A rising rental-DOM trend means longer vacancies and softer asking-rent achievability than the comps imply.
- What's the recent tenant-quality profile in this submarket — average credit score on applications, eviction rate, late-payment / NSF rate, and stable-employment percentage? A property-management company in the area should have these aggregated.
- How much new for-sale + rental construction is in the pipeline within 1–3 miles? Heavy new supply typically softens prices + rents 12–24 months out; constrained supply supports both.
Investment metrics
- 1% rule
- 1.18% ✓
- Cap rate
- 9.21%
- Cash-on-cash
- 10.43%
- DSCR
- 1.46
- GRM
- 7.1
CMA / ARV
- ARV (median comp)
- $201,503
- List price
- $118,000
- Delta
- -41.44%
- Verdict
- UNDERPRICED
- Comps
- 3 within 1.0 mi
Projected returns pro-forma
10.0% appreciation · 3.0% rent growth · sell at horizon
- IRR
- 31.9%
- Equity multiple
- 3.50×
- Total profit
- $82,579
- Equity at exit
- $106,304
- IRR
- 27.6%
- Equity multiple
- 7.93×
- Total profit
- $228,837
- Equity at exit
- $229,248
Cash invested: $33,040 (down + closing). Projections, not guarantees.
Landlord ↔ Tenant lean methodology
- Overall (STATE)
- 87 Strongly Landlord-Friendly
- State Texas
- 87 Strongly Landlord-Friendly · R+5
- County
- — inherits STATE
- City
- — inherits STATE
ZIP-level market 77445
- Home prices YoY
- 12.3%
- Active inventory
- 425
- Price-to-rent
- 7.1×
Monthly cashflow live
- Estimated rent
- $1,394 medium interval (Pro) →
- Mortgage (P&I)
- −$619
- Tax from tax record
- −$141 /mo · $1,695/yr
- Insurance
- −$49
- HOA
- −$5
- Vacancy / Maint / Mgmt
- −$293
- Net cashflow
- $287
Break-even live
Sensitivity live
| Price | -10% $354 | -5% $321 | +0% $287 | +5% $254 | +10% $220 |
|---|---|---|---|---|---|
| Rent | -10% $177 | -5% $232 | +0% $287 | +5% $342 | +10% $397 |
| Rate | -1.0pp $347 | -0.5pp $317 | base $287 | +0.5pp $257 | +1.0pp $226 |
UW: 25.0% down · 7.5% · 30yr · 1.5% tax · 5.0% vac · 8.0% maint · 8.0% mgmt
Financing live
Cash to close
- Down payment
- $29,500
- Closing costs
- $3,540
- Reserves months
- —
- Total cash needed
- —
Loan-product check · same deal, 3 products live
Conventional
25% down · 7.5% · 30yr
- Down + closing
- —
- Monthly P&I
- —
- Monthly cashflow
- —
- DSCR
- —
- Eligible?
- —
Personal DTI + credit; lowest rate.
DSCR
20% down · 8.5% · 30yr
- Down + closing
- —
- Monthly P&I
- —
- Monthly cashflow
- —
- DSCR
- —
- Eligible?
- —
No personal income docs; deal must DSCR.
Hard money
10% down · 12.0% · 12mo
- Down + closing
- —
- Monthly P&I
- —
- Monthly cashflow
- —
- DSCR
- —
- Eligible?
- —
Short-term bridge; refi at stabilization.
HOA detail
- Monthly dues
- $5 · $60/yr
- Likely covers
- security
Listing history 24 events
-
2026-06-21days on market $118,000 Active 108 DOM
-
2026-06-18days on market $118,000 Active 105 DOM
-
2026-06-17days on market $118,000 Active 104 DOM
-
2026-06-16days on market $118,000 Active 103 DOM
-
2026-06-15days on market $118,000 Active 102 DOM
-
2026-06-13days on market $118,000 Active 100 DOM
-
2026-06-09days on market $118,000 Active 96 DOM
-
2026-06-08days on market $118,000 Active 95 DOM
-
2026-06-07days on market $118,000 Active 94 DOM
-
2026-06-04days on market $118,000 Active 91 DOM
-
2026-06-03days on market $118,000 Active 90 DOM
-
2026-06-02days on market $118,000 Active 89 DOM
-
2026-06-01days on market $118,000 Active 88 DOM
-
2026-05-31days on market $118,000 Active 87 DOM
-
2026-03-05$118,000 Active 840-char remark
Show marketing remark (840 chars)
Investor Opportunity!! Welcome to a spacious and mainly cleared half acre property located in the peaceful countryside of Hempstead. The property currently features a 3-bedroom, 2-bathroom home on a half acre lot. Home needs TLC, updates and renovations, all utilities in place. Conveniently located with easy access to Highway 6 and 290, this property is close to both Hempstead and Waller, making it easy to enjoy rural living while still being within reach of modern amenities. Whether you’re looking for a primary residence, a weekend retreat, or an investment opportunity, 26573 Fawn Drive offers endless potential in a serene and picturesque setting. New homes all around in a gated country subdivision with amenities within neighborhood. Don’t miss your chance to own this wonderful piece of Texas countryside!
-
2025-11-24historical
-
2025-07-13price $118,000
-
2025-05-23price $139,000
-
2025-01-08price $149,000
-
2024-10-29$175,000 Active
-
2009-12-02soldstatus $41,500
-
2009-11-24soldstatus
-
2009-07-30historical
-
2009-01-20$49,500
ⓘ Source: listings_history table (triggers on properties + properties_extension) + one-shot
backfill from property_details.listing_events for pre-trigger history.
Tax reassessment forecast TX · Resets to sale price
- Current annual tax
- $1,695 · $141/mo
- Projected year-2 tax
- $2,159 · $180/mo
- Expected delta
- +$464/yr (+$39/mo · 27.4%)
ⓘ Screening estimate from a state-policy table — verify with the county assessor before closing.
Climate risk First Street
- Flood 1/10 Low FEMA zone X (unshaded) · 0% chance over 30 yrs
- Wildfire 4/10 Moderate
- Heat 8/10 Severe 7 d/yr ≥111°F today · 21 d/yr by 30 yrs out
- Wind 8/10 Severe 99% chance of damaging wind over 30 yrs
- Air quality 2/10 Low 1 unhealthy d/yr today · 1 by 30 yrs out
Nearby sold comps map
Loading sold comps map…
Walkable amenities ~0.75 mi
Loading nearby amenities…
Taxation est. · year 1
- Rental income
- $16,731
- − Mortgage interest
- −$6,610
- − Property taxes
- −$1,695
- − Insurance
- −$590
- − Repairs & maintenance
- −$1,338
- − Management
- −$1,338
- − HOA
- −$60
- − Depreciation
- −$3,433
- Taxable income
- $1,666
- Est. tax owed @ 24.0%
- −$400
- After-tax cash flow
- $3,047/yr
For passive investors: Depreciation is non-cash, so a rental often shows a tax loss while cash-flowing — sheltering income. Rental losses are passive: they offset passive income freely, and up to $25,000/yr can offset ordinary (W-2) income if you actively participate and your MAGI is under $100k (phasing out to $0 by $150k); unused losses carry forward. On sale, claimed depreciation is recaptured at up to 25%, and gains may owe capital-gains tax (a 1031 exchange can defer both). Figures are a year-1 estimate at your 24.0% rate — not tax advice; consult a CPA.
Schools (NCES district)
- District
- Waller ISD
- NCES district ID
- 4844430
- Math proficiency
- 30% ▼ -23.00%
- Reading proficiency
- 35% ▼ -11.00%
- Median HH income
- $58,911
- Composite
- 29.12/100
- National rank
- #6593
- State rank
- #532 of 826 in TX
Livability — Hempstead
- Score
- 60/100
- State rank
- #1099
- US rank
- #19446
Category grades
Schools grade is shown separately in the Schools card above.
Census & demographics
- City population
- 14,943
- Population (ZIP)
- 14,943
Population outlook (Waller County) Hauer SSP2
- Today (2025)
- 60,772 people
- By 2030
- 67,616 · +11.3%
- By 2040
- 82,283 · +35.4%
- By 2050
- 98,276 · +61.7%
- By 2075
- 142,860 · +135.1%
- By 2100
- 175,596 · +188.9%
Race, ethnicity, and origin ACS 2023
- Neighborhood character
- Diverse neighborhood (Simpson 0.69)
- Race & ethnicity
- Hispanic / Latino 34% White 32% Black 31% Two or more races 10% Native American 2%
- Hispanic origin (detail)
- Mexican 30% Cuban 1%
- Common ancestry
- Romanian 2% Lithuanian 2% Slovak 1%
- Foreign-born
- 13% · Canada
- Languages at home
- 74% English-only · Spanish 25%
Political lean MEDSL · Waller
- 2024 margin
- Strong R (+25.0) · D 37.0% · R 62.0% · Other 1.0%
- 2008→2024 swing
- -17.9pp toward R · 2008: -7.2pp · 2024: -25.0pp
- All cycles
- 2024: R+25.0 2020: R+26.7 2016: R+28.6 2012: R+17.6 2008: R+7.2
Not yet ingested
- Civics
- —
Market trends
- HPI YoY
- ▲ 39.43%
- Current HPI
- 359.93
- Rent YoY
- —
- Metro
- —
- State GDP YoY
- ▲ 3.95%
- F500 in state
- 110
Industry mix (Fortune 500 HQ in TX)
| Industry | F500 HQs | Revenue |
|---|---|---|
| Energy | 16 | $1,198B |
|
||
| Technology | 5 | $198B |
|
||
| Engineering / Construction | 4 | $72B |
|
||
| Energy Services | 3 | $60B |
|
||
| Utilities | 3 | $41B |
|
||
| Healthcare | 2 | $330B |
|
||
Price history
+138.4% since first listed10 events — show timeline
- 2026-03-05 Listed $118,000 HARMLS
- 2025-11-24 Listing Removed — HARMLS
- 2025-07-13 Price Changed $118,000 HARMLS
- 2025-05-23 Price Changed $139,000 HARMLS
- 2025-01-08 Price Changed $149,000 HARMLS
- 2024-10-29 Listed $175,000 HARMLS
- 2009-12-02 Sold (Public Records) $41,500 Public Records
- 2009-11-24 Sold (MLS) — HARMLS
- 2009-07-30 Listing Removed — HARMLS
- 2009-01-20 Listed $49,500 HARMLS
Property tax history
+2.7%/yrLatest (2025): $1,695 · +11.2% YoY. Source: county tax records.
Cash-flow waterfall
monthlySold comps — $/sqft
last 12 mo · ≤1 miLoading sold comps…