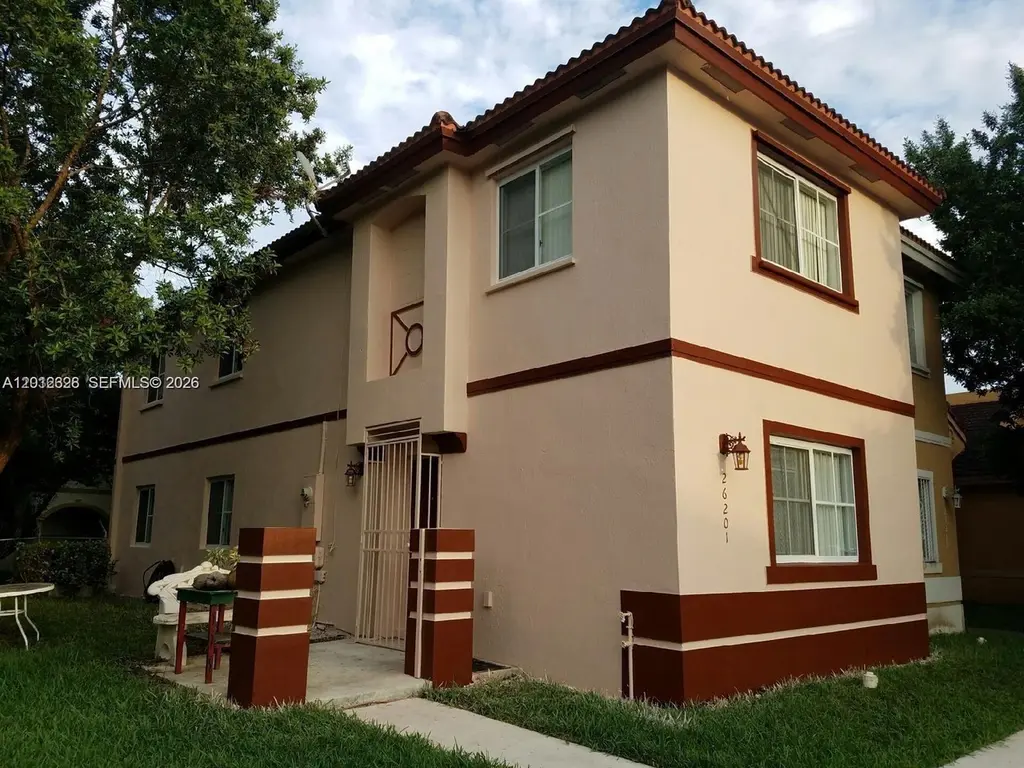
26201 SW 135th Ave · Princeton, FL
Flood risk 7/10 · Major
- FEMA flood zone
- X (unshaded)
- Chance of flooding over 30 yrs
- 0.99%
- Est. flood insurance / yr
- $507 – $1,088
Fire risk 1/10 · Minimal
- Est. fire insurance / yr
- $947 – $1,759
Heat risk 10/10 · Severe
- Hot days now (above 105°F)
- 7 days/yr
- Hot days in 30 yrs
- 30 days/yr
Wind risk 10/10 · Severe
- Chance of severe wind over 30 yrs
- 99.0%
Air-quality risk 2/10 · Minimal
- Unhealthy air days now
- 1 days/yr
- Unhealthy air days in 30 yrs
- 1 days/yr
Risk factors via First Street. Map © Google.
Why this score? — see what drove the D grade
The composite is a weighted blend of 9 inputs, each scored 0–100. Each bar is that input's sub-score; the figure is the points it added to the 100-point composite (weight × sub-score).
- Cash flow +14.1/30.0
- ARV discount +7.5/15.0
- 1% rule +4.8/10.0
- DSCR +4.3/10.0
- Schools +4.2/10.0
- Livability +3.5/5.0
- Condition / age +2.5/5.0
- Rent growth +2.3/5.0
- Appreciation +0.0/10.0
$265,000
🖨 Deal sheet (PDF) 📄 Offer letter ✓ Due diligence
Listing remarks MLS
$$ "SALE FELL THROUGH. OPPORTUNITY KNOCKS"!! $$ BANK OWNED BEAUTY $$ ALMOST SHOWS LIKE NEW AND ON CORNER LOT!! NO HOA APPROVAL NEEDED!! ALL OFFERS MUST BE ON A FAR BAR AS - IS CONTRACT AND INCLUDE A PRE QUALIFICATION LETTER OR PROOF OF FUNDS AND A COPY OF THE EMD. $$
Key facts
- Three parking spaces
- Near the turnpike
- No hoa
Tags
Property features AI
Finance
- Other: Annual tax information available
- Financial info: Pets are not allowed
- HOA & community: Association fees charged monthly
Exterior
- Parking: Two or more parking spaces
- Security: Security system; Storm/security shutters
- Utilities: Roof has energy-efficient features
- Home design: Single-story home; Resale property; Has attached property; Entry on level 1
- Construction: Block construction
- Exterior features: Fenced yard; Open porch; Porch; Storm/security shutters
Interior
- Kitchen: Dishwasher; Electric range; Disposal; Refrigerator; Eat-in kitchen; Breakfast area
- Bedrooms: Bedroom(s) on main level
- Flooring: Ceramic tile; Tile
- Bathrooms: 2 full bathrooms
- Heating & cooling: Central heating; Central air conditioning
- Interior features: Blinds on windows; Bedroom on main level; Breakfast area; Entrance foyer; Eat-in kitchen; First-floor entry; Combined living/dining area; Tub with shower; Upper-level primary
- Laundry & utility: No specific laundry details provided
Neighborhood map
What this means for you Summary
Snapshot
- This is a 2-bed/2.0-bath townhouse listed at $265k.
Deal economics
- At list price, monthly cash flow is $-27 ($-318/yr) — negative.
- To cash-flow at today's rent, offer at most $260k (1.8% below list).
- To meet the 1% rule (rent ≥ 1% of price), the offer needs to be $260k (1.7% below list).
- Recommended offer: $260k (1.8% below list) — sets the bar for cash-flow.
- Cap rate 6.5% vs local median 3.1% in Princeton — top-decile yield for the area; either an underpriced asset or a hidden risk that comps aren't pricing in. Stress-test before assuming the spread holds.
Location & tenants
- Location reads 69/100 on livability (#468 in FL) — a middle-class / working-renter tenant base. Strengths: housing A+, crime B+, health & safety B+; Watch: amenities F.
- Miami-Dade (suburban): math 45% / reading 54% proficiency, ranked #40 of 73 in FL (top 55%) — families likely to look elsewhere, expect single-tenant / working-renter base with shorter leases; 64% free/reduced lunch — lower-income household profile, screen leases tightly.
- Zoned schools: Coconut Palm K-8 Academy (math 27% / reading 31%, grade F, #1,932 of 2,144 statewide, top 91%, 1,210 students, 74% FRL); Redland Middle School (math 21% / reading 30%, grade F, #512 of 571 statewide, top 90%, 601 students, 71% FRL); South Dade Senior High School (math 23% / reading 32%, grade F, #470 of 667 statewide, top 71%, 3,145 students, 73% FRL).
- Zoned-school proficiency averages 27% at this address vs 50% district-wide (-22 pts) — the specific schools serving this property underperform the Miami-Dade average; the district grade overstates school quality for this exact location.
- Market conditions: Rents soft (-1.0%/yr); 590 active listings in the ZIP; 40 comparable units currently listed for rent nearby; rentals at typical pace (median 26d on market — plan ~3-4 weeks tenant-placement turnaround); 10,051 units permitted in Miami-Dade County in 2024 (7,758 in 5+ unit buildings).
Forward outlook
- Local home prices are declining (-3.0%/yr); year-one equity from $2k of loan paydown is wiped out by about $8k of value loss. Plan a longer hold.
- Miami-Dade County population projected at +28% by 2050 — long-run rental-demand tailwind backs the buy-and-hold thesis.
Negotiation context
- Only 11 days on market — expect competitive offers; lowballing is unlikely to land.
- 2 sale attempts with the ask held roughly flat each time — persistent listings suggest the price (not the market) is what's stuck; bring a comps-based counter.
- Current owner paid $45k; list at $265k implies a 489% gain — meaningful room to come down on a strong offer.
Risks & watch-outs
- Watch-outs: flood insurance adds $66/mo.
- Climate carrying-cost: major flood risk; severe wind risk, 99% chance of damaging wind over 30y; extreme-heat days projected 7→30/yr by 2055 (HVAC capex compounding) — expect insurance premiums to compound above CPI over the hold.
Questions for the listing agent
- What do current leases actually rent for vs. the listed asking? Can we see a recent rent roll and the last 12 months of T-12 income?
- What's the actual annual flood-insurance premium (NFIP or private), and is the property in a SFHA with mandatory coverage?
- Is there a deadline driving the sale (1031 exchange, divorce, estate, relocation)? That informs how much negotiation room exists.
- Schools are D-rated, which usually means shorter tenancies and higher turnover. Who's the typical renter profile here, and what's been the actual vacancy rate?
- The area grade is low — what's the realistic commute time and amenity access for the typical tenant pool here? Any planned neighborhood developments (good or bad) we should know about?
- What's the average days-on-market for RENTAL listings here right now (not sales)? A rising rental-DOM trend means longer vacancies and softer asking-rent achievability than the comps imply.
- What's the recent tenant-quality profile in this submarket — average credit score on applications, eviction rate, late-payment / NSF rate, and stable-employment percentage? A property-management company in the area should have these aggregated.
- How much new for-sale + rental construction is in the pipeline within 1–3 miles? Heavy new supply typically softens prices + rents 12–24 months out; constrained supply supports both.
Investment metrics
- 1% rule
- 0.98% ✗
- Cap rate
- 6.47%
- Cash-on-cash
- 0.65%
- DSCR
- 1.03
- GRM
- 8.5
CMA / ARV
No comps found within radius.
Projected returns pro-forma
-3.0% appreciation · 0.0% rent growth · sell at horizon
- IRR
- -20.8%
- Equity multiple
- 0.30×
- Total profit
- $-52,066
- Equity at exit
- $39,512
- IRR
- -24.7%
- Equity multiple
- -0.03×
- Total profit
- $-76,211
- Equity at exit
- $22,912
Cash invested: $74,200 (down + closing). Projections, not guarantees.
Landlord ↔ Tenant lean methodology
- Overall (STATE)
- 87 Strongly Landlord-Friendly
- State Florida
- 87 Strongly Landlord-Friendly · R+3
- County
- — inherits STATE
- City
- — inherits STATE
ZIP-level market 33032
- Home prices YoY
- -29.8%
- Rents YoY
- -1.0%
- Active inventory
- 590
- Price-to-rent
- 8.5×
Monthly cashflow live
- Estimated rent
- $2,604 high interval (Pro) →
- Mortgage (P&I)
- −$1,390
- Tax from tax record
- −$517 /mo · $6,203/yr
- Insurance
- −$110
- Flood insurance flood zone
- −$66 /mo · $798/yr
- HOA
- −$0
- Vacancy / Maint / Mgmt
- −$547
- Net cashflow
- $-27
Break-even live
Sensitivity live
| Price | -10% $124 | -5% $49 | +0% $-27 | +5% $-102 | +10% $-177 |
|---|---|---|---|---|---|
| Rent | -10% $-232 | -5% $-129 | +0% $-27 | +5% $76 | +10% $179 |
| Rate | -1.0pp $107 | -0.5pp $41 | base $-27 | +0.5pp $-95 | +1.0pp $-165 |
UW: 25.0% down · 7.5% · 30yr · 1.5% tax · 5.0% vac · 8.0% maint · 8.0% mgmt
Financing live
Cash to close
- Down payment
- $66,250
- Closing costs
- $7,950
- Reserves months
- —
- Total cash needed
- —
Loan-product check · same deal, 3 products live
Conventional
25% down · 7.5% · 30yr
- Down + closing
- —
- Monthly P&I
- —
- Monthly cashflow
- —
- DSCR
- —
- Eligible?
- —
Personal DTI + credit; lowest rate.
DSCR
20% down · 8.5% · 30yr
- Down + closing
- —
- Monthly P&I
- —
- Monthly cashflow
- —
- DSCR
- —
- Eligible?
- —
No personal income docs; deal must DSCR.
Hard money
10% down · 12.0% · 12mo
- Down + closing
- —
- Monthly P&I
- —
- Monthly cashflow
- —
- DSCR
- —
- Eligible?
- —
Short-term bridge; refi at stabilization.
Rent comps 40 comps
| Address | Beds | Baths | Sqft | Rent | $/sqft | DOM | Units | Dist |
|---|---|---|---|---|---|---|---|---|
| 13414 SW 263rd St Unit 13414 Homestead, FL | 3.0 | 2.5 | 1458 | $2,700 | $1.85 | 26d | 1 | 0.06mi |
| 26205 SW 133rd Ct Homestead, FL | 3.0 | 2.0 | 1602 | $3,200 | $2.00 | 26d | 1 | 0.21mi |
| 13351 SW 258th Ter Homestead, FL | 1.0 | 1.0 | 1785 | $1,000 | $0.56 | 26d | 1 | 0.33mi |
| 25948 SW 132nd Ave Unit 1 Homestead, FL | 1.0 | 1.0 | 1456 | $1,450 | $1.00 | 26d | 1 | 0.38mi |
| 26633 SW 138th Ct #1 Homestead, FL | 3.0 | 1.0 | 1311 | $2,250 | $1.72 | 26d | 1 | 0.43mi |
| 13065 SW 263rd Ter #2 Homestead, FL | 1.0 | 1.0 | 1334 | $1,500 | $1.12 | 26d | 1 | 0.45mi |
| 13710 SW 256th St Naranja, FL | 1.0–3.0 | 1.0–2.0 | 854 | $1,966 | $2.30 | 5d | 10 | 0.46mi |
| 25869 SW 139th Ct Homestead, FL | 3.0 | 2.5 | 1266 | $2,650 | $2.09 | 26d | 1 | 0.49mi |
| 13958 SW 260th St #101 Homestead, FL | 2.0 | 2.5 | 1212 | $1,850 | $1.53 | 12d | 1 | 0.51mi |
| 13958 SW 260th St #101 Homestead, FL | 2.0 | 2.5 | 1212 | $1,850 | $1.53 | 24d | 1 | 0.51mi |
| 13471 SW 271st Ln Homestead, FL | 3.0 | 2.0 | 1194 | $2,350 | $1.97 | 17d | 1 | 0.56mi |
| 27160 SW 132nd Court Rd Homestead, FL | 3.0 | 2.0 | 1977 | $3,300 | $1.67 | 26d | 1 | 0.59mi |
| 25850 SW 140th Ct Homestead, FL | 2.0 | 2.0 | 1175 | $2,556 | $2.18 | 3d | 1 | 0.59mi |
| 25850 SW 140th Ct Homestead, FL | 1.0–3.0 | 1.0–2.0 | 1079 | $2,701 | $2.50 | 4d | 38 | 0.59mi |
| 13000 SW 260th Ter Unit 10 Homestead, FL | 1.0 | 1.0 | 1938 | $1,050 | $0.54 | 20d | 1 | 0.60mi |
| 14130 SW 260th St #103 Homestead, FL | 3.0 | 2.5 | 1657 | $2,200 | $1.33 | 24d | 1 | 0.61mi |
| 13063 SW 256th St Homestead, FL | 3.0 | 2.0 | 1527 | $3,600 | $2.36 | 26d | 1 | 0.61mi |
| 13233 SW 272nd St Homestead, FL | 3.0 | 2.0 | 2130 | $3,500 | $1.64 | 22d | 1 | 0.64mi |
| 13233 SW 272nd St Homestead, FL | 3.0 | 2.0 | 2130 | $3,500 | $1.64 | 26d | 1 | 0.64mi |
| 26508 SW 128th Ct Homestead, FL | 3.0 | 2.0 | 1363 | $2,800 | $2.05 | 12d | 1 | 0.65mi |
| 26508 SW 128th Ct Homestead, FL | 3.0 | 2.0 | 1363 | $2,800 | $2.05 | 7d | 1 | 0.65mi |
| 25885 S Dixie Hwy Homestead, FL | 3.0 | 2.0 | 1307 | $2,535 | $1.94 | 26d | 1 | 0.66mi |
| 13720 SW 272nd St Homestead, FL | 1.0–3.0 | 1.0–2.0 | 988 | $1,949 | $1.97 | 0d | 52 | 0.66mi |
| 14142 SW 260th St #105 Homestead, FL | 3.0 | 2.5 | 1657 | $2,200 | $1.33 | 26d | 1 | 0.67mi |
| 14170 SW 260th St #103 Homestead, FL | 3.0 | 2.5 | 1657 | $2,200 | $1.33 | 26d | 1 | 0.68mi |
| 25236 SW 133rd Ave Homestead, FL | 1.0 | 1.0 | 1545 | $1,000 | $0.65 | 7d | 1 | 0.69mi |
| 13381 SW 251st Ter Unit 201 Homestead, FL | 2.0 | 2.0 | 1327 | $1,950 | $1.47 | 26d | 1 | 0.73mi |
| 27440 SW 135th Avenue Rd Unit 27440 Naranja, FL | 3.0 | 3.0 | 1799 | $3,300 | $1.83 | 26d | 1 | 0.74mi |
| 27310 SW 138th Ct #27310 Homestead, FL | 3.0 | 2.0 | 1235 | $2,250 | $1.82 | 24d | 1 | 0.75mi |
| 13840 SW 273rd Ter Homestead, FL | 3.0 | 2.0 | 1235 | $2,350 | $1.90 | 24d | 1 | 0.79mi |
| 27433 SW 137th Ct Unit 1 Homestead, FL | 3.0 | 2.5 | 1679 | $2,550 | $1.52 | 26d | 1 | 0.79mi |
| 27433 SW 137th Ct Unit 1 Homestead, FL | 3.0 | 2.5 | 1679 | $2,550 | $1.52 | 9d | 1 | 0.79mi |
| 25760 SW 127th Pl Homestead, FL | 3.0 | 2.0 | 1221 | $3,700 | $3.03 | 26d | 1 | 0.79mi |
| 12787 SW 257th St Unit 12787 Homestead, FL | 3.0 | 2.0 | 1221 | $3,000 | $2.46 | 26d | 1 | 0.81mi |
| 13344 Tropical Ave Princeton, FL | 3.0 | 2.5 | 1463 | $3,000 | $2.05 | 26d | 1 | 0.81mi |
| 13344 Tropical Ave Princeton, FL | 3.0 | 2.5 | 1463 | $2,650 | $1.81 | 4d | 1 | 0.81mi |
| 14050 SW 272nd St Homestead, FL | 3.0 | 2.5 | 1580 | $2,450 | $1.55 | 26d | 1 | 0.86mi |
| 13203 SW 276th Ter Homestead, FL | 3.0 | 2.0 | 1288 | $2,410 | $1.87 | 24d | 1 | 0.90mi |
| 27721 SW 134th Ct Homestead, FL | 3.0 | 2.0 | 1685 | $3,600 | $2.14 | 24d | 1 | 0.91mi |
| 25011 SW 130th Ave Princeton, FL | 1.0–3.0 | 1.0–2.0 | 950 | $2,107 | $2.22 | 0d | 9 | 0.92mi |
Listing history 8 events
-
2026-05-15status Pending
-
2026-05-04$265,000 Active
-
2026-05-04historical
-
2026-03-04price $350,000
-
2026-01-22price $379,000
-
2025-12-30$398,000 Active
-
2010-04-06soldstatus $45,000 278-char remark
Show marketing remark (278 chars)
$$ "SALE FELL THROUGH. OPPORTUNITY KNOCKS"!! $$ BANK OWNED BEAUTY $$ ALMOST SHOWS LIKE NEW AND ON CORNER LOT!! NO HOA APPROVAL NEEDED!! ALL OFFERS MUST BE ON A FAR BAR AS - IS CONTRACT AND INCLUDE A PRE QUALIFICATION LETTER OR PROOF OF FUNDS AND A COPY OF THE EMD. $$
-
2003-07-31soldstatus $3,762,000
ⓘ Source: listings_history table (triggers on properties + properties_extension) + one-shot
backfill from property_details.listing_events for pre-trigger history.
Tax reassessment forecast FL · Resets to sale price
- Current annual tax
- $6,203 · $517/mo
- Projected year-2 tax
- $6,203 · $517/mo
- Expected delta
- $0/yr ($0/mo · 0.0%)
ⓘ Screening estimate from a state-policy table — verify with the county assessor before closing.
Climate risk First Street
- Flood 7/10 Severe FEMA zone X (unshaded) · 99% chance over 30 yrs
- Wildfire 1/10 Low
- Heat 10/10 Extreme 7 d/yr ≥105°F today · 30 d/yr by 30 yrs out
- Wind 10/10 Extreme 99% chance of damaging wind over 30 yrs
- Air quality 2/10 Low 1 unhealthy d/yr today · 1 by 30 yrs out
Nearby sold comps map
Loading sold comps map…
Walkable amenities ~0.75 mi
Loading nearby amenities…
Taxation est. · year 1
- Rental income
- $31,245
- − Mortgage interest
- −$14,844
- − Property taxes
- −$6,203
- − Insurance
- −$2,122
- − Repairs & maintenance
- −$2,500
- − Management
- −$2,500
- − Depreciation
- −$7,709
- Taxable loss
- −$4,633
- Est. tax savings @ 24.0%
- +$1,112
- After-tax cash flow
- $794/yr
For passive investors: Depreciation is non-cash, so a rental often shows a tax loss while cash-flowing — sheltering income. Rental losses are passive: they offset passive income freely, and up to $25,000/yr can offset ordinary (W-2) income if you actively participate and your MAGI is under $100k (phasing out to $0 by $150k); unused losses carry forward. On sale, claimed depreciation is recaptured at up to 25%, and gains may owe capital-gains tax (a 1031 exchange can defer both). Figures are a year-1 estimate at your 24.0% rate — not tax advice; consult a CPA.
Schools (NCES district)
- District
- Miami-Dade
- NCES district ID
- 1200390
- Math proficiency
- 45% ▼ -16.00%
- Reading proficiency
- 54% ▼ -5.00%
- Median HH income
- $43,928
- Composite
- 41.76/100
- National rank
- #3397
- State rank
- #40 of 73 in FL
Livability — Princeton
- Score
- 69/100
- State rank
- #468
- US rank
- #8462
Category grades
Schools grade is shown separately in the Schools card above.
Census & demographics
- Census place
- Princeton, FL
- County
- Miami-Dade County · 2,697,751 people
- City population
- 62,021
- Metro
- Miami-Fort Lauderdale-Pompano Beach, FL
- Population (ZIP)
- 65,132
- Household income
- $73,429
- Rent vs Own
- Severe rent burden
- 3351.0
Population outlook (Miami-Dade County) Hauer SSP2
- Today (2025)
- 3,126,439 people
- By 2030
- 3,325,765 · +6.4%
- By 2040
- 3,697,561 · +18.3%
- By 2050
- 4,012,134 · +28.3%
- By 2075
- 4,605,612 · +47.3%
- By 2100
- 4,866,598 · +55.7%
Race, ethnicity, and origin ACS 2023
- Neighborhood character
- Predominantly Hispanic (68%)
- Race & ethnicity
- Hispanic / Latino 68% Two or more races 35% Black 20% White 10%
- Hispanic origin (detail)
- Mexican 3% Puerto Rican 5% Cuban 31% Dominican 5%
- Common ancestry
- Hispanic 3%
- Foreign-born
- 45% · Canada, Jamaica, Dominican Republic
- Languages at home
- 33% English-only · Spanish 64% French/Haitian/Cajun 2%
Political lean MEDSL · Miami-Dade
- 2024 margin
- R (+11.4) · D 43.9% · R 55.4%
- 2008→2024 swing
- -27.6pp toward R · 2008: 16.1pp · 2024: -11.4pp
- All cycles
- 2024: R+11.4 2020: D+7.3 2016: D+29.6 2012: D+23.7 2008: D+16.1
Not yet ingested
- Civics
- —
Market trends
- HPI YoY
- ▼ -176.52%
- Current HPI
- 415.9508
- Rent YoY
- ▼ -0.99%
- Metro
- Miami-Fort Lauderdale-Pompano Beach, FL
- State GDP YoY
- ▲ 3.28%
- F500 in state
- 36
Industry mix (Fortune 500 HQ in FL)
| Industry | F500 HQs | Revenue |
|---|---|---|
| Industrial Technology | 2 | $29B |
|
||
| Insurance | 2 | $17B |
|
||
| Retail | 1 | $60B |
|
||
| Technology Distribution | 1 | $58B |
|
||
| Homebuilding | 1 | $35B |
|
||
| Technology Manufacturing | 1 | $35B |
|
||
Price history
-93.0% since first listed8 events — show timeline
- 2026-05-15 Pending — MARMLS
- 2026-05-04 Listing Removed — MARMLS
- 2026-05-04 Listed $265,000 MARMLS
- 2026-03-04 Price Changed $350,000 MARMLS
- 2026-01-22 Price Changed $379,000 MARMLS
- 2025-12-30 Listed $398,000 MARMLS
- 2010-04-06 Sold (MLS) $45,000 MARMLS
- 2003-07-31 Sold (Public Records) $3,762,000 Public Records
Property tax history
+11.2%/yrLatest (2025): $6,203 · +7.3% YoY. Source: county tax records.
Cash-flow waterfall
monthlySold comps — $/sqft
last 12 mo · ≤1 miLoading sold comps…