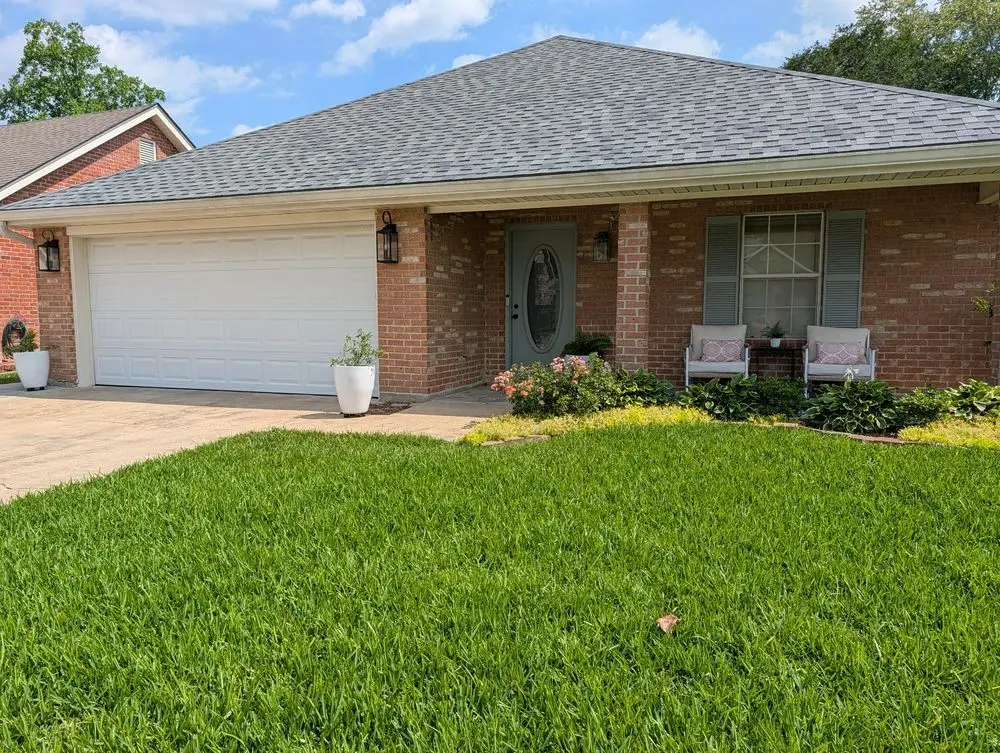
212 Cricklade Ct · Youngsville, LA
Flood risk 5/10 · Moderate
- FEMA flood zone
- X (unshaded)
- Chance of flooding over 30 yrs
- 0.48%
- Est. flood insurance / yr
- $507 – $1,088
Fire risk 1/10 · Minimal
- Est. fire insurance / yr
- $1,269 – $2,357
Heat risk 9/10 · Severe
- Hot days now (above 108°F)
- 7 days/yr
- Hot days in 30 yrs
- 22 days/yr
Wind risk 9/10 · Severe
- Chance of severe wind over 30 yrs
- 99.0%
Air-quality risk 1/10 · Minimal
- Unhealthy air days now
- 0 days/yr
- Unhealthy air days in 30 yrs
- 0 days/yr
Risk factors via First Street. Map © Google.
Why this score? — see what drove the C- grade
The composite is a weighted blend of 9 inputs, each scored 0–100. Each bar is that input's sub-score; the figure is the points it added to the 100-point composite (weight × sub-score).
- Cash flow +19.1/30.0
- ARV discount +9.3/15.0
- DSCR +6.0/10.0
- 1% rule +4.3/10.0
- Livability +3.9/5.0
- Schools +3.6/10.0
- Rent growth +2.9/5.0
- Condition / age +2.5/5.0
- Appreciation +0.0/10.0
$217,000
🖨 Deal sheet 📄 Offer letter ✓ Due diligence
Listing remarks
Wonderful 3-bedroom, 2-bath home in the desirable Copperfield Subdivision. Highlights include: Spacious living room with cathedral ceilings and a wood-burning fireplace Updated kitchen with quartzite countertops, freshly painted cabinets, updated lighting, and stainless steel appliances Expansive primary suite with updated bath featuring a new dolomite marble-top double vanity, chair-height toilets, and a beautifully tiled tub/shower combo Freshly painted and impeccably maintained throughout Durable 22mm commercial-grade waterproof LVP flooring throughout, with marble tile in both bathrooms New roof in 2021 AC replaced in 2016 Fully fenced backyard with covered patio, perfect for y
Key facts
- Double vanity
- Updated bath
- Marble tile
Tags
Property features AI
Exterior
- Home design: House
- Construction: Living area approximately 1,459 sq ft
- Exterior features: Lot of approximately 6,300 sq ft
Neighborhood map
What this means for you Summary
Snapshot
- This is a 3-bed/2.0-bath single-family listed at $217k.
Deal economics
- At list price, monthly cash flow is $232 ($3k/yr) — positive.
- The deal already cash-flows at list — no discount required.
- To meet the 1% rule (rent ≥ 1% of price), the offer needs to be $203k (6.5% below list).
- Recommended offer: $203k (6.5% below list) — sets the bar for 1% rule.
- Cap rate 7.6% vs local median 4.8% in Youngsville — top-decile yield for the area; either an underpriced asset or a hidden risk that comps aren't pricing in. Stress-test before assuming the spread holds.
Location & tenants
- Location reads 78/100 on livability (#8 in LA, #2,614 nationally) — a middle-class / working-renter tenant base. Strengths: schools A+, employment A+, housing A+; Watch: amenities F, commute F.
- Lafayette Parish (urban): math 38% / reading 46% proficiency, ranked #19 of 98 in LA (top 19%) — families likely to look elsewhere, expect single-tenant / working-renter base with shorter leases.
- Market conditions: Rents rising (+1.6%/yr); 675 active listings in the ZIP; 20 comparable units currently listed for rent nearby; rentals lingering (median 44d on market — plan ~5-8 weeks vacancy on turnover, expect pricing pressure); 65% of comp listings sitting > 30 days — soft ceiling on asking rent; solid renter incomes; 1,585 units permitted in Lafayette Parish in 2024 (10 in 5+ unit buildings).
Forward outlook
- Local home prices are declining (-3.0%/yr); year-one equity from $2k of loan paydown is wiped out by about $7k of value loss. Plan a longer hold.
- Lafayette County population projected at +34% by 2050 — long-run rental-demand tailwind backs the buy-and-hold thesis.
Negotiation context
- Only 14 days on market — expect competitive offers; lowballing is unlikely to land.
Risks & watch-outs
- Climate carrying-cost: moderate flood risk; severe wind risk, 99% chance of damaging wind over 30y; extreme-heat days projected 7→22/yr by 2055 (HVAC capex compounding) — expect insurance premiums to compound above CPI over the hold.
Questions for the listing agent
- Is there a deadline driving the sale (1031 exchange, divorce, estate, relocation)? That informs how much negotiation room exists.
- Schools are A-rated — typically a magnet for longer-tenancy family renters. What's the average tenant stay here, and is there a school-zone premium baked into asking?
- What's the average days-on-market for RENTAL listings here right now (not sales)? A rising rental-DOM trend means longer vacancies and softer asking-rent achievability than the comps imply.
- What's the recent tenant-quality profile in this submarket — average credit score on applications, eviction rate, late-payment / NSF rate, and stable-employment percentage? A property-management company in the area should have these aggregated.
- How much new for-sale + rental construction is in the pipeline within 1–3 miles? Heavy new supply typically softens prices + rents 12–24 months out; constrained supply supports both.
Investment metrics
- 1% rule
- 0.93% ✗
- Cap rate
- 7.57%
- Cash-on-cash
- 4.58%
- DSCR
- 1.20
- GRM
- 8.9
CMA / ARV
- ARV (on-the-fly)
- $226,300
- Comps found
- 12
Show comp detail 12 sales within ~0.75 mi
| Address | Dist | Beds/Ba | Sqft | Sold | Price | $/sf | Match |
|---|---|---|---|---|---|---|---|
| 104 Queensford Way | 0.08mi | 3/2.0 | 1,493 (+2%) | 1mo | $228,900 | $153 | 92 |
| 208 N Rushmore Ln | 0.07mi | 3/2.0 | 1,400 (-4%) | 0mo | $216,000 | $154 | 90 |
| 106 Queensford Way | 0.07mi | 3/2.0 | 1,660 (+14%) | 1mo | $236,000 | $142 | 73 |
| 103 Cricklade Ct | 0.13mi | 3/2.0 | 1,665 (+14%) | 2mo | $218,000 | $131 | 69 |
| 106 Doncaster Cir | 0.06mi | 3/2.0 | 1,672 (+14%) | 6mo | $251,500 | $150 | 68 |
| 406 Quiet Meadows Dr | 0.57mi | 3/2.0 | 1,486 (+2%) | 4mo | $234,000 | $157 | 67 |
| 803 Copper Meadow Blvd | 0.66mi | 3/2.0 | 1,470 (+1%) | 4mo | $245,000 | $167 | 65 |
| 725 Copper Meadows Blvd | 0.63mi | 3/2.0 | 1,514 (+4%) | 1mo | $235,000 | $155 | 63 |
| 300 Quiet Meadows Dr | 0.62mi | 3/2.0 | 1,390 (-5%) | 2mo | $220,000 | $158 | 62 |
| 122 Bluegrass Creek Rd | 0.49mi | 3/2.0 | 1,642 (+12%) | 3mo | $250,000 | $152 | 54 |
| 312 Quiet Meadows Cir | 0.62mi | 3/2.0 | 1,580 (+8%) | 4mo | $245,000 | $155 | 54 |
| 718 Copper Meadow Blvd | 0.66mi | 3/2.0 | 1,333 (-9%) | 9mo | $220,000 | $165 | 47 |
Match score weights: distance 35% · size 25% · config 20% · recency 20%. Top-matched comps best support the ARV.
Projected returns pro-forma
-3.0% appreciation · 1.65% rent growth · sell at horizon
- IRR
- -10.6%
- Equity multiple
- 0.62×
- Total profit
- $-23,176
- Equity at exit
- $32,355
- IRR
- -3.2%
- Equity multiple
- 0.80×
- Total profit
- $-12,238
- Equity at exit
- $18,762
Cash invested: $60,760 (down + closing). Projections, not guarantees.
Landlord ↔ Tenant lean methodology
- Overall (STATE)
- 90 Strongly Landlord-Friendly
- State Louisiana
- 90 Strongly Landlord-Friendly · R+12
- County
- — inherits STATE
- City
- — inherits STATE
ZIP-level market 70592
- Home prices YoY
- -23.4%
- Rents YoY
- 1.6%
- Active inventory
- 675
- Price-to-rent
- 8.9×
Monthly cashflow live
- Estimated rent
- $2,029 high interval (Pro) →
- Mortgage (P&I)
- −$1,138
- Tax from tax record
- −$143 /mo · $1,712/yr
- Insurance
- −$90
- HOA
- −$0
- Vacancy / Maint / Mgmt
- −$426
- Net cashflow
- $232
Break-even live
UW: 25.0% down · 7.5% · 30yr · 1.5% tax · 5.0% vac · 8.0% maint · 8.0% mgmt
Financing live
Cash to close
- Down payment
- $54,250
- Closing costs
- $6,510
- Reserves months
- —
- Total cash needed
- —
Loan-product check · same deal, 3 products live
Conventional
25% down · 7.5% · 30yr
- Down + closing
- —
- Monthly P&I
- —
- Monthly cashflow
- —
- DSCR
- —
- Eligible?
- —
Personal DTI + credit; lowest rate.
DSCR
20% down · 8.5% · 30yr
- Down + closing
- —
- Monthly P&I
- —
- Monthly cashflow
- —
- DSCR
- —
- Eligible?
- —
No personal income docs; deal must DSCR.
Hard money
10% down · 12.0% · 12mo
- Down + closing
- —
- Monthly P&I
- —
- Monthly cashflow
- —
- DSCR
- —
- Eligible?
- —
Short-term bridge; refi at stabilization.
Rent comps 20 comps
| Address | Beds | Baths | Sqft | Rent | $/sqft | DOM | Units | Dist |
|---|---|---|---|---|---|---|---|---|
| 405 Claystone Rd Youngsville, LA | 3.0 | 2.0 | 1740 | $1,850 | $1.06 | 43d | 1 | 0.46mi |
| 204 Romero St Unit C Youngsville, LA | 2.0 | 2.5 | 1202 | $1,650 | $1.37 | 13d | 1 | 0.77mi |
| 407 Copper Ridge Dr Youngsville, LA | 3.0 | 2.0 | 1564 | $2,100 | $1.34 | 43d | 1 | 0.77mi |
| 139 Iberia St Unit I Youngsville, LA | 3.0 | 3.0 | 1645 | $1,900 | $1.16 | 43d | 1 | 0.88mi |
| 205 Jacques St Youngsville, LA | 2.0 | 1.0 | 1100 | $995 | $0.90 | 21d | 1 | 0.92mi |
| 118 Gadwall DR Youngsville, LA | 2.0 | 2.5 | 1334 | $1,700 | $1.27 | 43d | 1 | 0.94mi |
| 204 Benson GRV Youngsville, LA | 4.0 | 2.0 | 1700 | $2,500 | $1.47 | 43d | 1 | 0.94mi |
| 104 Field Pt Youngsville, LA | 4.0 | 2.0 | 1700 | $2,500 | $1.47 | 43d | 1 | 0.94mi |
| 102 Canvasback DR Youngsville, LA | 2.0 | 2.5 | 1305 | $1,900 | $1.46 | 43d | 1 | 0.94mi |
| 120 Mayberry Grove ST Youngsville, LA | 2.0 | 2.5 | 1500 | $1,725 | $1.15 | 43d | 1 | 0.94mi |
| 101 Seneca Cir Youngsville, LA | 3.0 | 2.0 | 1640 | $1,900 | $1.16 | 21d | 1 | 0.99mi |
| 210 Revere Dr Youngsville, LA | 3.0 | 2.0 | 1690 | $2,500 | $1.48 | 43d | 1 | 1.04mi |
| 110 Fourth St Youngsville, LA | 3.0 | 2.5 | 1700 | $1,800 | $1.06 | 43d | 1 | 1.11mi |
| 136 Kirkwood Ln Youngsville, LA | 3.0 | 2.0 | 1600 | $1,500 | $0.94 | 13d | 1 | 1.16mi |
| 115 Gaunt Ln Unit 204 Youngsville, LA | 2.0 | 2.5 | 1575 | $2,095 | $1.33 | 13d | 1 | 1.19mi |
| 201 Prescott Blvd Youngsville, LA | 1.0–2.0 | 1.0–2.0 | 829 | $1,956 | $2.36 | 13d | 14 | 1.21mi |
| 117 Harvey Cay Ln Youngsville, LA | 3.0 | 2.0 | 1499 | $1,950 | $1.30 | 43d | 1 | 1.25mi |
| 805 Broyles St Unit 102 Youngsville, LA | 3.0 | 2.5 | 1600 | $2,495 | $1.56 | 43d | 1 | 1.25mi |
| 118 Village Green Dr Youngsville, LA | 3.0 | 2.0 | 1410 | $1,800 | $1.28 | 13d | 1 | 1.29mi |
| 510 Annaberg Dr Youngsville, LA | 3.0 | 2.0 | 1825 | $2,550 | $1.40 | 43d | 1 | 1.35mi |
Listing history 12 events
-
2026-06-18days on market $217,000 Active 14 DOM
-
2026-06-17days on market $217,000 Active 13 DOM
-
2026-06-16pricedays on market $217,000 Active 12 DOM
-
2026-06-15days on market $225,000 Active 11 DOM
-
2026-06-14days on market $225,000 Active 9 DOM
-
2026-06-13days on market $225,000 Active 8 DOM
-
2026-06-10days on market $225,000 Active 6 DOM
-
2026-06-09days on market $225,000 Active 5 DOM
-
2026-06-08days on market $225,000 Active 4 DOM
-
2026-06-07days on market $225,000 Active 3 DOM
-
2026-06-05remarks 699-char remark
-
2026-06-05$225,000 Active 1 DOM
ⓘ Source: listings_history table (triggers on properties + properties_extension) + one-shot
backfill from property_details.listing_events for pre-trigger history.
Tax reassessment forecast LA · Resets to sale price
- Current annual tax
- $1,712 · $143/mo
- Projected year-2 tax
- $1,712 · $143/mo
- Expected delta
- $0/yr ($0/mo · 0.0%)
ⓘ Screening estimate from a state-policy table — verify with the county assessor before closing.
Climate risk First Street
- Flood 5/10 Major FEMA zone X (unshaded) · 48% chance over 30 yrs
- Wildfire 1/10 Low
- Heat 9/10 Extreme 7 d/yr ≥108°F today · 22 d/yr by 30 yrs out
- Wind 9/10 Extreme 99% chance of damaging wind over 30 yrs
- Air quality 1/10 Low 0 unhealthy d/yr today · 0 by 30 yrs out
Nearby sold comps map
Loading sold comps map…
Walkable amenities ~0.75 mi
Loading nearby amenities…
Taxation est. · year 1
- Rental income
- $24,345
- − Mortgage interest
- −$12,155
- − Property taxes
- −$1,712
- − Insurance
- −$1,085
- − Repairs & maintenance
- −$1,948
- − Management
- −$1,948
- − Depreciation
- −$6,313
- Taxable loss
- −$815
- Est. tax savings @ 24.0%
- +$196
- After-tax cash flow
- $2,976/yr
For passive investors: Depreciation is non-cash, so a rental often shows a tax loss while cash-flowing — sheltering income. Rental losses are passive: they offset passive income freely, and up to $25,000/yr can offset ordinary (W-2) income if you actively participate and your MAGI is under $100k (phasing out to $0 by $150k); unused losses carry forward. On sale, claimed depreciation is recaptured at up to 25%, and gains may owe capital-gains tax (a 1031 exchange can defer both). Figures are a year-1 estimate at your 24.0% rate — not tax advice; consult a CPA.
Schools (NCES district)
- District
- Lafayette Parish
- NCES district ID
- 2200870
- Math proficiency
- 38% ▼ -32.00%
- Reading proficiency
- 46% ▼ -24.00%
- Median HH income
- $50,238
- Composite
- 36.15/100
- National rank
- #4741
- State rank
- #19 of 98 in LA
Livability — Youngsville
- Score
- 78/100
- State rank
- #8
- US rank
- #2614
Category grades
Schools grade is shown separately in the Schools card above.
Census & demographics
- Census place
- Youngsville, LA
- County
- Lafayette Parish · 207,544 people
- City population
- 32,167
- Metro
- Lafayette, LA
- Population (ZIP)
- 32,167
- Household income
- $93,204
- Rent vs Own
- Severe rent burden
- 424.0
Population outlook (Lafayette County) Hauer SSP2
- Today (2025)
- 280,930 people
- By 2030
- 301,092 · +7.2%
- By 2040
- 339,456 · +20.8%
- By 2050
- 375,156 · +33.5%
- By 2075
- 451,672 · +60.8%
- By 2100
- 497,203 · +77.0%
Race, ethnicity, and origin ACS 2023
- Neighborhood character
- Predominantly White (82%)
- Race & ethnicity
- White 82% Black 10% Two or more races 5% Hispanic / Latino 4% Asian 1%
- Common ancestry
- Lithuanian 24% Romanian 3% Italian 1%
- Foreign-born
- 3% · Canada
- Languages at home
- 94% English-only · French/Haitian/Cajun 3% Spanish 2%
Political lean MEDSL · Lafayette
- 2024 margin
- Solid R (+31.4) · D 33.5% · R 64.8% · Other 1.7%
- 2008→2024 swing
- -0.1pp no change · 2008: -31.3pp · 2024: -31.4pp
- All cycles
- 2024: R+31.4 2020: R+28.7 2016: R+33.6 2012: R+33.7 2008: R+31.3
Not yet ingested
- Civics
- —
Market trends
- HPI YoY
- ▼ -41.24%
- Current HPI
- 135.2825
- Rent YoY
- ▲ 1.65%
- Metro
- Lafayette, LA
- State GDP YoY
- ▲ 3.29%
- F500 in state
- 10
Industry mix (Fortune 500 HQ in LA)
| Industry | F500 HQs | Revenue |
|---|---|---|
| Telecommunications | 2 | $23B |
|
||
| Utilities | 1 | $12B |
|
||
| Wholesale / Distribution | 1 | $5B |
|
||
| Advertising | 1 | $2B |
|
||
Price history
1 event — show timeline
- 2026-06-04 Listed $225,000 ForSaleByOwner.com
Property tax history
+7.5%/yrLatest (2025): $1,712 · -1.2% YoY. Source: county tax records.
Cash-flow waterfall
monthlySold comps — $/sqft
last 12 mo · ≤1 miLoading sold comps…