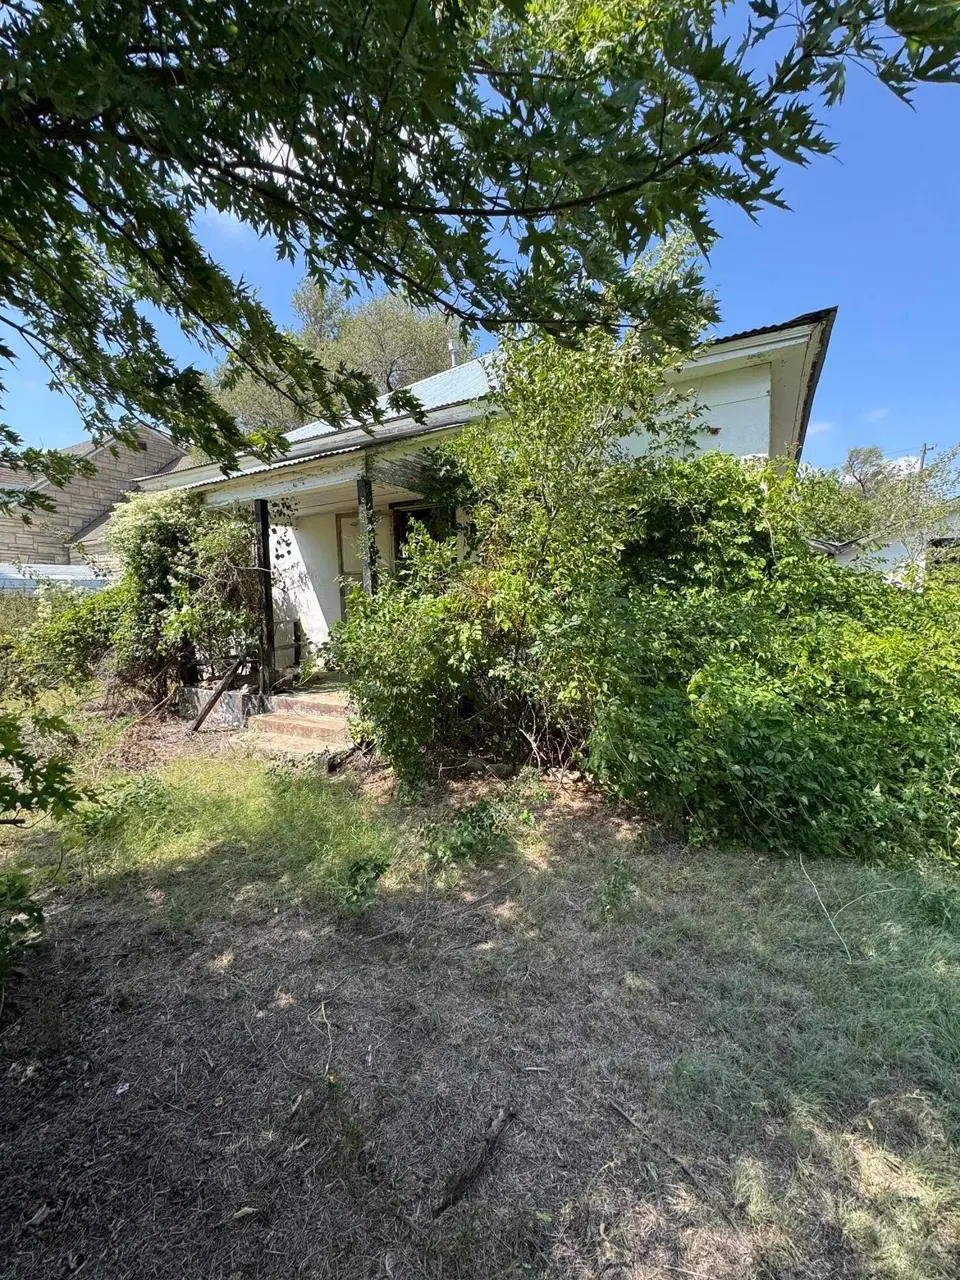
607 Clarendon St · McLean, TX
Flood risk 1/10 · Minimal
- FEMA flood zone
- X (unshaded)
- Chance of flooding over 30 yrs
- 0.0%
- Est. flood insurance / yr
- $507 – $1,088
Fire risk 7/10 · Major
- Est. fire insurance / yr
- $1,222 – $2,270
Heat risk 5/10 · Moderate
- Hot days now (above 100°F)
- 7 days/yr
- Hot days in 30 yrs
- 19 days/yr
Wind risk 2/10 · Minimal
- Chance of severe wind over 30 yrs
- 1.0%
Air-quality risk 1/10 · Minimal
- Unhealthy air days now
- 0 days/yr
- Unhealthy air days in 30 yrs
- 0 days/yr
Risk factors via First Street. Map © Google.
Why this score? — see what drove the C- grade
The composite is a weighted blend of 9 inputs, each scored 0–100. Each bar is that input's sub-score; the figure is the points it added to the 100-point composite (weight × sub-score).
- Cash flow +15.0/30.0
- ARV discount +7.5/15.0
- 1% rule +5.0/10.0
- DSCR +5.0/10.0
- Appreciation +5.0/10.0
- Schools +4.6/10.0
- Livability +3.2/5.0
- Rent growth +2.5/5.0
- Condition / age +2.5/5.0
$15,000
🖨 Deal sheet 📄 Offer letter ✓ Due diligence
Listing remarks MLS
Investor Special! This 3 bed, 1 bath home needs a full rehab but has solid potential. Located in a quiet small town on a nice-sized double lot, it's perfect for an investor, flipper, or DIYer ready to take on a project. Sold AS-IS. No repairs. Priced to move!
Key facts
- Double lot
- Full rehab
- Garage
Tags
Neighborhood map
What this means for you Summary
Snapshot
- This is a 3-bed/1.0-bath single-family listed at $15k.
Deal economics
- At list price, monthly cash flow is $797 ($10k/yr) — positive.
- The deal already cash-flows at list — no discount required.
- Meets the 1% rule at list price ($1k rent vs $15k).
- Recommended offer: $13k (12.0% below list) — sets the bar for market timing.
Location & tenants
- Location reads 63/100 on livability (#896 in TX) — a middle-class / working-renter tenant base. Strengths: cost of living A+, housing A+, crime A-; Watch: schools C-, employment D, amenities F.
- Mclean ISD (rural): math 55% / reading 50% proficiency, ranked #297 of 1,141 in TX (top 26%) — acceptable for families but not a draw, mixed tenant base, ~2y average lease.
- Market conditions: 14 active listings in the ZIP; 7 units permitted in Gray County in 2024 (0 in 5+ unit buildings).
Forward outlook
- In year one you build about $554 of equity ($104 loan paydown + $450 appreciation (3.0% local appreciation)).
- Gray County population projected at +28% by 2050 — long-run rental-demand tailwind backs the buy-and-hold thesis.
- At projected returns (3.0% appreciation + 3.0% rent growth), your $4k cash investment doubles in ~1 year — after that, you're playing with house money.
Negotiation context
- It's been on market 283 days — a 12% lower offer ($13k) is reasonable based on typical stale-listing flexibility.
Risks & watch-outs
- Watch-outs: property tax is 3.7% of price; built in 1920 — expect roof / HVAC / electrical / plumbing capex.
- Climate carrying-cost: major wildfire risk; extreme-heat days projected 7→19/yr by 2055 (HVAC capex compounding) — expect insurance premiums to compound above CPI over the hold.
Questions for the listing agent
- It's been on market 283 days. Have you received any prior offers? Is the seller open to a 12% concession, seller financing, or rate buy-down credit?
- Built in 1920 — when were the roof, HVAC, electrical panel, plumbing, and water heater last replaced?
- Property tax is high relative to price — has the assessment been appealed recently, and will the sale trigger a re-assessment?
- Why hasn't it sold? Are there any deal-killer items the seller is aware of (foundation, flood, title, zoning, code violations)?
- Is there a deadline driving the sale (1031 exchange, divorce, estate, relocation)? That informs how much negotiation room exists.
- What's the average days-on-market for RENTAL listings here right now (not sales)? A rising rental-DOM trend means longer vacancies and softer asking-rent achievability than the comps imply.
- What's the recent tenant-quality profile in this submarket — average credit score on applications, eviction rate, late-payment / NSF rate, and stable-employment percentage? A property-management company in the area should have these aggregated.
- How much new for-sale + rental construction is in the pipeline within 1–3 miles? Heavy new supply typically softens prices + rents 12–24 months out; constrained supply supports both.
Investment metrics
- 1% rule
- 7.83% ✓
- Cap rate
- 70.05%
- Cash-on-cash
- 227.70%
- DSCR
- 11.13
- GRM
- 1.1
CMA / ARV
No comps found within radius.
Projected returns pro-forma
3.0% appreciation · 3.0% rent growth · sell at horizon
- IRR
- —
- Equity multiple
- 13.52×
- Total profit
- $52,599
- Equity at exit
- $6,745
- IRR
- —
- Equity multiple
- 28.66×
- Total profit
- $116,162
- Equity at exit
- $10,394
Cash invested: $4,200 (down + closing). Projections, not guarantees.
Landlord ↔ Tenant lean methodology
- Overall (STATE)
- 87 Strongly Landlord-Friendly
- State Texas
- 87 Strongly Landlord-Friendly · R+5
- County
- — inherits STATE
- City
- — inherits STATE
ZIP-level market 79057
- Active inventory
- 14
- Price-to-rent
- 1.1×
Monthly cashflow live
- Estimated rent
- $1,174 medium interval (Pro) →
- Mortgage (P&I)
- −$79
- Tax from tax record
- −$46 /mo · $551/yr
- Insurance
- −$6
- HOA
- −$0
- Vacancy / Maint / Mgmt
- −$247
- Net cashflow
- $797
Break-even live
UW: 25.0% down · 7.5% · 30yr · 1.5% tax · 5.0% vac · 8.0% maint · 8.0% mgmt
Financing live
Cash to close
- Down payment
- $3,750
- Closing costs
- $450
- Reserves months
- —
- Total cash needed
- —
Loan-product check · same deal, 3 products live
Conventional
25% down · 7.5% · 30yr
- Down + closing
- —
- Monthly P&I
- —
- Monthly cashflow
- —
- DSCR
- —
- Eligible?
- —
Personal DTI + credit; lowest rate.
DSCR
20% down · 8.5% · 30yr
- Down + closing
- —
- Monthly P&I
- —
- Monthly cashflow
- —
- DSCR
- —
- Eligible?
- —
No personal income docs; deal must DSCR.
Hard money
10% down · 12.0% · 12mo
- Down + closing
- —
- Monthly P&I
- —
- Monthly cashflow
- —
- DSCR
- —
- Eligible?
- —
Short-term bridge; refi at stabilization.
Listing history 18 events
-
2026-06-18days on market $15,000 Active 283 DOM
-
2026-06-17days on market $15,000 Active 282 DOM
-
2026-06-16days on market $15,000 Active 281 DOM
-
2026-06-15days on market $15,000 Active 280 DOM
-
2026-06-15days on market $15,000 Active 279 DOM
-
2026-06-13days on market $15,000 Active 278 DOM
-
2026-06-12days on market $15,000 Active 277 DOM
-
2026-06-10pricedays on market $15,000 Active 274 DOM
-
2026-06-08days on market $20,000 Active 273 DOM
-
2026-06-08days on market $20,000 Active 272 DOM
-
2026-06-05days on market $20,000 Active 270 DOM
-
2026-06-03days on market $20,000 Active 268 DOM
-
2026-06-02days on market $20,000 Active 267 DOM
-
2026-06-01days on market $20,000 Active 266 DOM
-
2026-05-31days on market $20,000 Active 265 DOM
-
2026-03-09price $20,000 260-char remark
Show marketing remark (260 chars)
Investor Special! This 3 bed, 1 bath home needs a full rehab but has solid potential. Located in a quiet small town on a nice-sized double lot, it's perfect for an investor, flipper, or DIYer ready to take on a project. Sold AS-IS. No repairs. Priced to move!
-
2025-09-08$50,000 Active 260-char remark
Show marketing remark (260 chars)
Investor Special! This 3 bed, 1 bath home needs a full rehab but has solid potential. Located in a quiet small town on a nice-sized double lot, it's perfect for an investor, flipper, or DIYer ready to take on a project. Sold AS-IS. No repairs. Priced to move!
-
2019-09-10soldstatus
ⓘ Source: listings_history table (triggers on properties + properties_extension) + one-shot
backfill from property_details.listing_events for pre-trigger history.
Tax reassessment forecast TX · Resets to sale price
- Current annual tax
- $551 · $46/mo
- Projected year-2 tax
- $551 · $46/mo
- Expected delta
- $0/yr ($0/mo · 0.0%)
ⓘ Screening estimate from a state-policy table — verify with the county assessor before closing.
Climate risk First Street
- Flood 1/10 Low FEMA zone X (unshaded) · 0% chance over 30 yrs
- Wildfire 7/10 Severe
- Heat 5/10 Major 7 d/yr ≥100°F today · 19 d/yr by 30 yrs out
- Wind 2/10 Low 100% chance of damaging wind over 30 yrs
- Air quality 1/10 Low 0 unhealthy d/yr today · 0 by 30 yrs out
Nearby sold comps map
Loading sold comps map…
Walkable amenities ~0.75 mi
Loading nearby amenities…
Taxation est. · year 1
- Rental income
- $14,093
- − Mortgage interest
- −$840
- − Property taxes
- −$551
- − Insurance
- −$75
- − Repairs & maintenance
- −$1,127
- − Management
- −$1,127
- − Depreciation
- −$436
- Taxable income
- $9,935
- Est. tax owed @ 24.0%
- −$2,384
- After-tax cash flow
- $7,179/yr
For passive investors: Depreciation is non-cash, so a rental often shows a tax loss while cash-flowing — sheltering income. Rental losses are passive: they offset passive income freely, and up to $25,000/yr can offset ordinary (W-2) income if you actively participate and your MAGI is under $100k (phasing out to $0 by $150k); unused losses carry forward. On sale, claimed depreciation is recaptured at up to 25%, and gains may owe capital-gains tax (a 1031 exchange can defer both). Figures are a year-1 estimate at your 24.0% rate — not tax advice; consult a CPA.
Schools (NCES district)
- District
- Mclean ISD
- NCES district ID
- 4829880
- Math proficiency
- 55% ▬ 0.00%
- Reading proficiency
- 50% ▲ 5.00%
- Median HH income
- $42,711
- Composite
- 46.09/100
- National rank
- #5480
- State rank
- #297 of 1141 in TX
Livability — McLean
- Score
- 63/100
- State rank
- #896
- US rank
- #16067
Category grades
Schools grade is shown separately in the Schools card above.
Census & demographics
- Census place
- McLean, TX
- Population (ZIP)
- 1,075
Population outlook (Gray County) Hauer SSP2
- Today (2025)
- 24,965 people
- By 2030
- 26,105 · +4.6%
- By 2040
- 28,752 · +15.2%
- By 2050
- 31,859 · +27.6%
- By 2075
- 39,812 · +59.5%
- By 2100
- 43,284 · +73.4%
Race, ethnicity, and origin ACS 2023
- Neighborhood character
- Predominantly White (81%)
- Race & ethnicity
- White 81% Hispanic / Latino 16% Two or more races 9% Native American 3%
- Hispanic origin (detail)
- Mexican 16%
- Common ancestry
- Iranian 19% Slovak 1% Romanian 1%
- Foreign-born
- 7% · Canada
- Languages at home
- 85% English-only · Spanish 15%
Political lean MEDSL · Gray
- 2024 margin
- Solid R (+77.1) · D 11.2% · R 88.3%
- 2008→2024 swing
- -6.2pp toward R · 2008: -71.0pp · 2024: -77.1pp
- All cycles
- 2024: R+77.1 2020: R+77.2 2016: R+78.8 2012: R+75.2 2008: R+71.0
Not yet ingested
- Civics
- —
Market trends
- HPI YoY
- —
- Current HPI
- —
- Rent YoY
- —
- Metro
- —
- State GDP YoY
- ▲ 3.95%
- F500 in state
- 110
Industry mix (Fortune 500 HQ in TX)
| Industry | F500 HQs | Revenue |
|---|---|---|
| Energy | 16 | $1,198B |
|
||
| Technology | 5 | $198B |
|
||
| Engineering / Construction | 4 | $72B |
|
||
| Energy Services | 3 | $60B |
|
||
| Utilities | 3 | $41B |
|
||
| Healthcare | 2 | $330B |
|
||
Price history
-60.0% since first listed3 events — show timeline
- 2026-03-09 Price Changed $20,000 AARMLS
- 2025-09-08 Listed $50,000 AARMLS
- 2019-09-10 Sold (Public Records) — Public Records
Property tax history
+7.1%/yrLatest (2025): $551 · +42.6% YoY. Source: county tax records.
Cash-flow waterfall
monthlySold comps — $/sqft
last 12 mo · ≤1 miLoading sold comps…