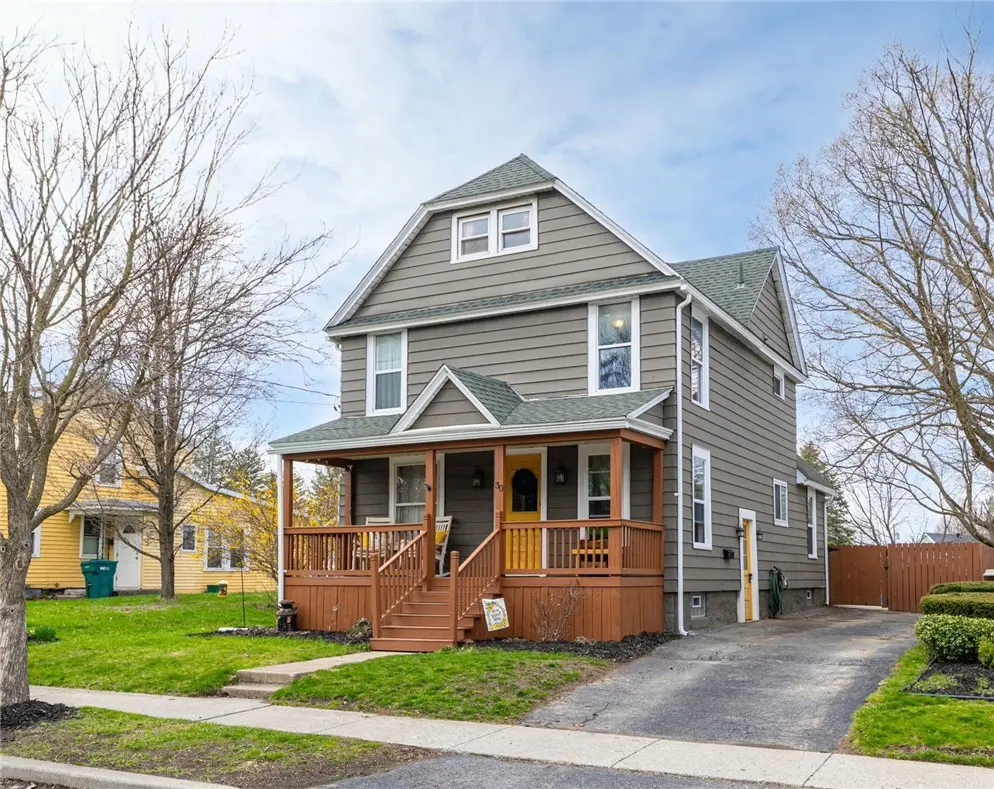
30 Pearl St · Batavia, NY
Flood risk 1/10 · Minimal
- FEMA flood zone
- X
- Chance of flooding over 30 yrs
- 0.0%
- Est. flood insurance / yr
- $473 – $860
Fire risk 3/10 · Minor
- Est. fire insurance / yr
- $691 – $1,283
Heat risk 2/10 · Minimal
- Hot days now (above 96°F)
- 7 days/yr
- Hot days in 30 yrs
- 16 days/yr
Wind risk 1/10 · Minimal
- Chance of severe wind over 30 yrs
- —
Air-quality risk 2/10 · Minimal
- Unhealthy air days now
- 1 days/yr
- Unhealthy air days in 30 yrs
- 2 days/yr
Risk factors via First Street. Map © Google.
Why this score? — see what drove the D grade
The composite is a weighted blend of 9 inputs, each scored 0–100. Each bar is that input's sub-score; the figure is the points it added to the 100-point composite (weight × sub-score).
- Cash flow +13.1/30.0
- ARV discount +8.8/15.0
- DSCR +3.9/10.0
- Schools +3.7/10.0
- Livability +3.4/5.0
- 1% rule +3.1/10.0
- Rent growth +2.5/5.0
- Condition / age +2.5/5.0
- Appreciation +0.0/10.0
$189,900
🖨 Deal sheet (PDF) 📄 Offer letter ✓ Due diligence
Listing remarks
MOVE-IN READY with CHARM & SPACE! Welcome to 30 Pearl St in the City of Batavia, the colonial you’ve been waiting for w/ the perfect blend of warm country feel & modern updates throughout. Ideally located across from Williams Park, just minutes to Main Street shops, restaurants & everyday conveniences and a short drive to Batavia Downs. Room for the whole family w/ up to 5 bedrooms, 1 full bath & over 1,500 sqft of living space incl the recently finished attic! Almost everything in this home has been redone since 2021 when it was down to the studs! You’ll love the storybook curb appeal w/ tidy landscaping & inviting covered front porch. Step insi
Key facts
- Brick backsplash
- Abundant cabinetry
- Granite counters
Tags
Neighborhood map
What this means for you Summary
Snapshot
- This is a 3-bed/1.0-bath single-family listed at $190k.
Deal economics
- At list price, monthly cash flow is $-9 ($-103/yr) — negative.
- To cash-flow at today's rent, offer at most $188k (0.8% below list).
- To meet the 1% rule (rent ≥ 1% of price), the offer needs to be $153k (19.3% below list).
- Recommended offer: $153k (19.3% below list) — sets the bar for 1% rule.
Location & tenants
- Location reads 68/100 on livability (#536 in NY) — a middle-class / working-renter tenant base. Strengths: cost of living A+, housing A+, health & safety A; Watch: employment C-, crime D+, amenities F.
- Batavia City School District (town): math 38% / reading 50% proficiency, ranked #477 of 590 in NY (top 81%) — families likely to look elsewhere, expect single-tenant / working-renter base with shorter leases.
- Market conditions: 90 active listings in the ZIP; 5 comparable units currently listed for rent nearby; rentals leasing fast (median 3d on market — plan ~1-2 weeks tenant-placement turnaround); 55 units permitted in Genesee County in 2024 (0 in 5+ unit buildings).
Forward outlook
- Local home prices are declining (-3.0%/yr); year-one equity from $1k of loan paydown is wiped out by about $6k of value loss. Plan a longer hold.
- Genesee County population projected at -22% by 2050 — secular population decline; favor cash flow + early exit over multi-decade hold.
Negotiation context
- Only 8 days on market — expect competitive offers; lowballing is unlikely to land.
- 2 sale attempts since 9y ago with the ask held roughly flat each time — persistent listings suggest the price (not the market) is what's stuck; bring a comps-based counter.
- Current owner paid $50k; list at $190k implies a 280% gain — meaningful room to come down on a strong offer.
Risks & watch-outs
- Watch-outs: built in 1900 — expect roof / HVAC / electrical / plumbing capex.
Questions for the listing agent
- What do current leases actually rent for vs. the listed asking? Can we see a recent rent roll and the last 12 months of T-12 income?
- Built in 1900 — when were the roof, HVAC, electrical panel, plumbing, and water heater last replaced?
- Is there a deadline driving the sale (1031 exchange, divorce, estate, relocation)? That informs how much negotiation room exists.
- Schools are B-rated — typically a magnet for longer-tenancy family renters. What's the average tenant stay here, and is there a school-zone premium baked into asking?
- Crime grade is D in this area — have there been break-ins, vandalism, or insurance claims at this property in the last 3 years? What carrier currently insures it and at what premium?
- The area grade is low — what's the realistic commute time and amenity access for the typical tenant pool here? Any planned neighborhood developments (good or bad) we should know about?
- What's the average days-on-market for RENTAL listings here right now (not sales)? A rising rental-DOM trend means longer vacancies and softer asking-rent achievability than the comps imply.
- What's the recent tenant-quality profile in this submarket — average credit score on applications, eviction rate, late-payment / NSF rate, and stable-employment percentage? A property-management company in the area should have these aggregated.
- How much new for-sale + rental construction is in the pipeline within 1–3 miles? Heavy new supply typically softens prices + rents 12–24 months out; constrained supply supports both.
Investment metrics
- 1% rule
- 0.81% ✗
- Cap rate
- 6.24%
- Cash-on-cash
- -0.19%
- DSCR
- 0.99
- GRM
- 10.3
CMA / ARV
- ARV (on-the-fly)
- $195,640
- Comps found
- 12
Show comp detail 12 sales within ~0.75 mi
| Address | Dist | Beds/Ba | Sqft | Sold | Price | $/sf | Match |
|---|---|---|---|---|---|---|---|
| 43-45 Roosevelt Ave | 0.43mi | 3/1.0 | 1,348 (+1%) | 1mo | $245,000 | $182 | 79 |
| 23 Adams St | 0.28mi | 4/1.0 (+1) | 1,368 (+2%) | 1mo | $225,000 | $164 | 77 |
| 152 S Main St | 0.36mi | 3/2.0 | 1,300 (-3%) | 4mo | $150,000 | $115 | 70 |
| 21 Lewis Ave | 0.53mi | 3/1.0 | 1,392 (+4%) | 1mo | $190,000 | $136 | 68 |
| 2 Lincoln Ave | 0.44mi | 4/1.0 (+1) | 1,344 (+0%) | 9mo | $164,900 | $123 | 67 |
| 10 Montclair Ave | 0.28mi | 4/1.0 (+1) | 1,200 (-10%) | 8mo | $161,000 | $134 | 58 |
| 30 N Lyon St | 0.36mi | 3/1.5 | 1,477 (+10%) | 9mo | $125,500 | $85 | 56 |
| 2 Charles St | 0.47mi | 4/2.0 (+1) | 1,270 (-5%) | 9mo | $215,500 | $170 | 53 |
| 26 Dellinger Ave | 0.37mi | 3/1.5 | 1,536 (+15%) | 8mo | $164,000 | $107 | 50 |
| 50 Union St | 0.55mi | 3/1.5 | 1,196 (-11%) | 8mo | $175,000 | $146 | 48 |
| 71 River St | 0.66mi | 4/1.0 (+1) | 1,180 (-12%) | 1mo | $212,500 | $180 | 43 |
| 48 Redfield Pkwy | 0.73mi | 4/2.0 (+1) | 1,248 (-7%) | 3mo | $230,000 | $184 | 43 |
Match score weights: distance 35% · size 25% · config 20% · recency 20%. Top-matched comps best support the ARV.
Projected returns pro-forma
-3.0% appreciation · 3.0% rent growth · sell at horizon
- IRR
- -16.6%
- Equity multiple
- 0.41×
- Total profit
- $-31,352
- Equity at exit
- $28,315
- IRR
- -8.5%
- Equity multiple
- 0.47×
- Total profit
- $-28,141
- Equity at exit
- $16,419
Cash invested: $53,172 (down + closing). Projections, not guarantees.
Landlord ↔ Tenant lean methodology
- Overall (STATE)
- 15 Strongly Tenant-Friendly
- State New York
- 15 Strongly Tenant-Friendly · D+10
- County
- — inherits STATE
- City
- — inherits STATE
ZIP-level market 14020
- Home prices YoY
- -10.4%
- Active inventory
- 90
- Price-to-rent
- 10.3×
Monthly cashflow live
- Estimated rent
- $1,533 high interval (Pro) →
- Mortgage (P&I)
- −$996
- Tax from tax record
- −$145 /mo · $1,736/yr
- Insurance
- −$79
- HOA
- −$0
- Vacancy / Maint / Mgmt
- −$322
- Net cashflow
- $-9
Break-even live
Sensitivity live
| Price | -10% $99 | -5% $45 | +0% $-9 | +5% $-62 | +10% $-116 |
|---|---|---|---|---|---|
| Rent | -10% $-130 | -5% $-69 | +0% $-9 | +5% $52 | +10% $113 |
| Rate | -1.0pp $87 | -0.5pp $40 | base $-9 | +0.5pp $-58 | +1.0pp $-108 |
UW: 25.0% down · 7.5% · 30yr · 1.5% tax · 5.0% vac · 8.0% maint · 8.0% mgmt
Financing live
Cash to close
- Down payment
- $47,475
- Closing costs
- $5,697
- Reserves months
- —
- Total cash needed
- —
Loan-product check · same deal, 3 products live
Conventional
25% down · 7.5% · 30yr
- Down + closing
- —
- Monthly P&I
- —
- Monthly cashflow
- —
- DSCR
- —
- Eligible?
- —
Personal DTI + credit; lowest rate.
DSCR
20% down · 8.5% · 30yr
- Down + closing
- —
- Monthly P&I
- —
- Monthly cashflow
- —
- DSCR
- —
- Eligible?
- —
No personal income docs; deal must DSCR.
Hard money
10% down · 12.0% · 12mo
- Down + closing
- —
- Monthly P&I
- —
- Monthly cashflow
- —
- DSCR
- —
- Eligible?
- —
Short-term bridge; refi at stabilization.
Rent comps 5 comps
| Address | Beds | Baths | Sqft | Rent | $/sqft | DOM | Units | Dist |
|---|---|---|---|---|---|---|---|---|
| 105 Main St Unit 2 Batavia, NY | 2.0 | 2.0 | 950 | $2,100 | $2.21 | 3d | 1 | 0.57mi |
| 224 State St Batavia, NY | 2.0 | 1.0 | 1000 | $1,150 | $1.15 | 3d | 1 | 0.86mi |
| 10 Woodstock Gdns Unit 10 Batavia, NY | 2.0 | 1.0 | 1007 | $1,230 | $1.22 | 3d | 1 | 1.40mi |
| 219 N Spruce St Batavia, NY | 2.0 | 1.0 | 1007 | $1,230 | $1.22 | 45d | 1 | 1.44mi |
| 115 Woodstock Gdns Unit 115 Batavia, NY | 2.0 | 1.0 | 1007 | $1,230 | $1.22 | 11d | 1 | 1.45mi |
Listing history 25 events
-
2026-04-24status Pending
-
2026-04-16$189,900 Active
-
2021-09-01soldstatus $50,000
-
2018-12-20historical
-
2018-10-08price $59,500
-
2018-08-08price $41,400
-
2018-07-16price $41,500
-
2018-07-07price $42,500
-
2018-06-27price $42,900
-
2018-06-22price $43,000
-
2018-05-19price $43,300
-
2018-05-10price $43,500
-
2018-04-29price $43,900
-
2018-04-04price $44,444
-
2018-03-12price $44,985
-
2018-03-06price $46,269
-
2018-02-11price $47,695
-
2018-02-08price $47,850
-
2018-02-02price $49,950
-
2018-01-22price $54,900
-
2018-01-18price $56,900
-
2018-01-12price $57,800
-
2018-01-09price $57,900
-
2017-12-22$59,000 Active
-
2001-08-29soldstatus $59,500
ⓘ Source: listings_history table (triggers on properties + properties_extension) + one-shot
backfill from property_details.listing_events for pre-trigger history.
Tax reassessment forecast NY · Partial reset (capped growth)
- Current annual tax
- $1,736 · $145/mo
- Projected year-2 tax
- $2,473 · $206/mo
- Expected delta
- +$737/yr (+$61/mo · 42.4%)
ⓘ Screening estimate from a state-policy table — verify with the county assessor before closing.
Climate risk First Street
- Flood 1/10 Low FEMA zone X · 0% chance over 30 yrs
- Wildfire 3/10 Moderate
- Heat 2/10 Low 7 d/yr ≥96°F today · 16 d/yr by 30 yrs out
- Wind 1/10 Low
- Air quality 2/10 Low 1 unhealthy d/yr today · 2 by 30 yrs out
Nearby sold comps map
Loading sold comps map…
Walkable amenities ~0.75 mi
Loading nearby amenities…
Taxation est. · year 1
- Rental income
- $18,396
- − Mortgage interest
- −$10,637
- − Property taxes
- −$1,736
- − Insurance
- −$950
- − Repairs & maintenance
- −$1,472
- − Management
- −$1,472
- − Depreciation
- −$5,524
- Taxable loss
- −$3,395
- Est. tax savings @ 24.0%
- +$815
- After-tax cash flow
- $712/yr
For passive investors: Depreciation is non-cash, so a rental often shows a tax loss while cash-flowing — sheltering income. Rental losses are passive: they offset passive income freely, and up to $25,000/yr can offset ordinary (W-2) income if you actively participate and your MAGI is under $100k (phasing out to $0 by $150k); unused losses carry forward. On sale, claimed depreciation is recaptured at up to 25%, and gains may owe capital-gains tax (a 1031 exchange can defer both). Figures are a year-1 estimate at your 24.0% rate — not tax advice; consult a CPA.
Schools (NCES district)
- District
- Batavia City School District
- NCES district ID
- 3603990
- Math proficiency
- 38% ▼ -13.00%
- Reading proficiency
- 50% ▲ 4.00%
- Median HH income
- $43,288
- Composite
- 37.13/100
- National rank
- #4490
- State rank
- #477 of 590 in NY
Livability — Batavia
- Score
- 68/100
- State rank
- #536
- US rank
- #9660
Category grades
Schools grade is shown separately in the Schools card above.
Census & demographics
- Census place
- Batavia, NY
- County
- Genesee County · 22,002 people
- City population
- 22,002
- Metro
- Batavia, NY
- Population (ZIP)
- 22,002
- Household income
- $62,655
- Rent vs Own
- Severe rent burden
- 817.0
Population outlook (Genesee County) Hauer SSP2
- Today (2025)
- 56,113 people
- By 2030
- 54,140 · -3.5%
- By 2040
- 49,368 · -12.0%
- By 2050
- 43,911 · -21.7%
- By 2075
- 32,511 · -42.1%
- By 2100
- 21,695 · -61.3%
Race, ethnicity, and origin ACS 2023
- Neighborhood character
- Predominantly White (87%)
- Race & ethnicity
- White 87% Two or more races 6% Hispanic / Latino 4% Black 3% Asian 1%
- Common ancestry
- Romanian 11% Lithuanian 2% Slovak 2%
- Foreign-born
- 4% · Canada, China
- Languages at home
- 95% English-only · Spanish 3% Chinese 1%
Political lean MEDSL · Genesee
- 2024 margin
- Solid R (+34.0) · D 33.0% · R 67.0%
- 2008→2024 swing
- -15.6pp toward R · 2008: -18.4pp · 2024: -34.0pp
- All cycles
- 2024: R+34.0 2020: R+31.7 2016: R+37.0 2012: R+20.9 2008: R+18.4
Not yet ingested
- Civics
- —
Market trends
- HPI YoY
- ▼ -30.58%
- Current HPI
- 263.2147
- Rent YoY
- —
- Metro
- Batavia, NY
- State GDP YoY
- ▲ 2.60%
- F500 in state
- 92
Industry mix (Fortune 500 HQ in NY)
| Industry | F500 HQs | Revenue |
|---|---|---|
| Financial Services | 10 | $950B |
|
||
| Consumer Goods | 9 | $162B |
|
||
| Insurance | 4 | $225B |
|
||
| Telecommunications | 2 | $144B |
|
||
| Pharmaceuticals | 2 | $112B |
|
||
| Media / Entertainment | 2 | $69B |
|
||
Price history
+219.2% since first listed25 events — show timeline
- 2026-04-24 Pending — UNYREIS
- 2026-04-16 Listed $189,900 UNYREIS
- 2021-09-01 Sold (Public Records) $50,000 Public Records
- 2018-12-20 Listing Removed — WNYREIS
- 2018-10-08 Price Changed $59,500 WNYREIS
- 2018-08-08 Price Changed $41,400 WNYREIS
- 2018-07-16 Price Changed $41,500 WNYREIS
- 2018-07-07 Price Changed $42,500 WNYREIS
- 2018-06-27 Price Changed $42,900 WNYREIS
- 2018-06-22 Price Changed $43,000 WNYREIS
- 2018-05-19 Price Changed $43,300 WNYREIS
- 2018-05-10 Price Changed $43,500 WNYREIS
- 2018-04-29 Price Changed $43,900 WNYREIS
- 2018-04-04 Price Changed $44,444 WNYREIS
- 2018-03-12 Price Changed $44,985 WNYREIS
- 2018-03-06 Price Changed $46,269 WNYREIS
- 2018-02-11 Price Changed $47,695 WNYREIS
- 2018-02-08 Price Changed $47,850 WNYREIS
- 2018-02-02 Price Changed $49,950 WNYREIS
- 2018-01-22 Price Changed $54,900 WNYREIS
- 2018-01-18 Price Changed $56,900 WNYREIS
- 2018-01-12 Price Changed $57,800 WNYREIS
- 2018-01-09 Price Changed $57,900 WNYREIS
- 2017-12-22 Listed $59,000 WNYREIS
- 2001-08-29 Sold (Public Records) $59,500 Public Records
Property tax history
-1.4%/yrLatest (2025): $1,736 · -47.8% YoY. Source: county tax records.
Cash-flow waterfall
monthlySold comps — $/sqft
last 12 mo · ≤1 miLoading sold comps…