 🏷️ Likely Rental
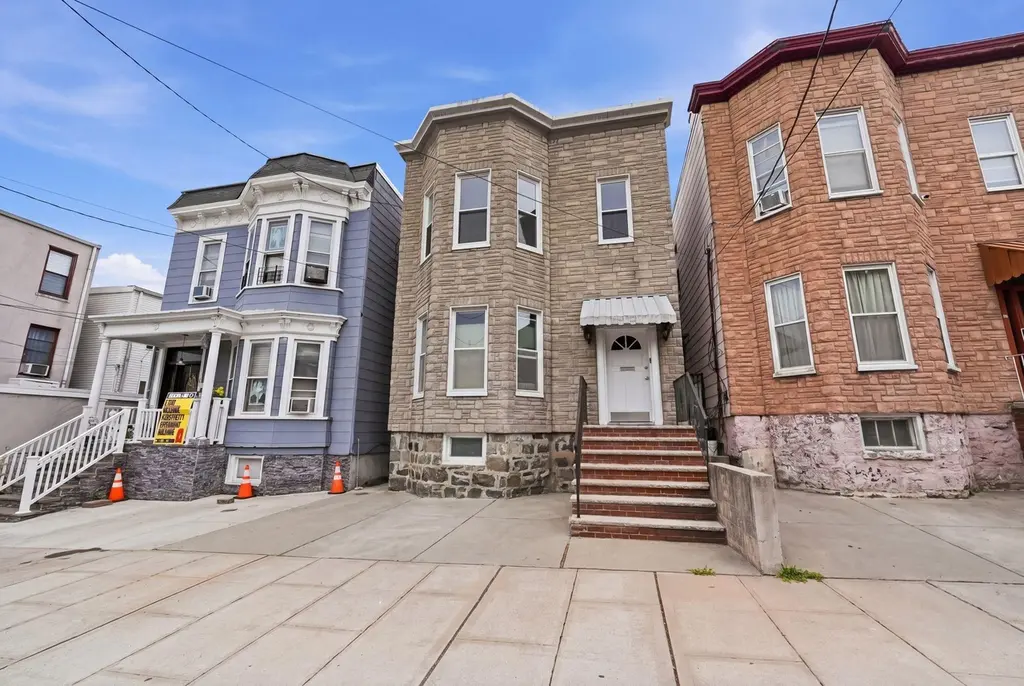
720 15TH St · Union City, NJ
Flood risk 1/10 · Minimal
- FEMA flood zone
- X (unshaded)
- Chance of flooding over 30 yrs
- 0.0%
- Est. flood insurance / yr
- $507 – $1,088
Fire risk 1/10 · Minimal
- Est. fire insurance / yr
- $526 – $976
Heat risk 6/10 · Moderate
- Hot days now (above 98°F)
- 7 days/yr
- Hot days in 30 yrs
- 14 days/yr
Wind risk 6/10 · Moderate
- Chance of severe wind over 30 yrs
- 27.0%
Air-quality risk 4/10 · Minor
- Unhealthy air days now
- 5 days/yr
- Unhealthy air days in 30 yrs
- 6 days/yr
Risk factors via First Street. Map © Google.
Why this score? — see what drove the D- grade
The composite is a weighted blend of 9 inputs, each scored 0–100. Each bar is that input's sub-score; the figure is the points it added to the 100-point composite (weight × sub-score).
- ARV discount +15.0/15.0
- Appreciation +10.0/10.0
- Livability +3.9/5.0
- Cash flow +3.5/30.0
- Rent growth +2.7/5.0
- Condition / age +2.5/5.0
- Schools +2.2/10.0
- 1% rule +0.2/10.0
- DSCR +0.0/10.0
$729,000
🖨 Deal sheet (PDF) 📄 Offer letter ✓ Due diligence
Listing remarks
RARE OPPORTUNITY: Well-positioned 2-family investment property in prime Union City location. This 6-bedroom, 2-bathroom home offers excellent rental income potential with two separate units ready for immediate occupancy. Delivered vacant, allowing buyer flexibility for unit configuration and tenant placement. Features dedicated driveway with 2 spots. Being sold as-is. Ideal for owner-occupied plus rental, 1031 exchange, or investor portfolio. Excellent location near schools, shopping, transit, and major highways. Strong rental market area. Schedule your showing today!
Key facts
- Dedicated driveway
- Two separate units
- 2 parking spots
Tags
Property features AI
Finance
- Other: Includes an outside plastic bin used for outdoor tools
Exterior
- Parking: Parking for 2 cars
- Home design: Two-family property (duplex layout with two kitchens and two living rooms)
- Construction: Full unfinished walk-out basement
- Exterior features: Brick and shingle exterior; Lot number 14
Interior
- Kitchen: One full kitchen on the first floor; One full kitchen on the second floor
- Bedrooms: Three bedrooms on the first floor; Three bedrooms on the second floor
- Bathrooms: Two full bathrooms total (one full bath on each floor)
- Heating & cooling: Oil heating with radiators and steam
- Interior features: Two separate living units (each with its own living room and kitchen); Full unfinished walk-out basement; Lead paint disclosure provided
- Laundry & utility: Basement provides utility access (unfinished)
Neighborhood map
What this means for you Summary
Snapshot
- This is a 6-bed/2.0-bath single-family listed at $729k.
Deal economics
- At list price, monthly cash flow is $-2k ($-27k/yr) — negative.
- To cash-flow at today's rent, offer at most $337k (53.7% below list).
- To meet the 1% rule (rent ≥ 1% of price), the offer needs to be $376k (48.5% below list).
- Recommended offer: $337k (53.7% below list) — sets the bar for cash-flow.
Location & tenants
- Location reads 77/100 on livability (#117 in NJ, #2,998 nationally) — a middle-class / working-renter tenant base. Strengths: amenities A+, commute A+, health & safety A; Watch: cost of living F.
- Union City School District (suburban): math 15% / reading 36% proficiency, ranked #399 of 472 in NJ (top 84%) — low school quality limits family demand, transient renter base, plan for 1-2y turnover; 85% free/reduced lunch — lower-income household profile, screen leases tightly.
- Zoned schools: Veterans' Memorial Elementary School (math 7% / reading 26%, grade F, #1,094 of 1,303 statewide, top 85%, 551 students, 87% FRL); Emerson Middle School (math 15% / reading 40%, grade F, #340 of 431 statewide, top 80%, 1,001 students, 87% FRL); Union City High School (math 12% / reading 35%, grade F, #331 of 399 statewide, top 83%, 3,025 students, 83% FRL) — zoned schools at 86% FRL track the district average.
- Market conditions: Rents flat; 228 active listings in the ZIP; 1 comparable units currently listed for rent nearby; 5,310 units permitted in Hudson County in 2024 (4,154 in 5+ unit buildings).
- At $3,758/mo this rent would consume 70% of the median local household income ($64k/yr) (locally 6042% of renters already pay >50% of income on rent) — very limited rent-growth headroom before tenants either downsize or default.
Forward outlook
- In year one you build about $78k of equity ($5k loan paydown + $73k appreciation (10.0% local appreciation)).
- Hudson County population projected at +29% by 2050 — long-run rental-demand tailwind backs the buy-and-hold thesis.
- By year 2, paydown + projected appreciation supports a ~$125k cash-out refi (75% LTV) — recoverable capital for the next deal without selling this one.
Negotiation context
- It's been on market 31 days — a 3% lower offer ($707k) is reasonable based on typical stale-listing flexibility.
Risks & watch-outs
- Watch-outs: built in 1913 — expect roof / HVAC / electrical / plumbing capex.
- Climate carrying-cost: major wind risk, 27% chance of damaging wind over 30y; extreme-heat days projected 7→14/yr by 2055 (HVAC capex compounding) — expect insurance premiums to compound above CPI over the hold.
Questions for the listing agent
- What do current leases actually rent for vs. the listed asking? Can we see a recent rent roll and the last 12 months of T-12 income?
- It's been on market 31 days. Have you received any prior offers? Is the seller open to a 54% concession, seller financing, or rate buy-down credit?
- Built in 1913 — when were the roof, HVAC, electrical panel, plumbing, and water heater last replaced?
- Is there a deadline driving the sale (1031 exchange, divorce, estate, relocation)? That informs how much negotiation room exists.
- The area grade is low — what's the realistic commute time and amenity access for the typical tenant pool here? Any planned neighborhood developments (good or bad) we should know about?
- What's the average days-on-market for RENTAL listings here right now (not sales)? A rising rental-DOM trend means longer vacancies and softer asking-rent achievability than the comps imply.
- What's the recent tenant-quality profile in this submarket — average credit score on applications, eviction rate, late-payment / NSF rate, and stable-employment percentage? A property-management company in the area should have these aggregated.
- How much new for-sale + rental construction is in the pipeline within 1–3 miles? Heavy new supply typically softens prices + rents 12–24 months out; constrained supply supports both.
Investment metrics
- 1% rule
- 0.52% ✗
- Cap rate
- 2.64%
- Cash-on-cash
- -13.04%
- DSCR
- 0.42
- GRM
- 16.2
CMA / ARV
- ARV (median comp)
- $1,102,626
- List price
- $729,000
- Delta
- -33.89%
- Verdict
- UNDERPRICED
- Comps
- 14 within 1.0 mi
Projected returns pro-forma
10.0% appreciation · 0.89% rent growth · sell at horizon
- IRR
- 14.8%
- Equity multiple
- 2.22×
- Total profit
- $248,140
- Equity at exit
- $656,741
- IRR
- 14.3%
- Equity multiple
- 5.05×
- Total profit
- $827,557
- Equity at exit
- $1,416,287
Cash invested: $204,120 (down + closing). Projections, not guarantees.
Landlord ↔ Tenant lean methodology
- Overall (STATE)
- 21 Tenant-Leaning
- State New Jersey
- 21 Tenant-Leaning · D+6
- County
- — inherits STATE
- City
- — inherits STATE
ZIP-level market 07087
- Home prices YoY
- 9.6%
- Rents YoY
- 0.9%
- Active inventory
- 228
- Price-to-rent
- 16.2×
Monthly cashflow live
- Estimated rent
- $3,758 medium interval (Pro) →
- Mortgage (P&I)
- −$3,823
- Tax from tax record
- −$1,059 /mo · $12,711/yr
- Insurance
- −$304
- HOA
- −$0
- Vacancy / Maint / Mgmt
- −$789
- Net cashflow
- $-2,217
Break-even live
Sensitivity live
| Price | -10% $-1,805 | -5% $-2,011 | +0% $-2,217 | +5% $-2,424 | +10% $-2,630 |
|---|---|---|---|---|---|
| Rent | -10% $-2,514 | -5% $-2,366 | +0% $-2,217 | +5% $-2,069 | +10% $-1,921 |
| Rate | -1.0pp $-1,850 | -0.5pp $-2,032 | base $-2,217 | +0.5pp $-2,406 | +1.0pp $-2,598 |
UW: 25.0% down · 7.5% · 30yr · 1.5% tax · 5.0% vac · 8.0% maint · 8.0% mgmt
Financing live
Cash to close
- Down payment
- $182,250
- Closing costs
- $21,870
- Reserves months
- —
- Total cash needed
- —
Loan-product check · same deal, 3 products live
Conventional
25% down · 7.5% · 30yr
- Down + closing
- —
- Monthly P&I
- —
- Monthly cashflow
- —
- DSCR
- —
- Eligible?
- —
Personal DTI + credit; lowest rate.
DSCR
20% down · 8.5% · 30yr
- Down + closing
- —
- Monthly P&I
- —
- Monthly cashflow
- —
- DSCR
- —
- Eligible?
- —
No personal income docs; deal must DSCR.
Hard money
10% down · 12.0% · 12mo
- Down + closing
- —
- Monthly P&I
- —
- Monthly cashflow
- —
- DSCR
- —
- Eligible?
- —
Short-term bridge; refi at stabilization.
Rent comps 1 comps
| Address | Beds | Baths | Sqft | Rent | $/sqft | DOM | Units | Dist |
|---|---|---|---|---|---|---|---|---|
| 72 Charles St #2 Jersey City, NJ | 5.0 | 3.0 | 1500 | $4,495 | $3.00 | 14d | 1 | 1.10mi |
Listing history 2 events
-
2026-06-07statusdays on market $729,000 Under Contract 31 DOM
-
2026-05-04$729,000 Active
ⓘ Source: listings_history table (triggers on properties + properties_extension) + one-shot
backfill from property_details.listing_events for pre-trigger history.
Tax reassessment forecast NJ · Partial reset (capped growth)
- Current annual tax
- $12,711 · $1,059/mo
- Projected year-2 tax
- $15,431 · $1,286/mo
- Expected delta
- +$2,721/yr (+$227/mo · 21.4%)
ⓘ Screening estimate from a state-policy table — verify with the county assessor before closing.
Climate risk First Street
- Flood 1/10 Low FEMA zone X (unshaded) · 0% chance over 30 yrs
- Wildfire 1/10 Low
- Heat 6/10 Major 7 d/yr ≥98°F today · 14 d/yr by 30 yrs out
- Wind 6/10 Major 27% chance of damaging wind over 30 yrs
- Air quality 4/10 Moderate 5 unhealthy d/yr today · 6 by 30 yrs out
Nearby sold comps map
Loading sold comps map…
Walkable amenities ~0.75 mi
Loading nearby amenities…
Taxation est. · year 1
- Rental income
- $45,091
- − Mortgage interest
- −$40,835
- − Property taxes
- −$12,711
- − Insurance
- −$3,645
- − Repairs & maintenance
- −$3,607
- − Management
- −$3,607
- − Depreciation
- −$21,207
- Taxable loss
- −$40,521
- Est. tax savings @ 24.0%
- +$9,725
- After-tax cash flow
- $-16,884/yr
For passive investors: Depreciation is non-cash, so a rental often shows a tax loss while cash-flowing — sheltering income. Rental losses are passive: they offset passive income freely, and up to $25,000/yr can offset ordinary (W-2) income if you actively participate and your MAGI is under $100k (phasing out to $0 by $150k); unused losses carry forward. On sale, claimed depreciation is recaptured at up to 25%, and gains may owe capital-gains tax (a 1031 exchange can defer both). Figures are a year-1 estimate at your 24.0% rate — not tax advice; consult a CPA.
Schools (NCES district)
- District
- Union City School District
- NCES district ID
- 3416380
- Math proficiency
- 15% ▼ -19.00%
- Reading proficiency
- 36% ▼ -19.00%
- Median HH income
- $41,210
- Composite
- 21.55/100
- National rank
- #8312
- State rank
- #399 of 472 in NJ
Livability — Union City
- Score
- 77/100
- State rank
- #117
- US rank
- #2998
Category grades
Schools grade is shown separately in the Schools card above.
Census & demographics
- Census place
- Union City, NJ
- County
- Hudson County · 718,323 people
- City population
- 66,463
- Metro
- New York-Newark-Jersey City, NY-NJ-PA
- Population (ZIP)
- 66,463
- Household income
- $64,310
- Rent vs Own
- Severe rent burden
- 6042.0
Population outlook (Hudson County) Hauer SSP2
- Today (2025)
- 771,834 people
- By 2030
- 818,028 · +6.0%
- By 2040
- 907,866 · +17.6%
- By 2050
- 994,480 · +28.8%
- By 2075
- 1,163,301 · +50.7%
- By 2100
- 1,254,703 · +62.6%
Race, ethnicity, and origin ACS 2023
- Neighborhood character
- Predominantly Hispanic (82%)
- Race & ethnicity
- Hispanic / Latino 82% Two or more races 28% White 10% Asian 4% Black 3% Native American 2%
- Hispanic origin (detail)
- Mexican 7% Puerto Rican 8% Cuban 9% Dominican 17%
- Foreign-born
- 55% · Canada, Jamaica, China
- Languages at home
- 18% English-only · Spanish 74% Other Indo-European 2% Arabic 1%
Political lean MEDSL · Hudson
- 2024 margin
- Strong D (+28.1) · D 62.6% · R 34.6% · Other 2.8%
- 2008→2024 swing
- -18.7pp toward R · 2008: 46.7pp · 2024: 28.1pp
- All cycles
- 2024: D+28.1 2020: D+46.2 2016: D+51.8 2012: D+55.7 2008: D+46.7
Not yet ingested
- Civics
- —
Market trends
- HPI YoY
- ▲ 52.10%
- Current HPI
- 597.8126
- Rent YoY
- ▲ 0.89%
- Metro
- New York-Newark-Jersey City, NY-NJ-PA
- State GDP YoY
- ▲ 2.05%
- F500 in state
- 34
Industry mix (Fortune 500 HQ in NJ)
| Industry | F500 HQs | Revenue |
|---|---|---|
| Consumer Goods | 3 | $31B |
|
||
| Pharmaceuticals | 2 | $153B |
|
||
| Technology | 2 | $21B |
|
||
| Insurance | 2 | $20B |
|
||
| Healthcare | 2 | $19B |
|
||
| Financial Services | 1 | $70B |
|
||
Price history
2 events — show timeline
- 2026-06-04 Pending — HCMLS
- 2026-05-04 Listed $729,000 HCMLS
Property tax history
+2.0%/yrLatest (2025): $12,711 · +2.2% YoY. Source: county tax records.
Cash-flow waterfall
monthlySold comps — $/sqft
last 12 mo · ≤1 miLoading sold comps…