 Duplex
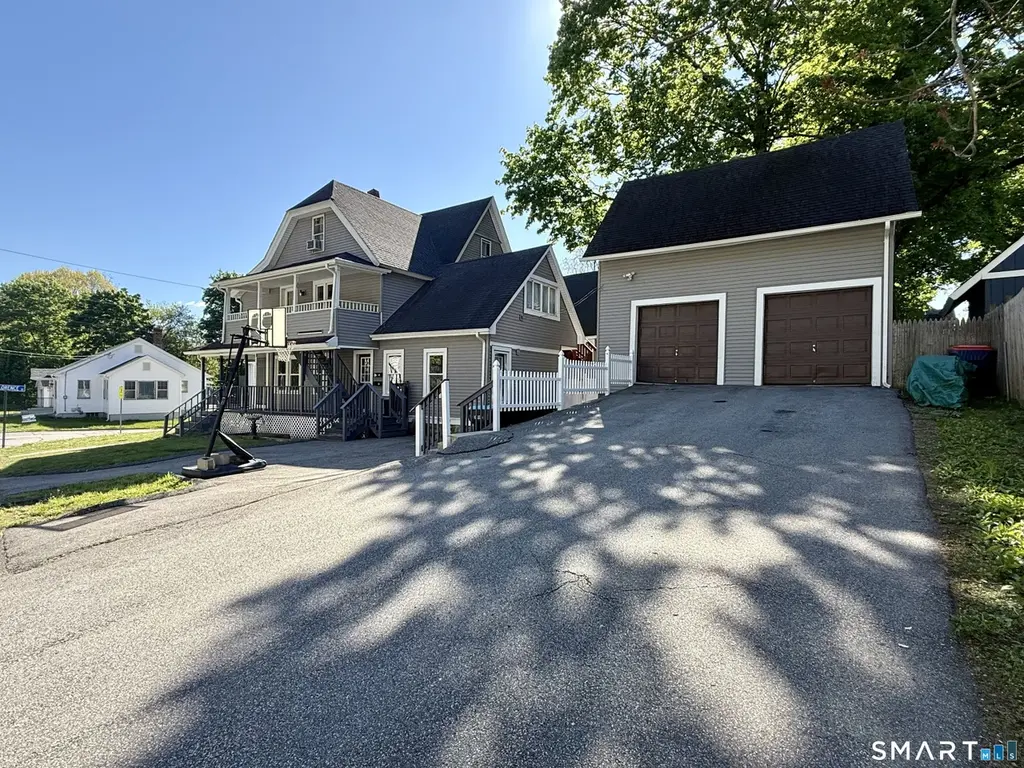
25-27 Farrows St · Putnam, CT
Flood risk 1/10 · Minimal
- FEMA flood zone
- X (unshaded)
- Chance of flooding over 30 yrs
- 0.0%
- Est. flood insurance / yr
- $473 – $860
Fire risk 2/10 · Minimal
- Est. fire insurance / yr
- $829 – $1,539
Heat risk 4/10 · Minor
- Hot days now (above 95°F)
- 7 days/yr
- Hot days in 30 yrs
- 15 days/yr
Wind risk 6/10 · Moderate
- Chance of severe wind over 30 yrs
- 56.0%
Air-quality risk 2/10 · Minimal
- Unhealthy air days now
- 2 days/yr
- Unhealthy air days in 30 yrs
- 2 days/yr
Risk factors via First Street. Map © Google.
Why this score? — see what drove the D grade
The composite is a weighted blend of 9 inputs, each scored 0–100. Each bar is that input's sub-score; the figure is the points it added to the 100-point composite (weight × sub-score).
- Cash flow +16.6/30.0
- DSCR +5.2/10.0
- ARV discount +5.1/15.0
- 1% rule +4.5/10.0
- Condition / age +3.8/5.0
- Livability +3.3/5.0
- Schools +2.6/10.0
- Rent growth +2.5/5.0
- Appreciation +0.0/10.0
$349,900
🖨 Deal sheet (PDF) 📄 Offer letter ✓ Due diligence
Multi-family units
County records classify this as Multi-Family (2-4 Unit). Listing-text estimate: 2 units. confirmed
Listing remarks
OFFER DEADLINE: 5/18/26 @ 4pm. Turnkey investment opportunity in the heart of Putnam! This well-maintained two-family property at 25-27 Farrows Street is ideal for both owner-occupants and savvy investors looking to build long-term equity. Each unit offers comfortable layouts with spacious living areas, generous bedrooms, and plenty of natural light throughout. Recent updates and solid mechanicals help minimize maintenance, while separate utilities provide convenience and efficiency for both units. The attic is finished and the sellers are working with the town to update the record. The property also features off-street parking and a manageable yard, adding to its tenant appeal. Located jus
Key facts
- 6,969 sq ft lot
- 2 garage spots
- Built 1890
Property features AI
Finance
- Financial info: Assessed value listed
Exterior
- Parking: Detached garage; 2-car garage
- Utilities: Public water connected; Public sewer connected; Fuel tank located in basement
- Home design: Multi-family (2-family); Multi-story configuration
- Construction: Frame construction; Brick and stone foundation; Asphalt shingle roof
- Exterior features: Porch; Deck; Corner lot; Vinyl siding; Grey exterior color
Interior
- Bedrooms: 7 bedrooms (total)
- Bathrooms: 3 full bathrooms; 1 half bathroom
- Heating & cooling: Steam heat; Hot water options: natural gas, oil, tankless hot water, 40-gallon tank
- Interior features: Full basement; Total of 15 rooms (multi-family property)
Neighborhood map
What this means for you Summary
Snapshot
- This is a 2 × 4-bed/1.8-bath units multifamily listed at $350k. Condition is rated good.
Deal economics
- At list price, monthly cash flow is $211 ($3k/yr) — positive. Per door: $106/mo.
- The deal already cash-flows at list — no discount required.
- To meet the 1% rule (rent ≥ 1% of price), the offer needs to be $333k (4.9% below list).
- Recommended offer: $333k (4.9% below list) — sets the bar for 1% rule.
- Cap rate 7.0% vs local median 3.2% in Putnam — top-decile yield for the area; either an underpriced asset or a hidden risk that comps aren't pricing in. Stress-test before assuming the spread holds.
Location & tenants
- Location reads 66/100 on livability (#117 in CT) — a middle-class / working-renter tenant base. Strengths: crime A+, housing A+, cost of living A; Watch: health & safety D+, schools D-, amenities F.
- Putnam School District (suburban): math 25% / reading 34% proficiency, ranked #126 of 153 in CT (top 82%) — low school quality limits family demand, transient renter base, plan for 1-2y turnover.
- Market conditions: 59 active listings in the ZIP; 1 comparable units currently listed for rent nearby; 149 units permitted in Northeastern Connecticut Planning Region in 2024 (0 in 5+ unit buildings).
Forward outlook
- Local home prices are declining (-3.0%/yr); year-one equity from $2k of loan paydown is wiped out by about $10k of value loss. Plan a longer hold.
Negotiation context
- Only 7 days on market — expect competitive offers; lowballing is unlikely to land.
- 2 sale attempts with the ask held roughly flat each time — persistent listings suggest the price (not the market) is what's stuck; bring a comps-based counter.
Risks & watch-outs
- Watch-outs: built in 1890 — expect roof / HVAC / electrical / plumbing capex.
- Climate carrying-cost: major wind risk, 56% chance of damaging wind over 30y — expect insurance premiums to compound above CPI over the hold.
Questions for the listing agent
- Can we see the unit-by-unit rent roll, current vacancy, and any below-market leases? What's the average tenancy length?
- What capital expenditures (roof, boiler, parking lot, exteriors) have been made in the last 5 years, and what's planned in the next 2?
- Built in 1890 — when were the roof, HVAC, electrical panel, plumbing, and water heater last replaced?
- Is there a deadline driving the sale (1031 exchange, divorce, estate, relocation)? That informs how much negotiation room exists.
- Schools are D-rated, which usually means shorter tenancies and higher turnover. Who's the typical renter profile here, and what's been the actual vacancy rate?
- The area grade is low — what's the realistic commute time and amenity access for the typical tenant pool here? Any planned neighborhood developments (good or bad) we should know about?
- What's the average days-on-market for RENTAL listings here right now (not sales)? A rising rental-DOM trend means longer vacancies and softer asking-rent achievability than the comps imply.
- What's the recent tenant-quality profile in this submarket — average credit score on applications, eviction rate, late-payment / NSF rate, and stable-employment percentage? A property-management company in the area should have these aggregated.
- How much new apartment / multifamily construction is in the pipeline within 1–3 miles? Heavy new supply (>2% of stock underway) typically softens rents 12–24 months out; light construction supports rent growth.
Investment metrics
- 1% rule
- 0.95% ✗
- Cap rate
- 7.02%
- Cash-on-cash
- 2.58%
- DSCR
- 1.12
- GRM
- 8.8
CMA / ARV
- ARV (median comp)
- $331,990
- List price
- $349,900
- Delta
- 5.39%
- Verdict
- FAIR
- Comps
- 20 within 1.0 mi
Show comp detail 1 sale within ~0.75 mi
| Address | Dist | Beds/Ba | Sqft | Sold | Price | $/sf | Match |
|---|---|---|---|---|---|---|---|
| 13 Mohegan St | 0.66mi | 7/3.5 (-1) | 2,354 (+10%) | 2mo | $355,000 | $151 | 46 |
Match score weights: distance 35% · size 25% · config 20% · recency 20%. Top-matched comps best support the ARV.
Projected returns pro-forma
-3.0% appreciation · 3.0% rent growth · sell at horizon
- IRR
- -12.2%
- Equity multiple
- 0.56×
- Total profit
- $-43,207
- Equity at exit
- $52,171
- IRR
- -3.1%
- Equity multiple
- 0.79×
- Total profit
- $-20,112
- Equity at exit
- $30,253
Cash invested: $97,972 (down + closing). Projections, not guarantees.
Landlord ↔ Tenant lean methodology
- Overall (STATE)
- 27 Tenant-Leaning
- State Connecticut
- 27 Tenant-Leaning · D+7
- County
- — inherits STATE
- City
- — inherits STATE
ZIP-level market 06260
- Home prices YoY
- -4.3%
- Active inventory
- 59
- Price-to-rent
- 17.5×
Monthly cashflow live
- Estimated rent
- $3,328 medium interval (Pro) →
- Mortgage (P&I)
- −$1,835
- Tax est. 1.5%
- −$437 /mo · $5,248/yr
- Insurance
- −$146
- HOA
- −$0
- Vacancy / Maint / Mgmt
- −$699
- Net cashflow
- $211
Break-even live
Sensitivity live
| Price | -10% $453 | -5% $332 | +0% $211 | +5% $90 | +10% $-31 |
|---|---|---|---|---|---|
| Rent | -10% $-52 | -5% $80 | +0% $211 | +5% $342 | +10% $474 |
| Rate | -1.0pp $387 | -0.5pp $300 | base $211 | +0.5pp $120 | +1.0pp $28 |
2-unit breakdown (identical units grouped — click to expand)
| Units | Beds | Baths | Est. rent |
|---|---|---|---|
| 2× units | 4 | 1.8 | $3,328 |
| #1 | 4 | 1.8 | $1,664 |
| #2 | 4 | 1.8 | $1,664 |
| Total (2 units) | $3,328 | ||
UW: 25.0% down · 7.5% · 30yr · 1.5% tax · 5.0% vac · 8.0% maint · 8.0% mgmt
Financing live
Cash to close
- Down payment
- $87,475
- Closing costs
- $10,497
- Reserves months
- —
- Total cash needed
- —
Loan-product check · same deal, 3 products live
Conventional
25% down · 7.5% · 30yr
- Down + closing
- —
- Monthly P&I
- —
- Monthly cashflow
- —
- DSCR
- —
- Eligible?
- —
Personal DTI + credit; lowest rate.
DSCR
20% down · 8.5% · 30yr
- Down + closing
- —
- Monthly P&I
- —
- Monthly cashflow
- —
- DSCR
- —
- Eligible?
- —
No personal income docs; deal must DSCR.
Hard money
10% down · 12.0% · 12mo
- Down + closing
- —
- Monthly P&I
- —
- Monthly cashflow
- —
- DSCR
- —
- Eligible?
- —
Short-term bridge; refi at stabilization.
Rent comps 1 comps
| Address | Beds | Baths | Sqft | Rent | $/sqft | DOM | Units | Dist |
|---|---|---|---|---|---|---|---|---|
| 411 School St Putnam, CT | 7.0 | 3.0 | 2074 | $1,500 | $0.72 | 45d | 1 | 0.76mi |
Listing history 6 events
-
2026-05-16$349,900 Active 1142-char remark
-
2026-05-12historical $349,900 1142-char remark
-
2025-07-22historical
-
2025-07-01price $375,000
-
2025-06-11price $385,000
-
2025-04-19$390,000 Active
ⓘ Source: listings_history table (triggers on properties + properties_extension) + one-shot
backfill from property_details.listing_events for pre-trigger history.
Climate risk First Street
- Flood 1/10 Low FEMA zone X (unshaded) · 0% chance over 30 yrs
- Wildfire 2/10 Low
- Heat 4/10 Moderate 7 d/yr ≥95°F today · 15 d/yr by 30 yrs out
- Wind 6/10 Major 56% chance of damaging wind over 30 yrs
- Air quality 2/10 Low 2 unhealthy d/yr today · 2 by 30 yrs out
Nearby sold comps map
Loading sold comps map…
Walkable amenities ~0.75 mi
Loading nearby amenities…
Taxation est. · year 1
- Rental income
- $39,936
- − Mortgage interest
- −$19,600
- − Property taxes
- −$5,248
- − Insurance
- −$1,750
- − Repairs & maintenance
- −$3,195
- − Management
- −$3,195
- − Depreciation
- −$10,179
- Taxable loss
- −$3,231
- Est. tax savings @ 24.0%
- +$775
- After-tax cash flow
- $3,308/yr
For passive investors: Depreciation is non-cash, so a rental often shows a tax loss while cash-flowing — sheltering income. Rental losses are passive: they offset passive income freely, and up to $25,000/yr can offset ordinary (W-2) income if you actively participate and your MAGI is under $100k (phasing out to $0 by $150k); unused losses carry forward. On sale, claimed depreciation is recaptured at up to 25%, and gains may owe capital-gains tax (a 1031 exchange can defer both). Figures are a year-1 estimate at your 24.0% rate — not tax advice; consult a CPA.
Condition & rehab AI · 12 photos
This well-maintained two-family property offers comfortable layouts and recent updates, making it an attractive investment opportunity.
Value-add opportunities
- Both Paint exterior — Enhances curb appeal and value
- Both Replace gutters — Improves drainage and reduces maintenance costs
Renovation cost estimate screening
Value-add ROI direction
- Both Paint exterior — Enhances curb appeal and value ↑
- Both Replace gutters — Improves drainage and reduces maintenance costs ↑
ⓘ Cost ranges are severity-bucket heuristics (US national rule-of-thumb). Get contractor quotes + a written scope before underwriting a rehab budget.
Schools (NCES district)
- District
- Putnam School District
- NCES district ID
- 0903480
- Math proficiency
- 25% ▼ -12.00%
- Reading proficiency
- 34% ▼ -19.00%
- Median HH income
- $51,031
- Composite
- 25.85/100
- National rank
- #7349
- State rank
- #126 of 153 in CT
Livability — Putnam
- Score
- 66/100
- State rank
- #117
- US rank
- #11486
Category grades
Schools grade is shown separately in the Schools card above.
Census & demographics
- Census place
- Putnam, CT
- Population (ZIP)
- 9,227
Population outlook (Northeastern Connecticut County) Hauer SSP2
- By 2040
- 104,160
Race, ethnicity, and origin ACS 2023
- Neighborhood character
- Predominantly White (84%)
- Race & ethnicity
- White 84% Hispanic / Latino 7% Two or more races 6% Black 2% Asian 1%
- Hispanic origin (detail)
- Puerto Rican 4%
- Common ancestry
- Lithuanian 18% Romanian 5% Scotch-Irish 1%
- Foreign-born
- 4% · Canada, South Korea
- Languages at home
- 94% English-only · Spanish 4% Russian/Polish/Slavic 1% French/Haitian/Cajun 1%
Political lean MEDSL · Northeastern Connecticut
- 2024 margin
- R (+15.4) · D 41.5% · R 57.0% · Other 1.5%
- All cycles
- 2024: R+15.4
Not yet ingested
- Civics
- —
Market trends
- HPI YoY
- ▼ -14.95%
- Current HPI
- 332.9661
- Rent YoY
- —
- Metro
- —
- State GDP YoY
- ▲ 1.06%
- F500 in state
- 38
Industry mix (Fortune 500 HQ in CT)
| Industry | F500 HQs | Revenue |
|---|---|---|
| Industrial Machinery | 4 | $38B |
|
||
| Insurance | 3 | $71B |
|
||
| Financial Services | 2 | $25B |
|
||
| Transportation / Logistics | 2 | $18B |
|
||
| Healthcare | 1 | $247B |
|
||
| Telecommunications | 1 | $55B |
|
||
Price history
-10.3% since first listed7 events — show timeline
- 2026-05-23 Pending — Smart MLS
- 2026-05-16 Listed $349,900 Smart MLS
- 2026-05-12 Coming Soon $349,900 Smart MLS
- 2025-07-22 Listing Removed — Smart MLS
- 2025-07-01 Price Changed $375,000 Smart MLS
- 2025-06-11 Price Changed $385,000 Smart MLS
- 2025-04-19 Listed $390,000 Smart MLS
Cash-flow waterfall
monthlySold comps — $/sqft
last 12 mo · ≤1 miLoading sold comps…