 Multi-family
1 E Main St · New Lebanon, OH
Flood risk 1/10 · Minimal
- FEMA flood zone
- X (unshaded)
- Chance of flooding over 30 yrs
- 0.0%
- Est. flood insurance / yr
- $473 – $860
Fire risk 1/10 · Minimal
- Est. fire insurance / yr
- $713 – $1,323
Heat risk 4/10 · Minor
- Hot days now (above 101°F)
- 7 days/yr
- Hot days in 30 yrs
- 19 days/yr
Wind risk 2/10 · Minimal
- Chance of severe wind over 30 yrs
- 0.0%
Air-quality risk 2/10 · Minimal
- Unhealthy air days now
- 1 days/yr
- Unhealthy air days in 30 yrs
- 2 days/yr
Risk factors via First Street. Map © Google.
Why this score? — see what drove the C- grade
The composite is a weighted blend of 9 inputs, each scored 0–100. Each bar is that input's sub-score; the figure is the points it added to the 100-point composite (weight × sub-score).
- Cash flow +15.7/30.0
- Appreciation +10.0/10.0
- ARV discount +7.5/15.0
- DSCR +4.8/10.0
- 1% rule +4.3/10.0
- Schools +4.2/10.0
- Livability +3.5/5.0
- Rent growth +2.5/5.0
- Condition / age +2.2/5.0
$215,000
🖨 Deal sheet (PDF) 📄 Offer letter ✓ Due diligence
Multi-family units
County records classify this as Multi-Family (2-4 Unit). Listing-text estimate: 1 unit. estimate disagrees with records
Listing remarks
FOR SALE BY OWNER $215,000 2 N Church St, New Lebanon, OH 45345 Large property with endless potential! This spacious home can be used as a duplex/income property or a large single-family home. Great opportunity for an investor, multi-generational living, or someone looking for a property with flexible space and character. Features: Approx. 1,760 sq ft Flexible 4-5 bedroom layout 2+ bathrooms Basement New roof installed in 2020 Corner lot Duplex or single-family home potential Spacious rooms and older home charm Home is being sold AS-IS and does need repairs and updates, but offers strong potential for the right buyer. Lot size approximately 0.18 acres. New Lebanon
Key facts
- New roof installed
- Corner lot
- 4,356 sq ft lot
Tags
Property features AI
Exterior
- Home design: Multi-family property
- Construction: About 1,700 square feet of living space
- Exterior features: Lot approximately 0.1 acre
Neighborhood map
What this means for you Summary
Snapshot
- This is a 5-bed/3.0-bath multifamily listed at $215k. Condition is rated fair.
Deal economics
- At list price, monthly cash flow is $94 ($1k/yr) — positive.
- The deal already cash-flows at list — no discount required.
- To meet the 1% rule (rent ≥ 1% of price), the offer needs to be $200k (7.0% below list).
- Recommended offer: $200k (7.0% below list) — sets the bar for 1% rule.
Location & tenants
- Location reads 70/100 on livability (#450 in OH) — a middle-class / working-renter tenant base. Strengths: cost of living A+, housing A+, crime A; Watch: employment C-, amenities F, commute F.
- New Lebanon Local (town): math 43% / reading 56% proficiency, ranked #448 of 656 in OH (top 68%) — families likely to look elsewhere, expect single-tenant / working-renter base with shorter leases.
- Market conditions: 20 active listings in the ZIP; 2 comparable units currently listed for rent nearby; solid renter incomes; 907 units permitted in Montgomery County in 2024 (416 in 5+ unit buildings).
- This rent runs 31% of the median local income ($77k/yr) — at the standard rent-burdened threshold; future hikes will face affordability resistance.
Forward outlook
- In year one you build about $23k of equity ($1k loan paydown + $22k appreciation (10.0% local appreciation)).
- Montgomery County population projected at -10% by 2050 — secular population decline; favor cash flow + early exit over multi-decade hold.
- At projected returns (10.0% appreciation + 3.0% rent growth), your $60k cash investment doubles in ~3 years — after that, you're playing with house money.
- By year 2, paydown + projected appreciation supports a ~$37k cash-out refi (75% LTV) — recoverable capital for the next deal without selling this one.
Negotiation context
- It's been on market 17 days — a 2% lower offer ($212k) is reasonable based on typical stale-listing flexibility.
Risks & watch-outs
- Watch-outs: built in 1909 — expect roof / HVAC / electrical / plumbing capex.
Questions for the listing agent
- Have any recent inspections been done? Can we get a copy of the seller's disclosures and any deferred-maintenance estimates?
- Built in 1909 — when were the roof, HVAC, electrical panel, plumbing, and water heater last replaced?
- Is there a deadline driving the sale (1031 exchange, divorce, estate, relocation)? That informs how much negotiation room exists.
- Schools are B-rated — typically a magnet for longer-tenancy family renters. What's the average tenant stay here, and is there a school-zone premium baked into asking?
- What's the average days-on-market for RENTAL listings here right now (not sales)? A rising rental-DOM trend means longer vacancies and softer asking-rent achievability than the comps imply.
- What's the recent tenant-quality profile in this submarket — average credit score on applications, eviction rate, late-payment / NSF rate, and stable-employment percentage? A property-management company in the area should have these aggregated.
- How much new apartment / multifamily construction is in the pipeline within 1–3 miles? Heavy new supply (>2% of stock underway) typically softens rents 12–24 months out; light construction supports rent growth.
Investment metrics
- 1% rule
- 0.93% ✗
- Cap rate
- 6.82%
- Cash-on-cash
- 1.88%
- DSCR
- 1.08
- GRM
- 9.0
CMA / ARV
No comps found within radius.
Projected returns pro-forma
10.0% appreciation · 3.0% rent growth · sell at horizon
- IRR
- 25.6%
- Equity multiple
- 3.05×
- Total profit
- $123,123
- Equity at exit
- $193,689
- IRR
- 22.6%
- Equity multiple
- 6.95×
- Total profit
- $357,921
- Equity at exit
- $417,698
Cash invested: $60,200 (down + closing). Projections, not guarantees.
Landlord ↔ Tenant lean methodology
- Overall (STATE)
- 73 Landlord-Friendly
- State Ohio
- 73 Landlord-Friendly · R+6
- County
- — inherits STATE
- City
- — inherits STATE
ZIP-level market 45345
- Home prices YoY
- 8.0%
- Active inventory
- 20
- Price-to-rent
- 17.9×
Monthly cashflow live
- Estimated rent
- $2,000 medium interval (Pro) →
- Mortgage (P&I)
- −$1,127
- Tax est. 1.5%
- −$269 /mo · $3,225/yr
- Insurance
- −$90
- HOA
- −$0
- Vacancy / Maint / Mgmt
- −$420
- Net cashflow
- $94
Break-even live
Sensitivity live
| Price | -10% $243 | -5% $168 | +0% $94 | +5% $20 | +10% $-54 |
|---|---|---|---|---|---|
| Rent | -10% $-64 | -5% $15 | +0% $94 | +5% $173 | +10% $252 |
| Rate | -1.0pp $202 | -0.5pp $149 | base $94 | +0.5pp $38 | +1.0pp $-18 |
2-unit breakdown (identical units grouped — click to expand)
| Units | Beds | Baths | Est. rent |
|---|---|---|---|
| 2× units | 2 | 1 | $2,000 |
| #1 | 2 | 1 | $1,000 |
| #2 | 2 | 1 | $1,000 |
| Total (2 units) | $2,000 | ||
UW: 25.0% down · 7.5% · 30yr · 1.5% tax · 5.0% vac · 8.0% maint · 8.0% mgmt
Financing live
Cash to close
- Down payment
- $53,750
- Closing costs
- $6,450
- Reserves months
- —
- Total cash needed
- —
Loan-product check · same deal, 3 products live
Conventional
25% down · 7.5% · 30yr
- Down + closing
- —
- Monthly P&I
- —
- Monthly cashflow
- —
- DSCR
- —
- Eligible?
- —
Personal DTI + credit; lowest rate.
DSCR
20% down · 8.5% · 30yr
- Down + closing
- —
- Monthly P&I
- —
- Monthly cashflow
- —
- DSCR
- —
- Eligible?
- —
No personal income docs; deal must DSCR.
Hard money
10% down · 12.0% · 12mo
- Down + closing
- —
- Monthly P&I
- —
- Monthly cashflow
- —
- DSCR
- —
- Eligible?
- —
Short-term bridge; refi at stabilization.
Rent comps 2 comps
| Address | Beds | Baths | Sqft | Rent | $/sqft | DOM | Units | Dist |
|---|---|---|---|---|---|---|---|---|
| 570 Holderman Pl New Lebanon, OH | 4.0 | 3.0 | 2007 | $2,200 | $1.10 | 3d | 1 | 0.67mi |
| 575 Holderman Pl New Lebanon, OH | 4.0 | 3.0 | 2007 | $2,200 | $1.10 | 3d | 1 | 0.69mi |
Listing history 12 events
-
2026-06-21days on market $215,000 Active 17 DOM
-
2026-06-18days on market $215,000 Active 14 DOM
-
2026-06-17days on market $215,000 Active 13 DOM
-
2026-06-16days on market $215,000 Active 12 DOM
-
2026-06-15days on market $215,000 Active 11 DOM
-
2026-06-14days on market $215,000 Active 9 DOM
-
2026-06-10days on market $215,000 Active 6 DOM
-
2026-06-09days on market $215,000 Active 5 DOM
-
2026-06-08days on market $215,000 Active 4 DOM
-
2026-06-07days on market $215,000 Active 3 DOM
-
2026-06-05remarks 699-char remark
-
2026-06-05$215,000 Active 1 DOM
ⓘ Source: listings_history table (triggers on properties + properties_extension) + one-shot
backfill from property_details.listing_events for pre-trigger history.
Climate risk First Street
- Flood 1/10 Low FEMA zone X (unshaded) · 0% chance over 30 yrs
- Wildfire 1/10 Low
- Heat 4/10 Moderate 7 d/yr ≥101°F today · 19 d/yr by 30 yrs out
- Wind 2/10 Low 0% chance of damaging wind over 30 yrs
- Air quality 2/10 Low 1 unhealthy d/yr today · 2 by 30 yrs out
Nearby sold comps map
Loading sold comps map…
Walkable amenities ~0.75 mi
Loading nearby amenities…
Taxation est. · year 1
- Rental income
- $24,000
- − Mortgage interest
- −$12,043
- − Property taxes
- −$3,225
- − Insurance
- −$1,075
- − Repairs & maintenance
- −$1,920
- − Management
- −$1,920
- − Depreciation
- −$6,255
- Taxable loss
- −$2,438
- Est. tax savings @ 24.0%
- +$585
- After-tax cash flow
- $1,715/yr
For passive investors: Depreciation is non-cash, so a rental often shows a tax loss while cash-flowing — sheltering income. Rental losses are passive: they offset passive income freely, and up to $25,000/yr can offset ordinary (W-2) income if you actively participate and your MAGI is under $100k (phasing out to $0 by $150k); unused losses carry forward. On sale, claimed depreciation is recaptured at up to 25%, and gains may owe capital-gains tax (a 1031 exchange can defer both). Figures are a year-1 estimate at your 24.0% rate — not tax advice; consult a CPA.
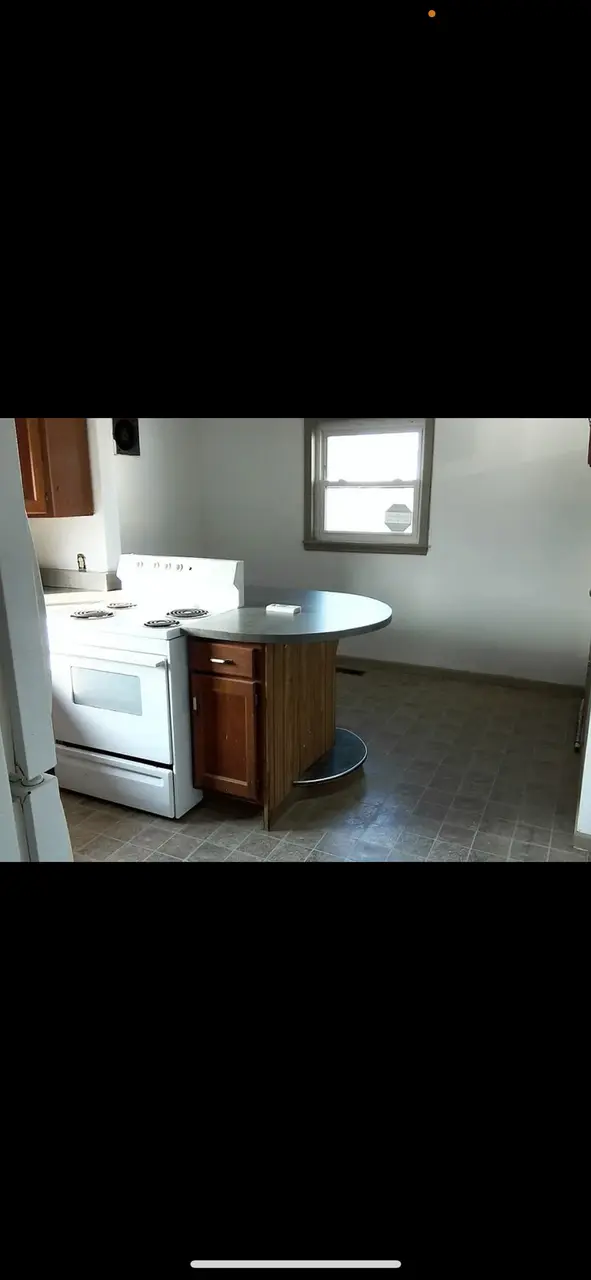
Condition & rehab AI · 9 photos
This multi-family property requires a moderate level of renovation, including kitchen and bathroom updates, and landscaping improvements. The home has potential for increased value through these upgrades.
Repairs flagged
- Major Kitchen appliances — The kitchen appliances are outdated and in need of replacement.
- Major Bathroom fixtures — The bathroom fixtures are outdated and in need of replacement.
- Major Flooring — The flooring in the kitchen and bathrooms is outdated and in need of replacement.
- Major Paint — The paint on the interior walls and ceilings is peeling and in need of a fresh coat.
- Major Landscaping — The landscaping is minimal and in need of maintenance.
Value-add opportunities
- Both Kitchen renovation — A new kitchen with updated appliances and cabinetry would significantly increase the home's value for both resale and rental.
- Both Bathroom renovation — Upgrading the bathrooms with new fixtures and tile would improve the home's appeal and increase its value for both resale and rental.
- Both Landscaping — A well-maintained and landscaped yard would improve the home's curb appeal and increase its value for both resale and rental.
Renovation cost estimate screening
| Repair item | Severity | Est. cost |
|---|---|---|
| Kitchen appliances · The kitchen appliances are outdated and in need of replacement. | Major | $15,000–50,000 |
| Bathroom fixtures · The bathroom fixtures are outdated and in need of replacement. | Major | $15,000–50,000 |
| Flooring · The flooring in the kitchen and bathrooms is outdated and in need of replacement. | Major | $15,000–50,000 |
| Paint · The paint on the interior walls and ceilings is peeling and in need of a fresh coat. | Major | $15,000–50,000 |
| Landscaping · The landscaping is minimal and in need of maintenance. | Major | $15,000–50,000 |
| Total estimated repair cost · 5 items | $75,000–250,000 |
Value-add ROI direction
- Both Kitchen renovation — A new kitchen with updated appliances and cabinetry would significantly increase the home's value for both resale and rental. ↑
- Both Bathroom renovation — Upgrading the bathrooms with new fixtures and tile would improve the home's appeal and increase its value for both resale and rental. ↑
- Both Landscaping — A well-maintained and landscaped yard would improve the home's curb appeal and increase its value for both resale and rental. ↑
ⓘ Cost ranges are severity-bucket heuristics (US national rule-of-thumb). Get contractor quotes + a written scope before underwriting a rehab budget.
Schools (NCES district)
- District
- New Lebanon Local
- NCES district ID
- 3904871
- Math proficiency
- 43% ▼ -19.00%
- Reading proficiency
- 56% ▼ -7.00%
- Median HH income
- $45,363
- Composite
- 41.88/100
- National rank
- #3369
- State rank
- #448 of 656 in OH
Livability — New Lebanon
- Score
- 70/100
- State rank
- #450
- US rank
- #7342
Category grades
Schools grade is shown separately in the Schools card above.
Census & demographics
- Census place
- New Lebanon, OH
- County
- Montgomery · 506,435 people
- City population
- 5,923
- Metro
- Dayton-Kettering-Beavercreek, OH
- Population (ZIP)
- 5,923
- Household income
- $77,279
- Rent vs Own
- Severe rent burden
- 8.9
Population outlook (Montgomery County) Hauer SSP2
- Today (2025)
- 523,241 people
- By 2030
- 514,948 · -1.6%
- By 2040
- 493,378 · -5.7%
- By 2050
- 469,639 · -10.2%
- By 2075
- 418,360 · -20.0%
- By 2100
- 353,315 · -32.5%
Race, ethnicity, and origin ACS 2023
- Neighborhood character
- Predominantly White (92%)
- Race & ethnicity
- White 92% Two or more races 6% Black 2%
- Common ancestry
- Romanian 3% Slovak 1% Scottish 1%
- Foreign-born
- 0% · China
- Languages at home
- 98% English-only · Spanish 1% German/W. Germanic 1%
Political lean MEDSL · Montgomery
- 2024 margin
- Toss-up / Even · D 49.8% · R 49.3%
- 2008→2024 swing
- -5.8pp toward R · 2008: 6.2pp · 2024: 0.5pp
- All cycles
- 2024: D+0.5 2020: D+2.2 2016: R+1.2 2012: D+3.1 2008: D+6.2
Not yet ingested
- Civics
- —
Market trends
- HPI YoY
- ▲ 27.56%
- Current HPI
- 370.29
- Rent YoY
- —
- Metro
- —
- State GDP YoY
- ▲ 1.98%
- F500 in state
- 48
Industry mix (Fortune 500 HQ in OH)
| Industry | F500 HQs | Revenue |
|---|---|---|
| Insurance | 3 | $145B |
|
||
| Industrial Machinery | 3 | $49B |
|
||
| Financial Services | 3 | $24B |
|
||
| Consumer Goods | 2 | $93B |
|
||
| Aerospace / Defense | 2 | $47B |
|
||
| Utilities | 2 | $33B |
|
||
Price history
1 event — show timeline
- 2026-06-04 Listed $215,000 ForSaleByOwner.com
Cash-flow waterfall
monthlySold comps — $/sqft
last 12 mo · ≤1 miLoading sold comps…