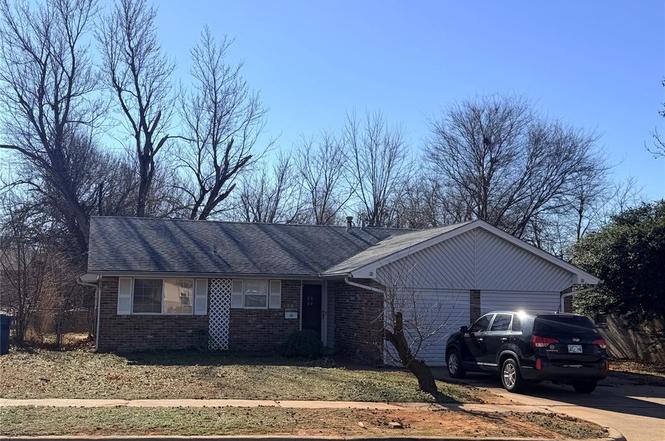
1008 Royal Way · Edmond, OK
Flood risk 1/10 · Minimal
- FEMA flood zone
- X (unshaded)
- Chance of flooding over 30 yrs
- 0.0%
- Est. flood insurance / yr
- $507 – $1,088
Fire risk 2/10 · Minimal
- Est. fire insurance / yr
- $2,463 – $4,575
Heat risk 6/10 · Moderate
- Hot days now (above 108°F)
- 7 days/yr
- Hot days in 30 yrs
- 19 days/yr
Wind risk 2/10 · Minimal
- Chance of severe wind over 30 yrs
- 3.0%
Air-quality risk 2/10 · Minimal
- Unhealthy air days now
- 2 days/yr
- Unhealthy air days in 30 yrs
- 2 days/yr
Risk factors via First Street. Map © Google.
Why this score? — see what drove the C+ grade
The composite is a weighted blend of 9 inputs, each scored 0–100. Each bar is that input's sub-score; the figure is the points it added to the 100-point composite (weight × sub-score).
- Cash flow +21.8/30.0
- ARV discount +15.0/15.0
- DSCR +7.0/10.0
- 1% rule +5.5/10.0
- Livability +3.9/5.0
- Schools +3.6/10.0
- Rent growth +3.1/5.0
- Condition / age +2.5/5.0
- Appreciation +0.0/10.0
$150,000
🖨 Deal sheet (PDF) 📄 Offer letter ✓ Due diligence
Listing remarks MLS
NEW roof '03, NEW whole house carpet, NEWER windows, blinds, kitchen remodel and spacious custom media room with surround sound. Beautiful private wooded lot with covered back patio and shed. Move in ready. Close to UCO
Key facts
- Functional kitchen
- Two living areas
- Covered patio
Tags
Neighborhood map
What this means for you Summary
Snapshot
- This is a 3-bed/2.0-bath single-family listed at $150k.
Deal economics
- At list price, monthly cash flow is $234 ($3k/yr) — positive.
- The deal already cash-flows at list — no discount required.
- Meets the 1% rule at list price ($2k rent vs $150k).
- Recommended offer: $141k (6.0% below list) — sets the bar for market timing.
- Cap rate 8.2% vs local median 3.4% in Edmond — top-decile yield for the area; either an underpriced asset or a hidden risk that comps aren't pricing in. Stress-test before assuming the spread holds.
Location & tenants
- Location reads 78/100 on livability (#6 in OK, #2,383 nationally) — a middle-class / working-renter tenant base. Strengths: employment A+, housing A+, crime A-; Watch: health & safety C-, commute F.
- Edmond (suburban): math 38% / reading 40% proficiency, ranked #11 of 270 in OK (top 4%) — families likely to look elsewhere, expect single-tenant / working-renter base with shorter leases.
- Zoned schools: Northern Hills Es (math 39% / reading 36%, grade F, #127 of 845 statewide, top 15%, 775 students, 0% FRL); Sequoyah Ms (math 40% / reading 34%, grade F, #17 of 345 statewide, top 6%, 1,006 students, 0% FRL); North Hs (math 47% / reading 57%, grade D+, #1 of 447 statewide, top 0%, 2,555 students, 0% FRL) — zoned schools average 0% FRL vs 22% district-wide (22 pts lower); this property's tenant base skews higher-income than the district average.
- Market conditions: Rents rising (+2.5%/yr); 769 active listings in the ZIP; 37 comparable units currently listed for rent nearby; rentals at typical pace (median 23d on market — plan ~3-4 weeks tenant-placement turnaround); solid renter incomes; 5,365 units permitted in Oklahoma County in 2024 (569 in 5+ unit buildings).
- This rent is only 17% of the median local income ($110k/yr) — well below the 30% rent-burden line; pricing power to push rent on renewal without tenant pushback.
Forward outlook
- Local home prices are declining (-3.0%/yr); year-one equity from $1k of loan paydown is wiped out by about $4k of value loss. Plan a longer hold.
- Oklahoma County population projected at +41% by 2050 — long-run rental-demand tailwind backs the buy-and-hold thesis.
Negotiation context
- It's been on market 78 days — a 6% lower offer ($141k) is reasonable based on typical stale-listing flexibility.
- 2 sale attempts since 17y ago with the ask held roughly flat each time — persistent listings suggest the price (not the market) is what's stuck; bring a comps-based counter.
- Current owner paid $112k; 33% above their basis — modest negotiation headroom, anchor on the comps not their cost.
Risks & watch-outs
- Climate carrying-cost: extreme-heat days projected 7→19/yr by 2055 (HVAC capex compounding) — expect insurance premiums to compound above CPI over the hold.
Questions for the listing agent
- It's been on market 78 days. Have you received any prior offers? Is the seller open to a 6% concession, seller financing, or rate buy-down credit?
- Built in 1966 — when were the roof, HVAC, electrical panel, plumbing, and water heater last replaced?
- Why hasn't it sold? Are there any deal-killer items the seller is aware of (foundation, flood, title, zoning, code violations)?
- Is there a deadline driving the sale (1031 exchange, divorce, estate, relocation)? That informs how much negotiation room exists.
- Schools are A-rated — typically a magnet for longer-tenancy family renters. What's the average tenant stay here, and is there a school-zone premium baked into asking?
- What's the average days-on-market for RENTAL listings here right now (not sales)? A rising rental-DOM trend means longer vacancies and softer asking-rent achievability than the comps imply.
- What's the recent tenant-quality profile in this submarket — average credit score on applications, eviction rate, late-payment / NSF rate, and stable-employment percentage? A property-management company in the area should have these aggregated.
- How much new for-sale + rental construction is in the pipeline within 1–3 miles? Heavy new supply typically softens prices + rents 12–24 months out; constrained supply supports both.
Investment metrics
- 1% rule
- 1.05% ✓
- Cap rate
- 8.17%
- Cash-on-cash
- 6.69%
- DSCR
- 1.30
- GRM
- 7.9
CMA / ARV
- ARV (on-the-fly)
- $196,328
- Comps found
- 2
Show comp detail 2 sales within ~0.75 mi
| Address | Dist | Beds/Ba | Sqft | Sold | Price | $/sf | Match |
|---|---|---|---|---|---|---|---|
| 100 N Blackwelder Ave | 0.72mi | 3/2.0 | 1,144 (+7%) | 19mo | $189,000 | $165 | 39 |
| 97 E Colcord Ave | 0.74mi | 3/1.0 | 1,140 (+7%) | 21mo | $210,000 | $184 | 32 |
Match score weights: distance 35% · size 25% · config 20% · recency 20%. Top-matched comps best support the ARV.
Projected returns pro-forma
-3.0% appreciation · 2.49% rent growth · sell at horizon
- IRR
- -6.6%
- Equity multiple
- 0.76×
- Total profit
- $-10,180
- Equity at exit
- $22,365
- IRR
- 2.4%
- Equity multiple
- 1.17×
- Total profit
- $7,116
- Equity at exit
- $12,969
Cash invested: $42,000 (down + closing). Projections, not guarantees.
Landlord ↔ Tenant lean methodology
- Overall (STATE)
- 83 Strongly Landlord-Friendly
- State Oklahoma
- 83 Strongly Landlord-Friendly · R+20
- County
- — inherits STATE
- City
- — inherits STATE
ZIP-level market 73034
- Rents YoY
- 2.5%
- Active inventory
- 769
- Price-to-rent
- 7.9×
Monthly cashflow live
- Estimated rent
- $1,577 high interval (Pro) →
- Mortgage (P&I)
- −$787
- Tax from tax record
- −$162 /mo · $1,949/yr
- Insurance
- −$62
- HOA
- −$0
- Vacancy / Maint / Mgmt
- −$331
- Net cashflow
- $234
Break-even live
Sensitivity live
| Price | -10% $319 | -5% $277 | +0% $234 | +5% $192 | +10% $149 |
|---|---|---|---|---|---|
| Rent | -10% $110 | -5% $172 | +0% $234 | +5% $297 | +10% $359 |
| Rate | -1.0pp $310 | -0.5pp $272 | base $234 | +0.5pp $195 | +1.0pp $156 |
UW: 25.0% down · 7.5% · 30yr · 1.5% tax · 5.0% vac · 8.0% maint · 8.0% mgmt
Financing live
Cash to close
- Down payment
- $37,500
- Closing costs
- $4,500
- Reserves months
- —
- Total cash needed
- —
Loan-product check · same deal, 3 products live
Conventional
25% down · 7.5% · 30yr
- Down + closing
- —
- Monthly P&I
- —
- Monthly cashflow
- —
- DSCR
- —
- Eligible?
- —
Personal DTI + credit; lowest rate.
DSCR
20% down · 8.5% · 30yr
- Down + closing
- —
- Monthly P&I
- —
- Monthly cashflow
- —
- DSCR
- —
- Eligible?
- —
No personal income docs; deal must DSCR.
Hard money
10% down · 12.0% · 12mo
- Down + closing
- —
- Monthly P&I
- —
- Monthly cashflow
- —
- DSCR
- —
- Eligible?
- —
Short-term bridge; refi at stabilization.
Rent comps 37 comps
| Address | Beds | Baths | Sqft | Rent | $/sqft | DOM | Units | Dist |
|---|---|---|---|---|---|---|---|---|
| 800 Chowning Ave Edmond, OK | 2.0 | 2.0 | 1008 | $1,129 | $1.12 | 5d | 1 | 0.25mi |
| 225 N Smythe Ave Edmond, OK | 2.0 | 1.0 | 960 | $1,200 | $1.25 | 25d | 1 | 0.61mi |
| 1015 E Hurd St Unit 2 Edmond, OK | 2.0 | 1.0 | 700 | $995 | $1.42 | 25d | 1 | 0.70mi |
| 301 N University Dr Unit 12 Edmond, OK | 2.0 | 1.0 | 990 | $1,000 | $1.01 | 16d | 1 | 0.71mi |
| 504 N Boulevard Edmond, OK | 3.0 | 2.0 | 1250 | $2,595 | $2.08 | 16d | 1 | 0.72mi |
| 320 E Edwards St Apt 12 Edmond, OK | 2.0 | 1.0 | 927 | $1,100 | $1.19 | 25d | 1 | 0.76mi |
| 1225 E Main St Edmond, OK | 2.0 | 2.5 | 1235 | $1,650 | $1.34 | 25d | 1 | 0.78mi |
| 1010 E Main St Edmond, OK | 2.0 | 1.0 | 1052 | $1,350 | $1.28 | 25d | 1 | 0.80mi |
| 600 N Broadway Edmond, OK | 2.0 | 1.0 | 1062 | $1,325 | $1.25 | 3d | 1 | 0.81mi |
| 1925 Bunting Ct Edmond, OK | 4.0 | 3.0 | 1420 | $2,900 | $2.04 | 25d | 1 | 0.81mi |
| 5 E Thatcher St Edmond, OK | 3.0 | 1.0 | 1144 | $1,550 | $1.35 | 25d | 1 | 0.85mi |
| 1900 Kickingbird Rd Edmond, OK | 1.0–2.0 | 1.0–2.0 | 830 | $1,250 | $1.51 | 3d | 23 | 0.92mi |
| 159 Barrett Pl Edmond, OK | 2.0 | 1.5 | 1175 | $1,175 | $1.00 | 25d | 1 | 0.98mi |
| 128 Ashley Dr Edmond, OK | 3.0 | 2.0 | 1250 | $1,455 | $1.16 | 25d | 1 | 0.98mi |
| 200 Ashley Dr Edmond, OK | 3.0 | 2.0 | 1225 | $1,375 | $1.12 | 25d | 1 | 0.99mi |
| 211 Ashley Dr Edmond, OK | 3.0 | 2.0 | 1250 | $1,440 | $1.15 | 25d | 1 | 1.02mi |
| 1225 Sequoyah Pl Edmond, OK | 2.0 | 1.5 | 1183 | $1,350 | $1.14 | 16d | 1 | 1.03mi |
| 425 Sterling Pointe Way Unit 425 Edmond, OK | 2.0 | 2.0 | 1050 | $1,300 | $1.24 | 5d | 1 | 1.06mi |
| 1919 E 2nd St Edmond, OK | 1.0–3.0 | 1.0–2.0 | 964 | $1,455 | $1.51 | 3d | 42 | 1.07mi |
| 436 Chalk Hill Ct Edmond, OK | 3.0 | 2.0 | 1274 | $2,850 | $2.24 | 23d | 1 | 1.07mi |
| 436 Chalk Hill Ct Edmond, OK | 3.0 | 2.0 | 1274 | $2,850 | $2.24 | 25d | 1 | 1.07mi |
| 231 Barrett Pl Edmond, OK | 3.0 | 2.0 | 1175 | $1,295 | $1.10 | 25d | 1 | 1.08mi |
| 412 Chalk Hill Ct Edmond, OK | 3.0 | 2.0 | 1216 | $1,565 | $1.29 | 16d | 1 | 1.10mi |
| 437 Chalk Hill Ct Edmond, OK | 3.0 | 2.0 | 1216 | $1,595 | $1.31 | 25d | 1 | 1.11mi |
| 425 Chalk Hill Ct Edmond, OK | 3.0 | 2.0 | 1243 | $1,550 | $1.25 | 16d | 1 | 1.11mi |
| 242 Barrett Pl Edmond, OK | 2.0 | 1.0 | 1029 | $1,150 | $1.12 | 23d | 1 | 1.12mi |
| 2133 E 2nd St Edmond, OK | 1.0–3.0 | 1.0–2.0 | 1077 | $2,004 | $1.86 | 3d | 30 | 1.13mi |
| 1303 Fretz Ave Edmond, OK | 2.0 | 2.0 | 1007 | $1,295 | $1.29 | 5d | 1 | 1.15mi |
| 105 W Hurd St Edmond, OK | 2.0 | 1.0 | 930 | $1,550 | $1.67 | 3d | 1 | 1.15mi |
| 101 W Main St Edmond, OK | 3.0 | 1.0–2.0 | 991 | $2,320 | $2.34 | 3d | 111 | 1.16mi |
| 320 Cedar Crest Dr Edmond, OK | 3.0 | 1.5 | 1051 | $1,295 | $1.23 | 3d | 1 | 1.21mi |
| 2500 Thomas Dr Edmond, OK | 1.0–3.0 | 1.0–2.0 | 879 | $1,395 | $1.59 | 3d | 6 | 1.24mi |
| 413 Meadow Lake Dr Edmond, OK | 4.0 | 2.0 | 1369 | $1,500 | $1.10 | 3d | 1 | 1.28mi |
| 513 Sunnyside Pl Edmond, OK | 3.0 | 1.5 | 1130 | $1,350 | $1.19 | 5d | 1 | 1.30mi |
| 401 E 7th St Edmond, OK | 3.0 | 2.0 | 1255 | $1,450 | $1.16 | 25d | 1 | 1.30mi |
| 15 S Walnut St Edmond, OK | 2.0 | 1.0 | 1162 | $1,400 | $1.20 | 25d | 1 | 1.43mi |
| 730 S Littler Ave Edmond, OK | 2.0 | 1.0 | 792 | $1,250 | $1.58 | 23d | 1 | 1.47mi |
Listing history 10 events
-
2026-03-31status Pending
-
2026-03-31price $150,000
-
2026-01-13price $160,000
-
2026-01-10$150,000 Active
-
2012-10-23soldstatus $112,500
-
2010-01-04soldstatus $112,500
-
2009-12-28soldstatus $112,400 222-char remark
Show marketing remark (222 chars)
NEW roof '03, NEW whole house carpet, NEWER windows, blinds, kitchen remodel and spacious custom media room with surround sound. Beautiful private wooded lot with covered back patio and shed. Move in ready. Close to UCO
-
2009-10-30$118,000 222-char remark
Show marketing remark (222 chars)
NEW roof '03, NEW whole house carpet, NEWER windows, blinds, kitchen remodel and spacious custom media room with surround sound. Beautiful private wooded lot with covered back patio and shed. Move in ready. Close to UCO
-
1996-01-09soldstatus $53,000
-
1984-04-01soldstatus $59,000
ⓘ Source: listings_history table (triggers on properties + properties_extension) + one-shot
backfill from property_details.listing_events for pre-trigger history.
Tax reassessment forecast OK · Resets to sale price
- Current annual tax
- $1,949 · $162/mo
- Projected year-2 tax
- $1,949 · $162/mo
- Expected delta
- $0/yr ($0/mo · 0.0%)
ⓘ Screening estimate from a state-policy table — verify with the county assessor before closing.
Climate risk First Street
- Flood 1/10 Low FEMA zone X (unshaded) · 0% chance over 30 yrs
- Wildfire 2/10 Low
- Heat 6/10 Major 7 d/yr ≥108°F today · 19 d/yr by 30 yrs out
- Wind 2/10 Low 3% chance of damaging wind over 30 yrs
- Air quality 2/10 Low 2 unhealthy d/yr today · 2 by 30 yrs out
Nearby sold comps map
Loading sold comps map…
Walkable amenities ~0.75 mi
Loading nearby amenities…
Taxation est. · year 1
- Rental income
- $18,924
- − Mortgage interest
- −$8,402
- − Property taxes
- −$1,949
- − Insurance
- −$750
- − Repairs & maintenance
- −$1,514
- − Management
- −$1,514
- − Depreciation
- −$4,364
- Taxable income
- $431
- Est. tax owed @ 24.0%
- −$104
- After-tax cash flow
- $2,708/yr
For passive investors: Depreciation is non-cash, so a rental often shows a tax loss while cash-flowing — sheltering income. Rental losses are passive: they offset passive income freely, and up to $25,000/yr can offset ordinary (W-2) income if you actively participate and your MAGI is under $100k (phasing out to $0 by $150k); unused losses carry forward. On sale, claimed depreciation is recaptured at up to 25%, and gains may owe capital-gains tax (a 1031 exchange can defer both). Figures are a year-1 estimate at your 24.0% rate — not tax advice; consult a CPA.
Schools (NCES district)
- District
- Edmond
- NCES district ID
- 4010590
- Math proficiency
- 38% ▼ -12.00%
- Reading proficiency
- 40% ▼ -12.00%
- Median HH income
- $73,212
- Composite
- 35.88/100
- National rank
- #4814
- State rank
- #11 of 270 in OK
Livability — Edmond
- Score
- 78/100
- State rank
- #6
- US rank
- #2383
Category grades
Schools grade is shown separately in the Schools card above.
Census & demographics
- Census place
- Edmond, OK
- County
- Oklahoma County · 771,644 people
- City population
- 177,083
- Metro
- Oklahoma City, OK
- Population (ZIP)
- 48,831
- Household income
- $109,700
- Rent vs Own
- Severe rent burden
- 1198.0
Population outlook (Oklahoma County) Hauer SSP2
- Today (2025)
- 911,875 people
- By 2030
- 982,413 · +7.7%
- By 2040
- 1,130,468 · +24.0%
- By 2050
- 1,288,422 · +41.3%
- By 2075
- 1,711,482 · +87.7%
- By 2100
- 2,088,448 · +129.0%
Race, ethnicity, and origin ACS 2023
- Neighborhood character
- Predominantly White (76%)
- Race & ethnicity
- White 76% Two or more races 10% Hispanic / Latino 8% Asian 4% Black 3% Native American 3%
- Hispanic origin (detail)
- Mexican 4%
- Common ancestry
- Italian 4% Slovak 3% Lithuanian 3%
- Foreign-born
- 6% · Canada, China, Vietnam
- Languages at home
- 92% English-only · Spanish 4% Other Indo-European 1% Chinese 1%
Political lean MEDSL · Oklahoma
- 2024 margin
- Toss-up / Even · D 48.0% · R 49.7% · Other 2.3%
- 2008→2024 swing
- +15.1pp toward D · 2008: -16.8pp · 2024: -1.7pp
- All cycles
- 2024: R+1.7 2020: R+1.1 2016: R+10.5 2012: R+16.7 2008: R+16.8
Not yet ingested
- Civics
- —
Market trends
- HPI YoY
- ▼ -164.67%
- Current HPI
- 223.1391
- Rent YoY
- ▲ 2.49%
- Metro
- Oklahoma City, OK
- State GDP YoY
- ▲ 1.55%
- F500 in state
- 6
Industry mix (Fortune 500 HQ in OK)
| Industry | F500 HQs | Revenue |
|---|---|---|
| Energy | 3 | $48B |
|
||
Price history
+154.2% since first listed10 events — show timeline
- 2026-03-31 Pending — MLSOK
- 2026-03-31 Price Changed $150,000 MLSOK
- 2026-01-13 Price Changed $160,000 MLSOK
- 2026-01-10 Listed $150,000 MLSOK
- 2012-10-23 Sold (Public Records) $112,500 Public Records
- 2010-01-04 Sold (Public Records) $112,500 Public Records
- 2009-12-28 Sold (MLS) $112,400 MLSOK
- 2009-10-30 Listed $118,000 MLSOK
- 1996-01-09 Sold (Public Records) $53,000 Public Records
- 1984-04-01 Sold (Public Records) $59,000 Public Records
Property tax history
+3.8%/yrLatest (2025): $1,949 · +5.1% YoY. Source: county tax records.
Cash-flow waterfall
monthlySold comps — $/sqft
last 12 mo · ≤1 miLoading sold comps…