2321 N Liberty Lakes Dr · Greensburg, IN
Flood risk 1/10 · Minimal
- FEMA flood zone
- X (unshaded)
- Chance of flooding over 30 yrs
- 0.0%
- Est. flood insurance / yr
- $507 – $1,088
Fire risk 1/10 · Minimal
- Est. fire insurance / yr
- $717 – $1,331
Heat risk 3/10 · Minor
- Hot days now (above 102°F)
- 7 days/yr
- Hot days in 30 yrs
- 17 days/yr
Wind risk 2/10 · Minimal
- Chance of severe wind over 30 yrs
- 1.0%
Air-quality risk 3/10 · Minor
- Unhealthy air days now
- 2 days/yr
- Unhealthy air days in 30 yrs
- 3 days/yr
Risk factors via First Street. Map © Google.
Why this score? — see what drove the B grade
The composite is a weighted blend of 9 inputs, each scored 0–100. Each bar is that input's sub-score; the figure is the points it added to the 100-point composite (weight × sub-score).
- Cash flow +30.0/30.0
- 1% rule +10.0/10.0
- DSCR +10.0/10.0
- ARV discount +7.9/15.0
- Condition / age +4.0/5.0
- Schools +3.8/10.0
- Livability +3.5/5.0
- Rent growth +2.5/5.0
- Appreciation +0.0/10.0
$265,000
🖨 Deal sheet (PDF) 📄 Offer letter ✓ Due diligence
Listing remarks MLS
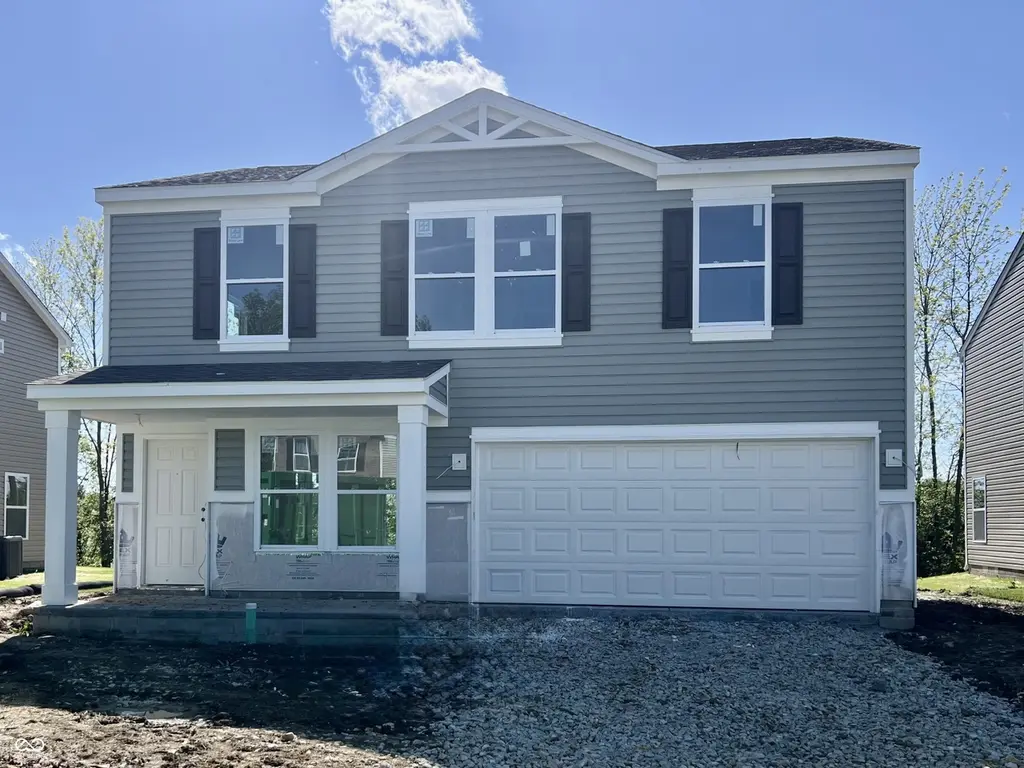
Under construction is a beautiful 1,773 sq. ft. home offering modern comfort and thoughtful design throughout. Enjoy a two-car garage and a welcoming covered front porch that sets the tone for what's inside. The main floor features durable luxury vinyl plank flooring in the kitchen, breakfast area, mudroom, and half bath, while the spacious family room provides cozy carpeting. The kitchen shines with Aristokraft cabinetry with crown molding, stainless steel appliances, and plenty of workspace for cooking and entertaining. Upstairs, you'll find three bedrooms, including a primary suite with a private bath featuring a garden tub/shower combo, double bowl vanity, and a walk-in closet. Two additional bedrooms share a full bath, and a generous rec room offers flexible space for family fun or relaxation. With its thoughtful design and modern finishes, this beautiful new home has everything you've been looking for-schedule your showing today!
Key facts
- Covered front porch
- Two car garage
- Walk in closet
Tags
Property features AI
Finance
- Other: Lot approximately 0.18 acres
- HOA & community: Homeowners association with an annual fee of $100 (mandatory)
Exterior
- Parking: Attached concrete garage (2 spaces)
- Security: Smoke alarm
- Utilities: Public water; Municipal sewer connected; No solid waste service
- Home design: Single family residence; Two levels; Residential property; New construction
- Construction: Vinyl with brick exterior; Slab foundation; Drywall construction stage; Built by Beacon Builders
- Exterior features: Covered patio; Has view
Interior
- Kitchen: Eat-in kitchen; Pantry; Breakfast bar; Electric oven; Microhood; Disposal
- Bedrooms: Primary bedroom with walk-in closet; Three upper-level bedrooms
- Bathrooms: Two full bathrooms; One half bathroom; Primary bathroom with double sinks and full tub with shower (garden tub option)
- Heating & cooling: Forced air heating (natural gas); Central air conditioning; Smart thermostat
- Interior features: Attic access; Breakfast bar; Eat-in kitchen; Pantry; Smart thermostat; Walk-in closet(s); Painted woodwork; Disposal; Microhood; Electric oven; Electric water heater
- Laundry & utility: In-unit laundry on upper level
Neighborhood map
What this means for you Summary
Snapshot
- This is a 3-bed/2.5-bath single-family listed at $265k. Condition is rated good.
Deal economics
- At list price, monthly cash flow is $1k ($16k/yr) — positive.
- The deal already cash-flows at list — no discount required.
- Meets the 1% rule at list price ($4k rent vs $265k).
- Recommended offer: $257k (3.0% below list) — sets the bar for market timing.
- Cap rate 12.3% vs local median 5.9% in Greensburg — top-decile yield for the area; either an underpriced asset or a hidden risk that comps aren't pricing in. Stress-test before assuming the spread holds.
Location & tenants
- Location reads 69/100 on livability (#200 in IN) — a middle-class / working-renter tenant base. Strengths: cost of living A+, housing A+, crime B+; Watch: employment C-, amenities F, commute F.
- Greensburg Community Schools (town): math 38% / reading 51% proficiency, ranked #102 of 301 in IN (top 34%) — families likely to look elsewhere, expect single-tenant / working-renter base with shorter leases.
- Zoned schools: Greensburg Elementary (math 60% / reading 47%, grade C, #225 of 994 statewide, top 23%, 1,037 students, 55% FRL); Greensburg Community Jr High (math 24% / reading 49%, grade F, #156 of 330 statewide, top 48%, 441 students, 48% FRL); Greensburg Community High School (math 27% / reading 67%, grade D-, #143 of 369 statewide, top 44%, 671 students, 44% FRL).
- Market conditions: 157 active listings in the ZIP; 1 comparable units currently listed for rent nearby; 66 units permitted in Decatur County in 2024 (0 in 5+ unit buildings).
Forward outlook
- Local home prices are declining (-3.0%/yr); year-one equity from $2k of loan paydown is wiped out by about $8k of value loss. Plan a longer hold.
- Decatur County population projected at +6% by 2050 — modest demand growth; plan on rents tracking national, not racing it.
- At projected returns (-3.0% appreciation + 3.0% rent growth), your $74k cash investment doubles in ~6 years — after that, you're playing with house money.
Negotiation context
- It's been on market 38 days — a 3% lower offer ($257k) is reasonable based on typical stale-listing flexibility.
- 2 sale attempts with the ask held roughly flat each time — persistent listings suggest the price (not the market) is what's stuck; bring a comps-based counter.
Questions for the listing agent
- It's been on market 38 days. Have you received any prior offers? Is the seller open to a 3% concession, seller financing, or rate buy-down credit?
- What does the HOA fee cover, when was the last increase, and are there any pending special assessments or reserve-fund shortfalls?
- Is there a deadline driving the sale (1031 exchange, divorce, estate, relocation)? That informs how much negotiation room exists.
- Schools are D-rated, which usually means shorter tenancies and higher turnover. Who's the typical renter profile here, and what's been the actual vacancy rate?
- What's the average days-on-market for RENTAL listings here right now (not sales)? A rising rental-DOM trend means longer vacancies and softer asking-rent achievability than the comps imply.
- What's the recent tenant-quality profile in this submarket — average credit score on applications, eviction rate, late-payment / NSF rate, and stable-employment percentage? A property-management company in the area should have these aggregated.
- How much new for-sale + rental construction is in the pipeline within 1–3 miles? Heavy new supply typically softens prices + rents 12–24 months out; constrained supply supports both.
Investment metrics
- 1% rule
- 1.51% ✓
- Cap rate
- 12.26%
- Cash-on-cash
- 21.29%
- DSCR
- 1.95
- GRM
- 5.5
CMA / ARV
- ARV (median comp)
- $267,177
- List price
- $265,000
- Delta
- -0.81%
- Verdict
- FAIR
- Comps
- 20 within 1.0 mi
Show comp detail 11 sales within ~0.75 mi
| Address | Dist | Beds/Ba | Sqft | Sold | Price | $/sf | Match |
|---|---|---|---|---|---|---|---|
| 2328 N Liberty Lakes Dr | 0.05mi | 3/2.5 | 1,773 (0%) | 1mo | $272,370 | $154 | 97 |
| 2339 N Liberty Lakes Dr | 0.08mi | 3/2.5 | 1,773 (0%) | 3mo | $265,000 | $149 | 94 |
| 2329 N Liberty Lakes Dr | 0.08mi | 3/2.5 | 1,773 (0%) | 10mo | $265,365 | $150 | 88 |
| 2345 N Liberty Lakes Dr | 0.11mi | 4/2.5 (+1) | 1,997 (+13%) | 3mo | $278,285 | $139 | 66 |
| 1306 W Daniel Dr | 0.70mi | 3/2.5 | 1,800 (+2%) | 10mo | $305,000 | $169 | 56 |
| 1405 N East St | 0.73mi | 4/2.0 (+1) | 1,754 (-1%) | 1mo | $229,900 | $131 | 56 |
| 1904 N Oakmont Ave | 0.65mi | 3/2.0 | 1,644 (-7%) | 1mo | $295,000 | $179 | 55 |
| 1822 N Oakmont Ave | 0.66mi | 3/2.5 | 1,624 (-8%) | 12mo | $315,000 | $194 | 45 |
| 911 W 11th St | 0.62mi | 3/2.0 | 1,951 (+10%) | 11mo | $207,700 | $106 | 43 |
| 1613 N Carver St | 0.52mi | 3/1.5 | 1,616 (-9%) | 19mo | $295,000 | $183 | 41 |
| 817 W 8th St | 0.72mi | 3/2.0 | 1,512 (-15%) | 24mo | $235,000 | $155 | 20 |
Match score weights: distance 35% · size 25% · config 20% · recency 20%. Top-matched comps best support the ARV.
Projected returns pro-forma
-3.0% appreciation · 3.0% rent growth · sell at horizon
- IRR
- 13.8%
- Equity multiple
- 1.55×
- Total profit
- $40,985
- Equity at exit
- $39,512
- IRR
- 22.6%
- Equity multiple
- 2.94×
- Total profit
- $143,938
- Equity at exit
- $22,912
Cash invested: $74,200 (down + closing). Projections, not guarantees.
Landlord ↔ Tenant lean methodology
- Overall (STATE)
- 90 Strongly Landlord-Friendly
- State Indiana
- 90 Strongly Landlord-Friendly · R+11
- County
- — inherits STATE
- City
- — inherits STATE
ZIP-level market 47240
- Home prices YoY
- -25.0%
- Active inventory
- 157
- Price-to-rent
- 5.5×
Monthly cashflow live
- Estimated rent
- $3,995 medium interval (Pro) →
- Mortgage (P&I)
- −$1,390
- Tax est. 1.5%
- −$331 /mo · $3,975/yr
- Insurance
- −$110
- HOA
- −$8
- Vacancy / Maint / Mgmt
- −$839
- Net cashflow
- $1,317
Break-even live
Sensitivity live
| Price | -10% $1,500 | -5% $1,408 | +0% $1,317 | +5% $1,225 | +10% $1,134 |
|---|---|---|---|---|---|
| Rent | -10% $1,001 | -5% $1,159 | +0% $1,317 | +5% $1,474 | +10% $1,632 |
| Rate | -1.0pp $1,450 | -0.5pp $1,384 | base $1,317 | +0.5pp $1,248 | +1.0pp $1,178 |
UW: 25.0% down · 7.5% · 30yr · 1.5% tax · 5.0% vac · 8.0% maint · 8.0% mgmt
Financing live
Cash to close
- Down payment
- $66,250
- Closing costs
- $7,950
- Reserves months
- —
- Total cash needed
- —
Loan-product check · same deal, 3 products live
Conventional
25% down · 7.5% · 30yr
- Down + closing
- —
- Monthly P&I
- —
- Monthly cashflow
- —
- DSCR
- —
- Eligible?
- —
Personal DTI + credit; lowest rate.
DSCR
20% down · 8.5% · 30yr
- Down + closing
- —
- Monthly P&I
- —
- Monthly cashflow
- —
- DSCR
- —
- Eligible?
- —
No personal income docs; deal must DSCR.
Hard money
10% down · 12.0% · 12mo
- Down + closing
- —
- Monthly P&I
- —
- Monthly cashflow
- —
- DSCR
- —
- Eligible?
- —
Short-term bridge; refi at stabilization.
Rent comps 1 comps
| Address | Beds | Baths | Sqft | Rent | $/sqft | DOM | Units | Dist |
|---|---|---|---|---|---|---|---|---|
| 1011 N Anderson St Greensburg, IN | 3.0 | 2.5 | 1620 | $3,995 | $2.47 | 13d | 1 | 0.94mi |
HOA detail
- Monthly dues
- $8 · $96/yr
Listing history 18 events
-
2026-06-21days on market $265,000 Active 38 DOM
-
2026-06-21days on market $265,000 Active 37 DOM
-
2026-06-18days on market $265,000 Active 35 DOM
-
2026-06-17days on market $265,000 Active 34 DOM
-
2026-06-16days on market $265,000 Active 33 DOM
-
2026-06-15days on market $265,000 Active 32 DOM
-
2026-06-13days on market $265,000 Active 30 DOM
-
2026-06-12days on market $265,000 Active 29 DOM
-
2026-06-09days on market $265,000 Active 26 DOM
-
2026-06-08days on market $265,000 Active 25 DOM
Show marketing remark (949 chars)
Under construction is a beautiful 1,773 sq. ft. home offering modern comfort and thoughtful design throughout. Enjoy a two-car garage and a welcoming covered front porch that sets the tone for what's inside. The main floor features durable luxury vinyl plank flooring in the kitchen, breakfast area, mudroom, and half bath, while the spacious family room provides cozy carpeting. The kitchen shines with Aristokraft cabinetry with crown molding, stainless steel appliances, and plenty of workspace for cooking and entertaining. Upstairs, you'll find three bedrooms, including a primary suite with a private bath featuring a garden tub/shower combo, double bowl vanity, and a walk-in closet. Two additional bedrooms share a full bath, and a generous rec room offers flexible space for family fun or relaxation. With its thoughtful design and modern finishes, this beautiful new home has everything you've been looking for-schedule your showing today!
-
2026-06-07days on market $265,000 Active 24 DOM
-
2026-06-05days on market $265,000 Active 22 DOM
-
2026-06-04days on market $265,000 Active 20 DOM
-
2026-06-02days on market $265,000 Active 19 DOM
-
2026-06-01days on market $265,000 Active 18 DOM
-
2026-05-31days on market $265,000 Active 17 DOM
-
2026-05-31days on market $265,000 Active 16 DOM
-
2026-05-14$265,000 Active 952-char remark
ⓘ Source: listings_history table (triggers on properties + properties_extension) + one-shot
backfill from property_details.listing_events for pre-trigger history.
Climate risk First Street
- Flood 1/10 Low FEMA zone X (unshaded) · 0% chance over 30 yrs
- Wildfire 1/10 Low
- Heat 3/10 Moderate 7 d/yr ≥102°F today · 17 d/yr by 30 yrs out
- Wind 2/10 Low 100% chance of damaging wind over 30 yrs
- Air quality 3/10 Moderate 2 unhealthy d/yr today · 3 by 30 yrs out
Nearby sold comps map
Loading sold comps map…
Walkable amenities ~0.75 mi
Loading nearby amenities…
Taxation est. · year 1
- Rental income
- $47,940
- − Mortgage interest
- −$14,844
- − Property taxes
- −$3,975
- − Insurance
- −$1,325
- − Repairs & maintenance
- −$3,835
- − Management
- −$3,835
- − HOA
- −$96
- − Depreciation
- −$7,709
- Taxable income
- $12,320
- Est. tax owed @ 24.0%
- −$2,957
- After-tax cash flow
- $12,843/yr
For passive investors: Depreciation is non-cash, so a rental often shows a tax loss while cash-flowing — sheltering income. Rental losses are passive: they offset passive income freely, and up to $25,000/yr can offset ordinary (W-2) income if you actively participate and your MAGI is under $100k (phasing out to $0 by $150k); unused losses carry forward. On sale, claimed depreciation is recaptured at up to 25%, and gains may owe capital-gains tax (a 1031 exchange can defer both). Figures are a year-1 estimate at your 24.0% rate — not tax advice; consult a CPA.
Condition & rehab AI · 21 photos
This home is under construction and will be move-in ready with minimal repairs and maintenance required. The interior is nearly complete with good quality finishes, and the exterior is well-maintained. The highest-ROI updates include painting, flooring, and installing cabinets and countertops.
Value-add opportunities
- Both Paint walls — Enhances curb appeal and interior aesthetics
- Both Install flooring — Improves functionality and appearance
- Both Install cabinets — Enhances kitchen functionality and aesthetics
- Both Install countertops — Improves kitchen functionality and aesthetics
- Both Install appliances — Enhances kitchen functionality and aesthetics
- Both Install lighting — Enhances interior aesthetics and functionality
- Both Install fixtures — Enhances bathroom functionality and aesthetics
Renovation cost estimate screening
Value-add ROI direction
- Both Paint walls — Enhances curb appeal and interior aesthetics ↑
- Both Install flooring — Improves functionality and appearance ↑
- Both Install cabinets — Enhances kitchen functionality and aesthetics ↑
- Both Install countertops — Improves kitchen functionality and aesthetics ↑
- Both Install appliances — Enhances kitchen functionality and aesthetics ↑
- Both Install lighting — Enhances interior aesthetics and functionality ↑
- Both Install fixtures — Enhances bathroom functionality and aesthetics ↑
ⓘ Cost ranges are severity-bucket heuristics (US national rule-of-thumb). Get contractor quotes + a written scope before underwriting a rehab budget.
Schools (NCES district)
- District
- Greensburg Community Schools
- NCES district ID
- 1804080
- Math proficiency
- 38% ▼ -7.00%
- Reading proficiency
- 51% ▼ -2.00%
- Median HH income
- $47,723
- Composite
- 37.96/100
- National rank
- #4301
- State rank
- #102 of 301 in IN
Livability — Greensburg
- Score
- 69/100
- State rank
- #200
- US rank
- #8922
Category grades
Schools grade is shown separately in the Schools card above.
Census & demographics
- Census place
- Greensburg, IN
- Population (ZIP)
- 21,514
Population outlook (Decatur County) Hauer SSP2
- Today (2025)
- 27,709 people
- By 2030
- 28,278 · +2.1%
- By 2040
- 29,195 · +5.4%
- By 2050
- 29,512 · +6.5%
- By 2075
- 29,835 · +7.7%
- By 2100
- 27,192 · -1.9%
Race, ethnicity, and origin ACS 2023
- Neighborhood character
- Predominantly White (93%)
- Race & ethnicity
- White 93% Two or more races 5% Hispanic / Latino 3%
- Common ancestry
- Slovak 2% Serbian 1% Romanian 1%
- Foreign-born
- 1% · Canada
- Languages at home
- 98% English-only · Spanish 2%
Political lean MEDSL · Decatur
- 2024 margin
- Solid R (+58.5) · D 19.9% · R 78.4% · Other 1.8%
- 2008→2024 swing
- -34.1pp toward R · 2008: -24.4pp · 2024: -58.5pp
- All cycles
- 2024: R+58.5 2020: R+58.1 2016: R+57.4 2012: R+40.5 2008: R+24.4
Not yet ingested
- Civics
- —
Market trends
- HPI YoY
- ▼ -70.13%
- Current HPI
- 210.3591
- Rent YoY
- —
- Metro
- —
- State GDP YoY
- ▲ 2.90%
- F500 in state
- 18
Industry mix (Fortune 500 HQ in IN)
| Industry | F500 HQs | Revenue |
|---|---|---|
| Industrial Machinery | 2 | $37B |
|
||
| Healthcare | 1 | $177B |
|
||
| Pharmaceuticals | 1 | $45B |
|
||
| Metals / Steel | 1 | $18B |
|
||
| Agriculture | 1 | $17B |
|
||
| Packaging | 1 | $12B |
|
||
Price history
+0.0% since first listed2 events — show timeline
- 2026-06-08 Listed $265,000 SEIBR
- 2026-05-14 Listed $265,000 MIBOR as Distributed by MLS Grid
Cash-flow waterfall
monthlySold comps — $/sqft
last 12 mo · ≤1 miLoading sold comps…