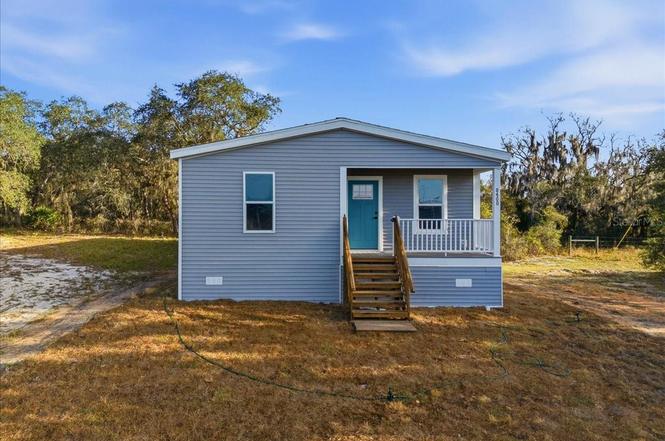
449 Stone St · Wildwood, FL
Flood risk No data
- FEMA flood zone
- —
- Chance of flooding over 30 yrs
- —
- Est. flood insurance / yr
- —
Fire risk No data
- Est. fire insurance / yr
- —
Heat risk No data
- Hot days now (above threshold)
- —
- Hot days in 30 yrs
- —
Wind risk No data
- Chance of severe wind over 30 yrs
- —
Air-quality risk No data
- Unhealthy air days now
- —
- Unhealthy air days in 30 yrs
- —
Risk factors via First Street. Map © Google.
Why this score? — see what drove the C- grade
The composite is a weighted blend of 9 inputs, each scored 0–100. Each bar is that input's sub-score; the figure is the points it added to the 100-point composite (weight × sub-score).
- Cash flow +18.8/30.0
- ARV discount +7.5/15.0
- DSCR +5.9/10.0
- Schools +5.2/10.0
- 1% rule +5.0/10.0
- Livability +3.5/5.0
- Rent growth +3.2/5.0
- Condition / age +2.5/5.0
- Appreciation +0.0/10.0
$199,692
🖨 Deal sheet 📄 Offer letter ✓ Due diligence
Listing remarks MLS
Whether you're investing or your building your primary home, this vacant land is the one for you. Located in the growing city of Wildwood Fl this property has the flexibility to build many different kind of structures on it. You can build a Block home, manufactured home, tiny home, Wood frame home, container home or modular home. It also can be connected to City water and sewer, so there's no need to deal with septic tanks. BE THE ONE TO OWN IT TODAY!!!
Key facts
- Spacious front porch
- Corner lot
- Open concept layout
Tags
Property features AI
Finance
- Other: Home warranty included; Unfurnished; Projected completion date: 2025-11-30
- HOA & community: Pets allowed; No association approval required
Exterior
- Utilities: Public water; Public sewer; Broadband/high-speed internet available; Cable available; Electricity connected; Phone available; Water connected; Sewer connected
- Home design: Residential manufactured home (double wide); Cavco Craft Select model; One level; New construction (completed); Faces south
- Construction: Vinyl siding; Shingle roof; Block foundation with crawlspace; Built/installed as new construction
- Exterior features: Front porch; Private mailbox; Asphalt road access; Lot dimensions 111 x 72 x 111 x 65
Interior
- Kitchen: Dishwasher; Range; Range hood; Refrigerator; Electric water heater
- Bedrooms: 3 bedrooms
- Flooring: Linoleum
- Bathrooms: 2 full bathrooms
- Heating & cooling: Central heating; Electric heating; Heat pump; Central air
- Interior features: Eat-in kitchen; Living room/dining room combo; Open floorplan; Thermostat; Walk-in closet(s); Blinds; Smoke detector(s)
- Laundry & utility: Inside laundry room
Neighborhood map
What this means for you Summary
Snapshot
- This is a 3-bed/2.0-bath land listed at $200k.
Deal economics
- At list price, monthly cash flow is $202 ($2k/yr) — positive.
- The deal already cash-flows at list — no discount required.
- Meets the 1% rule at list price ($2k rent vs $200k).
- Recommended offer: $176k (12.0% below list) — sets the bar for market timing.
- Cap rate 7.5% vs local median 3.9% in Wildwood — top-decile yield for the area; either an underpriced asset or a hidden risk that comps aren't pricing in. Stress-test before assuming the spread holds.
Location & tenants
- Location reads 69/100 on livability (#471 in FL) — a middle-class / working-renter tenant base. Strengths: health & safety A+, cost of living A, crime A-; Watch: amenities F, commute F, employment D-.
- Sumter (rural): math 61% / reading 61% proficiency, ranked #11 of 73 in FL (top 15%) — acceptable for families but not a draw, mixed tenant base, ~2y average lease.
- Zoned schools: Wildwood Elementary School (math 49% / reading 52%, grade D+, #1,055 of 2,144 statewide, top 50%, 940 students, 76% FRL); Wildwood Middle/ High School (math 29% / reading 41%, grade F, #379 of 667 statewide, top 58%, 843 students, 63% FRL) — zoned schools average 69% FRL vs 51% district-wide (19 pts higher); higher-poverty schools than district average — tighter screening recommended.
- Zoned-school proficiency averages 43% at this address vs 61% district-wide (-18 pts) — the specific schools serving this property underperform the Sumter average; the district grade overstates school quality for this exact location.
- Market conditions: Rents rising (+2.9%/yr); 422 active listings in the ZIP; 15 comparable units currently listed for rent nearby; rentals at typical pace (median 21d on market — plan ~3-4 weeks tenant-placement turnaround); 3,961 units permitted in Sumter County in 2024 (248 in 5+ unit buildings).
- This rent runs 36% of the median local income ($66k/yr) — at the standard rent-burdened threshold; future hikes will face affordability resistance.
Forward outlook
- Local home prices are declining (-3.0%/yr); year-one equity from $1k of loan paydown is wiped out by about $6k of value loss. Plan a longer hold.
- Sumter County population projected at +45% by 2050 — long-run rental-demand tailwind backs the buy-and-hold thesis.
Negotiation context
- It's been on market 238 days — a 12% lower offer ($176k) is reasonable based on typical stale-listing flexibility.
- 4 sale attempts since 2y ago; this cycle's ask has dropped $50k (20%) from the opening price — seller is motivated, your offer sets the floor, not the list.
- Current owner paid $26k; list at $200k implies a 671% gain — meaningful room to come down on a strong offer.
Questions for the listing agent
- It's been on market 238 days. Have you received any prior offers? Is the seller open to a 12% concession, seller financing, or rate buy-down credit?
- Why hasn't it sold? Are there any deal-killer items the seller is aware of (foundation, flood, title, zoning, code violations)?
- Is there a deadline driving the sale (1031 exchange, divorce, estate, relocation)? That informs how much negotiation room exists.
- What's the average days-on-market for RENTAL listings here right now (not sales)? A rising rental-DOM trend means longer vacancies and softer asking-rent achievability than the comps imply.
- What's the recent tenant-quality profile in this submarket — average credit score on applications, eviction rate, late-payment / NSF rate, and stable-employment percentage? A property-management company in the area should have these aggregated.
- How much new for-sale + rental construction is in the pipeline within 1–3 miles? Heavy new supply typically softens prices + rents 12–24 months out; constrained supply supports both.
Investment metrics
- 1% rule
- 1.00% ✓
- Cap rate
- 7.50%
- Cash-on-cash
- 4.32%
- DSCR
- 1.19
- GRM
- 8.3
CMA / ARV
No comps found within radius.
Projected returns pro-forma
-3.0% appreciation · 2.85% rent growth · sell at horizon
- IRR
- -9.7%
- Equity multiple
- 0.65×
- Total profit
- $-19,796
- Equity at exit
- $29,775
- IRR
- -0.5%
- Equity multiple
- 0.97×
- Total profit
- $-1,824
- Equity at exit
- $17,266
Cash invested: $55,914 (down + closing). Projections, not guarantees.
Landlord ↔ Tenant lean methodology
- Overall (STATE)
- 87 Strongly Landlord-Friendly
- State Florida
- 87 Strongly Landlord-Friendly · R+3
- County
- — inherits STATE
- City
- — inherits STATE
ZIP-level market 34785
- Home prices YoY
- -10.7%
- Rents YoY
- 2.9%
- Active inventory
- 422
- Price-to-rent
- 8.3×
Monthly cashflow live
- Estimated rent
- $2,002 high interval (Pro) →
- Mortgage (P&I)
- −$1,047
- Tax est. 1.5%
- −$250 /mo · $2,995/yr
- Insurance
- −$83
- HOA
- −$0
- Vacancy / Maint / Mgmt
- −$420
- Net cashflow
- $202
Break-even live
UW: 25.0% down · 7.5% · 30yr · 1.5% tax · 5.0% vac · 8.0% maint · 8.0% mgmt
Financing live
Cash to close
- Down payment
- $49,923
- Closing costs
- $5,991
- Reserves months
- —
- Total cash needed
- —
Loan-product check · same deal, 3 products live
Conventional
25% down · 7.5% · 30yr
- Down + closing
- —
- Monthly P&I
- —
- Monthly cashflow
- —
- DSCR
- —
- Eligible?
- —
Personal DTI + credit; lowest rate.
DSCR
20% down · 8.5% · 30yr
- Down + closing
- —
- Monthly P&I
- —
- Monthly cashflow
- —
- DSCR
- —
- Eligible?
- —
No personal income docs; deal must DSCR.
Hard money
10% down · 12.0% · 12mo
- Down + closing
- —
- Monthly P&I
- —
- Monthly cashflow
- —
- DSCR
- —
- Eligible?
- —
Short-term bridge; refi at stabilization.
Rent comps 15 comps
| Address | Beds | Baths | Sqft | Rent | $/sqft | DOM | Units | Dist |
|---|---|---|---|---|---|---|---|---|
| 5901 Myrtle DR Wildwood, FL | 1.0–2.0 | 1.0–2.0 | 982 | $2,009 | $2.05 | 21d | 11 | 0.34mi |
| 706 Stanley Ave Wildwood, FL | 3.0 | 2.0 | 1611 | $2,300 | $1.43 | 21d | 1 | 0.47mi |
| 8362 Gower Trl Wildwood, FL | 3.0 | 2.5 | 1464 | $1,695 | $1.16 | 21d | 1 | 0.97mi |
| 8396 Gower Trl Unit 1 Wildwood, FL | 3.0 | 2.5 | 1707 | $1,795 | $1.05 | 21d | 1 | 1.01mi |
| 3234 Evenmore Way Wildwood, FL | 4.0 | 2.0 | 1824 | $2,100 | $1.15 | 21d | 1 | 1.13mi |
| 4980 Red Maple Ln Unit C1 Wildwood, FL | 3.0 | 2.0 | 1445 | $1,801 | $1.25 | 21d | 1 | 1.20mi |
| 4980 Red Maple Ln Unit B1 Wildwood, FL | 2.0 | 2.0 | 1095 | $1,884 | $1.72 | 21d | 1 | 1.20mi |
| 5115 Spanish Harbor Dr Wildwood, FL | 1.0–3.0 | 1.0–2.0 | 990 | $1,680 | $1.70 | 21d | 29 | 1.33mi |
| 6629 Dan DiCiolla Dr Wildwood, FL | 1.0–3.0 | 1.0–2.5 | 1075 | $2,399 | $2.23 | 21d | 44 | 1.39mi |
| 8118 Arrow Wood Loop Wildwood, FL | 2.0 | 2.5 | 1317 | $1,704 | $1.29 | 21d | 1 | 1.39mi |
| 7011 Homestead Lp Wildwood, FL | 1.0–3.0 | 1.0–2.0 | 998 | $1,759 | $1.76 | 21d | 22 | 1.40mi |
| 8128 Arrow Wood Loop Wildwood, FL | 2.0 | 2.5 | 1317 | $1,699 | $1.29 | 21d | 1 | 1.42mi |
| 5267 Dragonfly Dr Wildwood, FL | 3.0 | 2.5 | 1688 | $1,945 | $1.15 | 21d | 1 | 1.47mi |
| 8168 Arrow Wood Loop Wildwood, FL | 2.0 | 2.5 | 1317 | $1,754 | $1.33 | 21d | 1 | 1.47mi |
| 8073 Patagonia Dr Wildwood, FL | 3.0 | 3.0 | 1638 | $2,645 | $1.61 | 21d | 1 | 1.50mi |
Listing history 50 events
-
2026-06-19days on market $199,692 Active 238 DOM
-
2026-06-18price $199,692 Active 237 DOM
-
2026-06-18days on market $199,693 Active 237 DOM
-
2026-06-17price $199,693 Active 236 DOM
-
2026-06-17days on market $199,694 Active 236 DOM
-
2026-06-16pricedays on market $199,694 Active 235 DOM
-
2026-06-15pricedays on market $199,695 Active 234 DOM
-
2026-06-14days on market $199,795 Active 232 DOM
-
2026-06-13pricedays on market $199,795 Active 231 DOM
-
2026-06-10days on market $199,799 Active 229 DOM
-
2026-06-09pricedays on market $199,799 Active 228 DOM
-
2026-06-08days on market $199,800 Active 227 DOM
-
2026-06-07days on market $199,800 Active 226 DOM
-
2026-06-02days on market $199,800 Active 221 DOM
-
2026-06-01days on market $199,800 Active 220 DOM
-
2026-05-31days on market $199,800 Active 219 DOM
-
2026-05-30days on market $199,800 Active 218 DOM
-
2026-05-23price $199,900
-
2026-05-21price $235,263
-
2026-05-20price $235,363
-
2026-05-19price $235,463
-
2026-05-18price $235,563
-
2026-05-15price $235,663
-
2026-05-14price $235,763
-
2026-05-13price $235,863
-
2026-05-12price $235,963
-
2026-05-11price $236,063
-
2026-05-08price $236,163
-
2026-05-07price $236,263
-
2026-05-06price $236,363
-
2026-05-05price $236,463
-
2026-05-04price $236,563
-
2026-05-01price $236,663
-
2026-04-30price $236,763
-
2026-04-29price $236,863
-
2026-04-28price $236,963
-
2026-04-27price $237,063
-
2026-04-24price $237,163
-
2026-04-23price $237,263
-
2026-04-22price $237,363
-
2026-04-21price $237,463
-
2026-04-20price $237,563
-
2026-04-17price $237,663
-
2026-04-16price $237,763
-
2026-04-14price $237,863
-
2026-04-13price $237,963
-
2026-04-10price $238,063
-
2026-04-09price $238,163
-
2026-04-08price $238,263
-
2026-04-07price $238,363
ⓘ Source: listings_history table (triggers on properties + properties_extension) + one-shot
backfill from property_details.listing_events for pre-trigger history.
Nearby sold comps map
Loading sold comps map…
Walkable amenities ~0.75 mi
Loading nearby amenities…
Taxation est. · year 1
- Rental income
- $24,023
- − Mortgage interest
- −$11,186
- − Property taxes
- −$2,995
- − Insurance
- −$998
- − Repairs & maintenance
- −$1,922
- − Management
- −$1,922
- − Depreciation
- −$5,809
- Taxable loss
- −$809
- Est. tax savings @ 24.0%
- +$194
- After-tax cash flow
- $2,612/yr
For passive investors: Depreciation is non-cash, so a rental often shows a tax loss while cash-flowing — sheltering income. Rental losses are passive: they offset passive income freely, and up to $25,000/yr can offset ordinary (W-2) income if you actively participate and your MAGI is under $100k (phasing out to $0 by $150k); unused losses carry forward. On sale, claimed depreciation is recaptured at up to 25%, and gains may owe capital-gains tax (a 1031 exchange can defer both). Figures are a year-1 estimate at your 24.0% rate — not tax advice; consult a CPA.
Schools (NCES district)
- District
- Sumter
- NCES district ID
- 1201800
- Math proficiency
- 61% ▼ -4.00%
- Reading proficiency
- 61% ▼ -2.00%
- Median HH income
- $48,240
- Composite
- 51.74/100
- National rank
- #1682
- State rank
- #11 of 73 in FL
Livability — Wildwood
- Score
- 69/100
- State rank
- #471
- US rank
- #8500
Category grades
Schools grade is shown separately in the Schools card above.
Census & demographics
- Census place
- Wildwood, FL
- County
- Sumter County · 110,591 people
- City population
- 21,568
- Metro
- The Villages, FL
- Population (ZIP)
- 21,568
- Household income
- $66,136
- Rent vs Own
- Severe rent burden
- 730.0
Population outlook (Sumter County) Hauer SSP2
- Today (2025)
- 161,172 people
- By 2030
- 180,083 · +11.7%
- By 2040
- 209,892 · +30.2%
- By 2050
- 234,186 · +45.3%
- By 2075
- 284,602 · +76.6%
- By 2100
- 317,039 · +96.7%
Race, ethnicity, and origin ACS 2023
- Neighborhood character
- Diverse neighborhood (Simpson 0.62)
- Race & ethnicity
- White 52% Black 29% Hispanic / Latino 14% Two or more races 3%
- Hispanic origin (detail)
- Mexican 4% Puerto Rican 2%
- Common ancestry
- Romanian 3% Lithuanian 2% Italian 2%
- Foreign-born
- 11% · Canada, Jamaica
- Languages at home
- 85% English-only · Spanish 12% Other Indo-European 1% French/Haitian/Cajun 1%
Political lean MEDSL · Sumter
- 2024 margin
- Solid R (+37.6) · D 30.9% · R 68.6%
- 2008→2024 swing
- -10.6pp toward R · 2008: -27.0pp · 2024: -37.6pp
- All cycles
- 2024: R+37.6 2020: R+36.1 2016: R+39.2 2012: R+34.9 2008: R+27.0
Not yet ingested
- Civics
- —
Market trends
- HPI YoY
- ▼ -32.14%
- Current HPI
- 267.9137
- Rent YoY
- ▲ 2.85%
- Metro
- The Villages, FL
- State GDP YoY
- ▲ 3.28%
- F500 in state
- 36
Industry mix (Fortune 500 HQ in FL)
| Industry | F500 HQs | Revenue |
|---|---|---|
| Industrial Technology | 2 | $29B |
|
||
| Insurance | 2 | $17B |
|
||
| Retail | 1 | $60B |
|
||
| Technology Distribution | 1 | $58B |
|
||
| Homebuilding | 1 | $35B |
|
||
| Technology Manufacturing | 1 | $35B |
|
||
Price history
+577.6% since first listed100 events — show timeline
- 2026-05-23 Price Changed $199,900 Stellar MLS as Distributed by MLS Grid
- 2026-05-21 Price Changed $235,263 Stellar MLS as Distributed by MLS Grid
- 2026-05-20 Price Changed $235,363 Stellar MLS as Distributed by MLS Grid
- 2026-05-19 Price Changed $235,463 Stellar MLS as Distributed by MLS Grid
- 2026-05-18 Price Changed $235,563 Stellar MLS as Distributed by MLS Grid
- 2026-05-15 Price Changed $235,663 Stellar MLS as Distributed by MLS Grid
- 2026-05-14 Price Changed $235,763 Stellar MLS as Distributed by MLS Grid
- 2026-05-13 Price Changed $235,863 Stellar MLS as Distributed by MLS Grid
- 2026-05-12 Price Changed $235,963 Stellar MLS as Distributed by MLS Grid
- 2026-05-11 Price Changed $236,063 Stellar MLS as Distributed by MLS Grid
- 2026-05-08 Price Changed $236,163 Stellar MLS as Distributed by MLS Grid
- 2026-05-07 Price Changed $236,263 Stellar MLS as Distributed by MLS Grid
- 2026-05-06 Price Changed $236,363 Stellar MLS as Distributed by MLS Grid
- 2026-05-05 Price Changed $236,463 Stellar MLS as Distributed by MLS Grid
- 2026-05-04 Price Changed $236,563 Stellar MLS as Distributed by MLS Grid
- 2026-05-01 Price Changed $236,663 Stellar MLS as Distributed by MLS Grid
- 2026-04-30 Price Changed $236,763 Stellar MLS as Distributed by MLS Grid
- 2026-04-29 Price Changed $236,863 Stellar MLS as Distributed by MLS Grid
- 2026-04-28 Price Changed $236,963 Stellar MLS as Distributed by MLS Grid
- 2026-04-27 Price Changed $237,063 Stellar MLS as Distributed by MLS Grid
- 2026-04-24 Price Changed $237,163 Stellar MLS as Distributed by MLS Grid
- 2026-04-23 Price Changed $237,263 Stellar MLS as Distributed by MLS Grid
- 2026-04-22 Price Changed $237,363 Stellar MLS as Distributed by MLS Grid
- 2026-04-21 Price Changed $237,463 Stellar MLS as Distributed by MLS Grid
- 2026-04-20 Price Changed $237,563 Stellar MLS as Distributed by MLS Grid
- 2026-04-17 Price Changed $237,663 Stellar MLS as Distributed by MLS Grid
- 2026-04-16 Price Changed $237,763 Stellar MLS as Distributed by MLS Grid
- 2026-04-14 Price Changed $237,863 Stellar MLS as Distributed by MLS Grid
- 2026-04-13 Price Changed $237,963 Stellar MLS as Distributed by MLS Grid
- 2026-04-10 Price Changed $238,063 Stellar MLS as Distributed by MLS Grid
- 2026-04-09 Price Changed $238,163 Stellar MLS as Distributed by MLS Grid
- 2026-04-08 Price Changed $238,263 Stellar MLS as Distributed by MLS Grid
- 2026-04-07 Price Changed $238,363 Stellar MLS as Distributed by MLS Grid
- 2026-04-06 Price Changed $238,463 Stellar MLS as Distributed by MLS Grid
- 2026-04-06 Price Changed $238,562 Stellar MLS as Distributed by MLS Grid
- 2026-04-03 Price Changed $238,563 Stellar MLS as Distributed by MLS Grid
- 2026-04-02 Price Changed $238,663 Stellar MLS as Distributed by MLS Grid
- 2026-04-01 Price Changed $238,763 Stellar MLS as Distributed by MLS Grid
- 2026-03-31 Price Changed $238,863 Stellar MLS as Distributed by MLS Grid
- 2026-03-30 Price Changed $238,963 Stellar MLS as Distributed by MLS Grid
- 2026-03-30 Price Changed $239,062 Stellar MLS as Distributed by MLS Grid
- 2026-03-27 Price Changed $239,063 Stellar MLS as Distributed by MLS Grid
- 2026-03-25 Price Changed $239,263 Stellar MLS as Distributed by MLS Grid
- 2026-03-24 Price Changed $239,264 Stellar MLS as Distributed by MLS Grid
- 2026-03-23 Price Changed $239,265 Stellar MLS as Distributed by MLS Grid
- 2026-03-20 Price Changed $239,266 Stellar MLS as Distributed by MLS Grid
- 2026-03-19 Price Changed $239,267 Stellar MLS as Distributed by MLS Grid
- 2026-03-18 Price Changed $239,269 Stellar MLS as Distributed by MLS Grid
- 2026-03-17 Price Changed $239,289 Stellar MLS as Distributed by MLS Grid
- 2026-03-16 Price Changed $239,270 Stellar MLS as Distributed by MLS Grid
- 2026-03-13 Price Changed $239,271 Stellar MLS as Distributed by MLS Grid
- 2026-03-12 Price Changed $239,272 Stellar MLS as Distributed by MLS Grid
- 2026-03-11 Price Changed $239,273 Stellar MLS as Distributed by MLS Grid
- 2026-03-10 Price Changed $239,274 Stellar MLS as Distributed by MLS Grid
- 2026-03-09 Price Changed $239,275 Stellar MLS as Distributed by MLS Grid
- 2026-03-06 Price Changed $239,276 Stellar MLS as Distributed by MLS Grid
- 2026-03-05 Price Changed $239,277 Stellar MLS as Distributed by MLS Grid
- 2026-03-04 Price Changed $239,278 Stellar MLS as Distributed by MLS Grid
- 2026-03-03 Price Changed $239,279 Stellar MLS as Distributed by MLS Grid
- 2026-03-02 Price Changed $239,280 Stellar MLS as Distributed by MLS Grid
- 2026-02-27 Price Changed $239,281 Stellar MLS as Distributed by MLS Grid
- 2026-02-26 Price Changed $239,282 Stellar MLS as Distributed by MLS Grid
- 2026-02-25 Price Changed $239,283 Stellar MLS as Distributed by MLS Grid
- 2026-02-24 Price Changed $239,284 Stellar MLS as Distributed by MLS Grid
- 2026-02-23 Price Changed $239,285 Stellar MLS as Distributed by MLS Grid
- 2026-02-22 Price Changed $239,286 Stellar MLS as Distributed by MLS Grid
- 2026-02-20 Price Changed $239,386 Stellar MLS as Distributed by MLS Grid
- 2026-02-19 Price Changed $239,387 Stellar MLS as Distributed by MLS Grid
- 2026-02-18 Price Changed $239,388 Stellar MLS as Distributed by MLS Grid
- 2026-02-17 Price Changed $239,389 Stellar MLS as Distributed by MLS Grid
- 2026-02-16 Price Changed $239,390 Stellar MLS as Distributed by MLS Grid
- 2026-02-14 Price Changed $239,391 Stellar MLS as Distributed by MLS Grid
- 2026-02-13 Price Changed $239,491 Stellar MLS as Distributed by MLS Grid
- 2026-02-12 Price Changed $239,492 Stellar MLS as Distributed by MLS Grid
- 2026-02-11 Price Changed $239,493 Stellar MLS as Distributed by MLS Grid
- 2026-02-10 Price Changed $239,494 Stellar MLS as Distributed by MLS Grid
- 2026-02-09 Price Changed $239,495 Stellar MLS as Distributed by MLS Grid
- 2026-02-07 Price Changed $239,496 Stellar MLS as Distributed by MLS Grid
- 2026-02-06 Price Changed $239,596 Stellar MLS as Distributed by MLS Grid
- 2026-02-05 Price Changed $239,597 Stellar MLS as Distributed by MLS Grid
- 2026-02-04 Price Changed $239,598 Stellar MLS as Distributed by MLS Grid
- 2026-02-03 Price Changed $239,599 Stellar MLS as Distributed by MLS Grid
- 2026-01-25 Price Changed $239,600 Stellar MLS as Distributed by MLS Grid
- 2026-01-09 Price Changed $239,700 Stellar MLS as Distributed by MLS Grid
- 2026-01-04 Price Changed $239,800 Stellar MLS as Distributed by MLS Grid
- 2025-12-18 Price Changed $239,900 Stellar MLS as Distributed by MLS Grid
- 2025-12-12 Price Changed $249,400 Stellar MLS as Distributed by MLS Grid
- 2025-12-06 Price Changed $249,500 Stellar MLS as Distributed by MLS Grid
- 2025-11-28 Price Changed $249,600 Stellar MLS as Distributed by MLS Grid
- 2025-11-21 Price Changed $249,700 Stellar MLS as Distributed by MLS Grid
- 2025-11-14 Price Changed $249,800 Stellar MLS as Distributed by MLS Grid
- 2025-10-24 Listed $249,900 Stellar MLS as Distributed by MLS Grid
- 2025-07-31 Sold (MLS) $25,900 Stellar MLS as Distributed by MLS Grid
- 2025-07-09 Pending — Stellar MLS as Distributed by MLS Grid
- 2025-06-16 Listed $29,500 Stellar MLS as Distributed by MLS Grid
- 2024-12-21 Listing Removed — Stellar MLS as Distributed by MLS Grid
- 2024-03-06 Relisted — Stellar MLS as Distributed by MLS Grid
- 2024-03-04 Pending — Stellar MLS as Distributed by MLS Grid
- 2024-03-01 Relisted — Stellar MLS as Distributed by MLS Grid
- 2024-02-29 Pending — Stellar MLS as Distributed by MLS Grid
Cash-flow waterfall
monthlySold comps — $/sqft
last 12 mo · ≤1 miLoading sold comps…