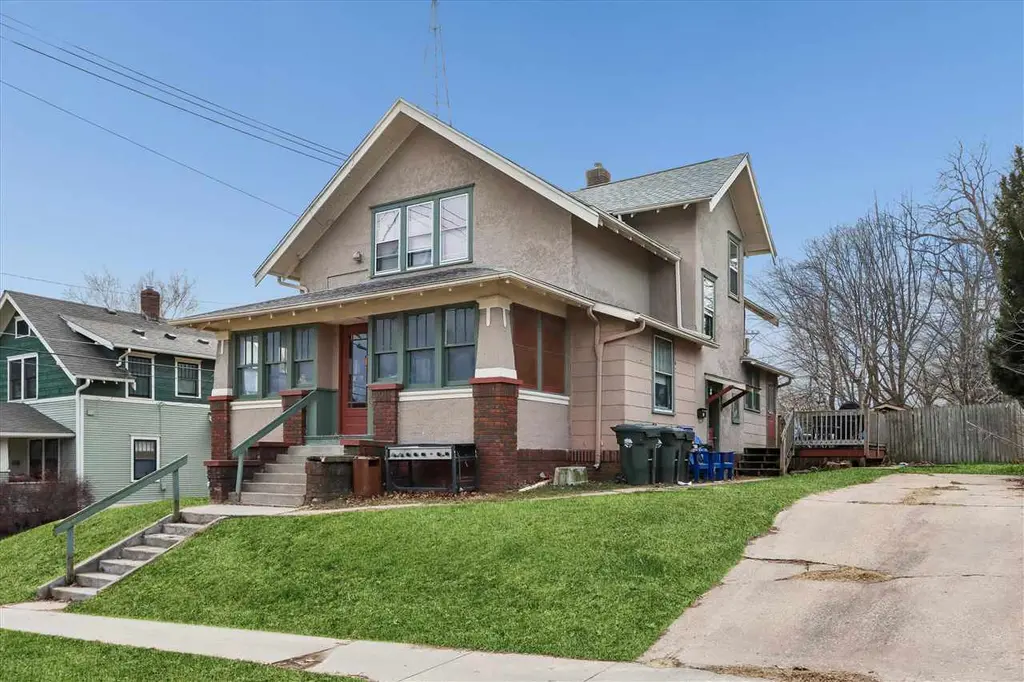
727 N Dodge St · Iowa City, IA
Flood risk 1/10 · Minimal
- FEMA flood zone
- X (unshaded)
- Chance of flooding over 30 yrs
- 0.0%
- Est. flood insurance / yr
- $473 – $860
Fire risk 1/10 · Minimal
- Est. fire insurance / yr
- $902 – $1,676
Heat risk 3/10 · Minor
- Hot days now (above 105°F)
- 7 days/yr
- Hot days in 30 yrs
- 16 days/yr
Wind risk 2/10 · Minimal
- Chance of severe wind over 30 yrs
- —
Air-quality risk 2/10 · Minimal
- Unhealthy air days now
- 1 days/yr
- Unhealthy air days in 30 yrs
- 2 days/yr
Risk factors via First Street. Map © Google.
Why this score? — see what drove the D+ grade
The composite is a weighted blend of 9 inputs, each scored 0–100. Each bar is that input's sub-score; the figure is the points it added to the 100-point composite (weight × sub-score).
- ARV discount +15.0/15.0
- Cash flow +8.5/30.0
- Schools +5.7/10.0
- Livability +4.3/5.0
- Rent growth +4.1/5.0
- 1% rule +2.6/10.0
- Condition / age +2.5/5.0
- DSCR +2.3/10.0
- Appreciation +0.0/10.0
$269,900
🖨 Deal sheet (PDF) 📄 Offer letter ✓ Due diligence
Listing remarks MLS
3 bedroom, 2 bathroom single family home located in Iowa City. Main floor features one bedroom and one full bath. Second floor has two bedrooms, and a full bath. Lots of original woodwork still intact. Unfinished basement has washer and dryer and plenty of storage space as well as a single attached garage stall. Rented through July 2027.
Key facts
- 3,485 sq ft lot
- Garage
- Built 1910
Neighborhood map
What this means for you Summary
Snapshot
- This is a 3-bed/2.0-bath single-family listed at $270k.
Deal economics
- At list price, monthly cash flow is $-239 ($-3k/yr) — negative.
- To cash-flow at today's rent, offer at most $235k (12.8% below list).
- To meet the 1% rule (rent ≥ 1% of price), the offer needs to be $206k (23.7% below list).
- Recommended offer: $206k (23.7% below list) — sets the bar for 1% rule.
- Cap rate 5.2% vs local median 2.7% in Iowa City — top-decile yield for the area; either an underpriced asset or a hidden risk that comps aren't pricing in. Stress-test before assuming the spread holds.
Location & tenants
- Location reads 86/100 on livability (#13 in IA, #450 nationally) — a professional / high-income tenant draw. Strengths: amenities A+, commute A+, cost of living A+.
- Iowa City Community School District (urban): math 65% / reading 70% proficiency, ranked #174 of 289 in IA (top 60%) — acceptable for families but not a draw, mixed tenant base, ~2y average lease.
- Zoned schools: Horace Mann Elementary School (math 57% / reading 67%, grade B, #363 of 616 statewide, top 62%, 213 students, 35% FRL); Southeast Junior High School (math 64% / reading 68%, grade A-, #152 of 246 statewide, top 62%, 812 students, 50% FRL); Iowa City High School (math 62% / reading 73%, grade B, #186 of 336 statewide, top 57%, 1,599 students, 40% FRL).
- Market conditions: Rents rising fast (+6.3%/yr); 261 active listings in the ZIP; 6 comparable units currently listed for rent nearby; rentals lingering (median 46d on market — plan ~5-8 weeks vacancy on turnover, expect pricing pressure); 100% of comp listings sitting > 30 days — soft ceiling on asking rent; 714 units permitted in Johnson County in 2024 (158 in 5+ unit buildings).
- At $2,059/mo this rent would consume 47% of the median local household income ($53k/yr) (locally 2852% of renters already pay >50% of income on rent) — very limited rent-growth headroom before tenants either downsize or default.
Forward outlook
- Local home prices are declining (-3.0%/yr); year-one equity from $2k of loan paydown is wiped out by about $8k of value loss. Plan a longer hold.
- Johnson County population projected at +60% by 2050 — long-run rental-demand tailwind backs the buy-and-hold thesis.
Negotiation context
- It's been on market 166 days — a 12% lower offer ($238k) is reasonable based on typical stale-listing flexibility.
Risks & watch-outs
- Watch-outs: built in 1910 — expect roof / HVAC / electrical / plumbing capex.
Questions for the listing agent
- What do current leases actually rent for vs. the listed asking? Can we see a recent rent roll and the last 12 months of T-12 income?
- It's been on market 166 days. Have you received any prior offers? Is the seller open to a 24% concession, seller financing, or rate buy-down credit?
- Built in 1910 — when were the roof, HVAC, electrical panel, plumbing, and water heater last replaced?
- Why hasn't it sold? Are there any deal-killer items the seller is aware of (foundation, flood, title, zoning, code violations)?
- Is there a deadline driving the sale (1031 exchange, divorce, estate, relocation)? That informs how much negotiation room exists.
- Schools are A-rated — typically a magnet for longer-tenancy family renters. What's the average tenant stay here, and is there a school-zone premium baked into asking?
- The area grade is low — what's the realistic commute time and amenity access for the typical tenant pool here? Any planned neighborhood developments (good or bad) we should know about?
- What's the average days-on-market for RENTAL listings here right now (not sales)? A rising rental-DOM trend means longer vacancies and softer asking-rent achievability than the comps imply.
- What's the recent tenant-quality profile in this submarket — average credit score on applications, eviction rate, late-payment / NSF rate, and stable-employment percentage? A property-management company in the area should have these aggregated.
- How much new for-sale + rental construction is in the pipeline within 1–3 miles? Heavy new supply typically softens prices + rents 12–24 months out; constrained supply supports both.
Investment metrics
- 1% rule
- 0.76% ✗
- Cap rate
- 5.23%
- Cash-on-cash
- -3.79%
- DSCR
- 0.83
- GRM
- 10.9
CMA / ARV
- ARV (median comp)
- $329,352
- List price
- $269,900
- Delta
- -18.05%
- Verdict
- UNDERPRICED
- Comps
- 20 within 1.0 mi
Show comp detail 12 sales within ~0.75 mi
| Address | Dist | Beds/Ba | Sqft | Sold | Price | $/sf | Match |
|---|---|---|---|---|---|---|---|
| 427 Brown St | 0.16mi | 3/1.5 | 1,787 (+2%) | 4mo | $360,000 | $201 | 83 |
| 523 Brown St | 0.09mi | 4/1.5 (+1) | 1,887 (+8%) | 6mo | $435,000 | $231 | 70 |
| 314 E Davenport St | 0.36mi | 3/2.0 | 1,592 (-9%) | 12mo | $265,000 | $166 | 59 |
| 1345 E Davenport St | 0.62mi | 4/2.0 (+1) | 1,766 (+1%) | 9mo | $287,500 | $163 | 57 |
| 1225 Rochester Ave | 0.61mi | 3/2.0 | 1,817 (+4%) | 12mo | $322,350 | $177 | 54 |
| 715 E Market St | 0.44mi | 3/2.0 | 1,540 (-12%) | 10mo | $315,000 | $205 | 51 |
| 329-329.5 N Governor St | 0.32mi | 3/2.0 | 2,002 (+15%) | 11mo | $299,000 | $149 | 51 |
| 804 E Market St | 0.42mi | 4/1.5 (+1) | 1,983 (+14%) | 4mo | $360,000 | $182 | 47 |
| 107 S Lucas St | 0.69mi | 4/2.0 (+1) | 1,644 (-6%) | 9mo | $233,350 | $142 | 46 |
| 134 Parsons Ave | 0.70mi | 3/1.5 | 1,861 (+7%) | 11mo | $630,000 | $339 | 45 |
| 1307 Rochester Ave | 0.63mi | 3/1.0 | 1,552 (-11%) | 12mo | $395,000 | $255 | 38 |
| 1114 Prairie Du Chien Rd | 0.57mi | 2/2.0 (-1) | 2,005 (+15%) | 8mo | $193,529 | $97 | 36 |
Match score weights: distance 35% · size 25% · config 20% · recency 20%. Top-matched comps best support the ARV.
Projected returns pro-forma
-3.0% appreciation · 6.32% rent growth · sell at horizon
- IRR
- -19.0%
- Equity multiple
- 0.31×
- Total profit
- $-51,797
- Equity at exit
- $40,243
- IRR
- -6.0%
- Equity multiple
- 0.56×
- Total profit
- $-33,327
- Equity at exit
- $23,336
Cash invested: $75,572 (down + closing). Projections, not guarantees.
Landlord ↔ Tenant lean methodology
- Overall (STATE)
- 83 Strongly Landlord-Friendly
- State Iowa
- 83 Strongly Landlord-Friendly · R+6
- County
- — inherits STATE
- City
- — inherits STATE
ZIP-level market 52240
- Rents YoY
- 6.3%
- Active inventory
- 261
- Price-to-rent
- 10.9×
Monthly cashflow live
- Estimated rent
- $2,059 high interval (Pro) →
- Mortgage (P&I)
- −$1,415
- Tax est. 1.5%
- −$337 /mo · $4,048/yr
- Insurance
- −$112
- HOA
- −$0
- Vacancy / Maint / Mgmt
- −$432
- Net cashflow
- $-239
Break-even live
Sensitivity live
| Price | -10% $-52 | -5% $-145 | +0% $-239 | +5% $-332 | +10% $-425 |
|---|---|---|---|---|---|
| Rent | -10% $-401 | -5% $-320 | +0% $-239 | +5% $-157 | +10% $-76 |
| Rate | -1.0pp $-103 | -0.5pp $-170 | base $-239 | +0.5pp $-309 | +1.0pp $-380 |
UW: 25.0% down · 7.5% · 30yr · 1.5% tax · 5.0% vac · 8.0% maint · 8.0% mgmt
Financing live
Cash to close
- Down payment
- $67,475
- Closing costs
- $8,097
- Reserves months
- —
- Total cash needed
- —
Loan-product check · same deal, 3 products live
Conventional
25% down · 7.5% · 30yr
- Down + closing
- —
- Monthly P&I
- —
- Monthly cashflow
- —
- DSCR
- —
- Eligible?
- —
Personal DTI + credit; lowest rate.
DSCR
20% down · 8.5% · 30yr
- Down + closing
- —
- Monthly P&I
- —
- Monthly cashflow
- —
- DSCR
- —
- Eligible?
- —
No personal income docs; deal must DSCR.
Hard money
10% down · 12.0% · 12mo
- Down + closing
- —
- Monthly P&I
- —
- Monthly cashflow
- —
- DSCR
- —
- Eligible?
- —
Short-term bridge; refi at stabilization.
Rent comps 6 comps
| Address | Beds | Baths | Sqft | Rent | $/sqft | DOM | Units | Dist |
|---|---|---|---|---|---|---|---|---|
| 520 Church St Iowa City, IA | 3.0 | 1.5 | 1359 | $2,250 | $1.66 | 45d | 1 | 0.16mi |
| 909 N Governor St Iowa City, IA | 4.0 | 1.0 | 1484 | $2,400 | $1.62 | 45d | 1 | 0.19mi |
| 12 N Dodge St Iowa City, IA | 4.0 | 2.0 | 1120 | $2,695 | $2.41 | 45d | 1 | 0.57mi |
| 1154 Hotz Ave Iowa City, IA | 2.0 | 2.5 | 1482 | $2,450 | $1.65 | 45d | 1 | 0.65mi |
| 704 Bowery St Iowa City, IA | 3.0 | 1.5 | 1400 | $1,500 | $1.07 | 45d | 1 | 1.09mi |
| 215 Melrose Ct Iowa City, IA | 3.0 | 1.0 | 1400 | $2,400 | $1.71 | 45d | 1 | 1.43mi |
Listing history 20 events
-
2026-06-22days on market $269,900 Active 166 DOM
-
2026-06-19days on market $269,900 Active 164 DOM
-
2026-06-18days on market $269,900 Active 163 DOM
-
2026-06-17days on market $269,900 Active 162 DOM
-
2026-06-16days on market $269,900 Active 161 DOM
-
2026-06-15days on market $269,900 Active 160 DOM
-
2026-06-14days on market $269,900 Active 158 DOM
-
2026-06-13days on market $269,900 Active 157 DOM
-
2026-06-10days on market $269,900 Active 155 DOM
-
2026-06-09days on market $269,900 Active 154 DOM
-
2026-06-08days on market $269,900 Active 153 DOM
-
2026-06-07days on market $269,900 Active 152 DOM
-
2026-06-05days on market $269,900 Active 149 DOM
-
2026-06-03days on market $269,900 Active 148 DOM
-
2026-06-02days on market $269,900 Active 147 DOM
-
2026-06-01days on market $269,900 Active 146 DOM
-
2026-05-31days on market $269,900 Active 145 DOM
-
2026-05-30days on market $269,900 Active 144 DOM
-
2026-03-25price $269,900 339-char remark
Show marketing remark (339 chars)
3 bedroom, 2 bathroom single family home located in Iowa City. Main floor features one bedroom and one full bath. Second floor has two bedrooms, and a full bath. Lots of original woodwork still intact. Unfinished basement has washer and dryer and plenty of storage space as well as a single attached garage stall. Rented through July 2027.
-
2026-01-06$279,900 Active 339-char remark
Show marketing remark (339 chars)
3 bedroom, 2 bathroom single family home located in Iowa City. Main floor features one bedroom and one full bath. Second floor has two bedrooms, and a full bath. Lots of original woodwork still intact. Unfinished basement has washer and dryer and plenty of storage space as well as a single attached garage stall. Rented through July 2027.
ⓘ Source: listings_history table (triggers on properties + properties_extension) + one-shot
backfill from property_details.listing_events for pre-trigger history.
Climate risk First Street
- Flood 1/10 Low FEMA zone X (unshaded) · 0% chance over 30 yrs
- Wildfire 1/10 Low
- Heat 3/10 Moderate 7 d/yr ≥105°F today · 16 d/yr by 30 yrs out
- Wind 2/10 Low
- Air quality 2/10 Low 1 unhealthy d/yr today · 2 by 30 yrs out
Nearby sold comps map
Loading sold comps map…
Walkable amenities ~0.75 mi
Loading nearby amenities…
Taxation est. · year 1
- Rental income
- $24,707
- − Mortgage interest
- −$15,119
- − Property taxes
- −$4,048
- − Insurance
- −$1,350
- − Repairs & maintenance
- −$1,977
- − Management
- −$1,977
- − Depreciation
- −$7,852
- Taxable loss
- −$7,614
- Est. tax savings @ 24.0%
- +$1,827
- After-tax cash flow
- $-1,036/yr
For passive investors: Depreciation is non-cash, so a rental often shows a tax loss while cash-flowing — sheltering income. Rental losses are passive: they offset passive income freely, and up to $25,000/yr can offset ordinary (W-2) income if you actively participate and your MAGI is under $100k (phasing out to $0 by $150k); unused losses carry forward. On sale, claimed depreciation is recaptured at up to 25%, and gains may owe capital-gains tax (a 1031 exchange can defer both). Figures are a year-1 estimate at your 24.0% rate — not tax advice; consult a CPA.
Schools (NCES district)
- District
- Iowa City Community School District
- NCES district ID
- 1914700
- Math proficiency
- 65% ▼ -6.00%
- Reading proficiency
- 70% ▲ 2.00%
- Median HH income
- $50,229
- Composite
- 57.3/100
- National rank
- #1088
- State rank
- #174 of 289 in IA
Livability — Iowa City
- Score
- 86/100
- State rank
- #13
- US rank
- #450
Category grades
Schools grade is shown separately in the Schools card above.
Census & demographics
- Census place
- Iowa City, IA
- County
- Johnson County · 132,710 people
- City population
- 80,235
- Metro
- Iowa City, IA
- Population (ZIP)
- 35,074
- Household income
- $52,960
- Rent vs Own
- Severe rent burden
- 2852.0
Population outlook (Johnson County) Hauer SSP2
- Today (2025)
- 180,405 people
- By 2030
- 200,014 · +10.9%
- By 2040
- 241,428 · +33.8%
- By 2050
- 288,144 · +59.7%
- By 2075
- 420,009 · +132.8%
- By 2100
- 546,596 · +203.0%
Race, ethnicity, and origin ACS 2023
- Neighborhood character
- Predominantly White (71%)
- Race & ethnicity
- White 71% Hispanic / Latino 11% Black 9% Two or more races 8% Asian 5%
- Hispanic origin (detail)
- Mexican 6% Puerto Rican 1%
- Common ancestry
- Portuguese 3% Romanian 2% Iranian 2%
- Foreign-born
- 12% · Canada, Vietnam, China
- Languages at home
- 81% English-only · Spanish 8% French/Haitian/Cajun 2% Arabic 2%
Political lean MEDSL · Johnson
- 2024 margin
- Solid D (+38.1) · D 68.4% · R 30.3% · Other 1.3%
- 2008→2024 swing
- -3.4pp toward R · 2008: 41.5pp · 2024: 38.1pp
- All cycles
- 2024: D+38.1 2020: D+43.2 2016: D+38.3 2012: D+35.4 2008: D+41.5
Not yet ingested
- Civics
- —
Market trends
- HPI YoY
- ▼ -202.53%
- Current HPI
- 170.7491
- Rent YoY
- ▲ 6.32%
- Metro
- Iowa City, IA
- State GDP YoY
- ▲ 2.48%
- F500 in state
- 4
Industry mix (Fortune 500 HQ in IA)
| Industry | F500 HQs | Revenue |
|---|---|---|
| Financial Services | 1 | $16B |
|
||
| Retail / Convenience | 1 | $15B |
|
||
Price history
-3.6% since first listed2 events — show timeline
- 2026-03-25 Price Changed $269,900 ICAARMLS
- 2026-01-06 Listed $279,900 ICAARMLS
Cash-flow waterfall
monthlySold comps — $/sqft
last 12 mo · ≤1 miLoading sold comps…