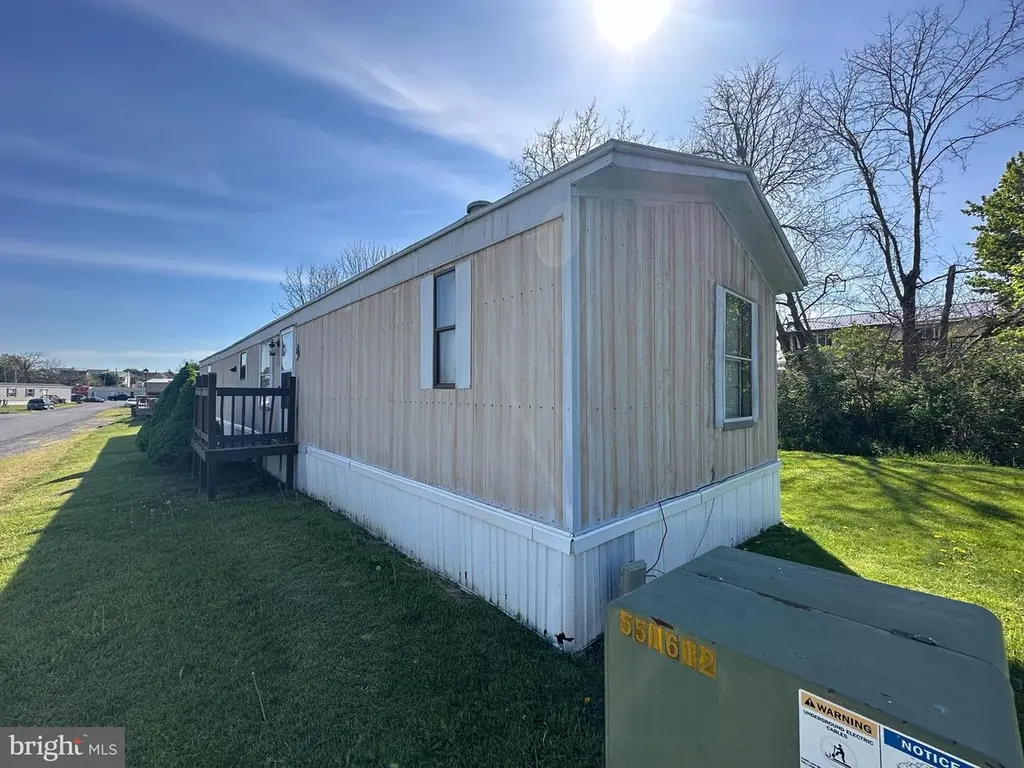
49 Hillside Ests · Todd, PA
Flood risk No data
- FEMA flood zone
- —
- Chance of flooding over 30 yrs
- —
- Est. flood insurance / yr
- —
Fire risk No data
- Est. fire insurance / yr
- —
Heat risk No data
- Hot days now (above threshold)
- —
- Hot days in 30 yrs
- —
Wind risk No data
- Chance of severe wind over 30 yrs
- —
Air-quality risk No data
- Unhealthy air days now
- —
- Unhealthy air days in 30 yrs
- —
Risk factors via First Street. Map © Google.
Why this score? — see what drove the D grade
The composite is a weighted blend of 9 inputs, each scored 0–100. Each bar is that input's sub-score; the figure is the points it added to the 100-point composite (weight × sub-score).
- Cash flow +15.0/30.0
- ARV discount +7.5/15.0
- 1% rule +5.0/10.0
- DSCR +5.0/10.0
- Schools +3.8/10.0
- Rent growth +2.5/5.0
- Livability +2.5/5.0
- Condition / age +2.5/5.0
- Appreciation +0.0/10.0
$10,000
🖨 Deal sheet (PDF) 📄 Offer letter ✓ Due diligence
Listing remarks MLS
LOT RENT 210. TRASH INCLUDED. MOBILE REMODELED AUG 2014
Key facts
- Built 1988
- Listed 11 days
Property features AI
Finance
- Financial info: Ground rent $350 per month; Ownership interest: Ground rent
Exterior
- Parking: On-street parking
- Utilities: Public water; Public sewer
- Home design: Manufactured home; Metal siding
- Construction: Estimated year built; Above-grade living space
- Exterior features: No basement; No tidal water
Interior
- Bedrooms: 3 bedrooms on the main level
- Bathrooms: 2 full bathrooms on the main level; 2 full bathrooms total
- Heating & cooling: Forced air heating (electric); Window air conditioning units (electric); Electric hot water
- Interior features: Estimated living area
Neighborhood map
What this means for you Summary
Snapshot
- This is a 3-bed/2.0-bath manufactured listed at $10k.
Deal economics
- At list price, monthly cash flow is $771 ($9k/yr) — positive.
- The deal already cash-flows at list — no discount required.
- Meets the 1% rule at list price ($1k rent vs $10k).
Location & tenants
- Location reads: area grade D — affects rentability + tenant quality, not the cash-flow math above.
- Central Fulton SD (rural): math 36% / reading 54% proficiency, ranked #278 of 539 in PA (top 52%) — families likely to look elsewhere, expect single-tenant / working-renter base with shorter leases.
- Market conditions: 32 active listings in the ZIP; 18 units permitted in Fulton County in 2024 (0 in 5+ unit buildings).
Forward outlook
- Local home prices are declining (-3.0%/yr); year-one equity from $69 of loan paydown is wiped out by about $300 of value loss. Plan a longer hold.
- Fulton County population projected at -25% by 2050 — secular population decline; favor cash flow + early exit over multi-decade hold.
- At projected returns (-3.0% appreciation + 3.0% rent growth), your $3k cash investment doubles in ~1 year — after that, you're playing with house money.
Negotiation context
- Only 11 days on market — expect competitive offers; lowballing is unlikely to land.
- 3 sale attempts since 12y ago with the ask held roughly flat each time — persistent listings suggest the price (not the market) is what's stuck; bring a comps-based counter.
Questions for the listing agent
- Is there a deadline driving the sale (1031 exchange, divorce, estate, relocation)? That informs how much negotiation room exists.
- The area grade is low — what's the realistic commute time and amenity access for the typical tenant pool here? Any planned neighborhood developments (good or bad) we should know about?
- What's the average days-on-market for RENTAL listings here right now (not sales)? A rising rental-DOM trend means longer vacancies and softer asking-rent achievability than the comps imply.
- What's the recent tenant-quality profile in this submarket — average credit score on applications, eviction rate, late-payment / NSF rate, and stable-employment percentage? A property-management company in the area should have these aggregated.
- How much new for-sale + rental construction is in the pipeline within 1–3 miles? Heavy new supply typically softens prices + rents 12–24 months out; constrained supply supports both.
Investment metrics
- 1% rule
- 10.63% ✓
- Cap rate
- 98.78%
- Cash-on-cash
- 330.31%
- DSCR
- 15.70
- GRM
- 0.8
CMA / ARV
No comps found within radius.
Projected returns pro-forma
-3.0% appreciation · 3.0% rent growth · sell at horizon
- IRR
- —
- Equity multiple
- 17.96×
- Total profit
- $47,484
- Equity at exit
- $1,491
- IRR
- —
- Equity multiple
- 38.37×
- Total profit
- $104,623
- Equity at exit
- $865
Cash invested: $2,800 (down + closing). Projections, not guarantees.
Landlord ↔ Tenant lean methodology
- Overall (STATE)
- 62 Landlord-Friendly
- State Pennsylvania
- 62 Landlord-Friendly · EVEN
- County
- — inherits STATE
- City
- — inherits STATE
ZIP-level market 17233
- Home prices YoY
- -25.5%
- Active inventory
- 32
- Price-to-rent
- 0.8×
Monthly cashflow live
- Estimated rent
- $1,063 medium interval (Pro) →
- Mortgage (P&I)
- −$52
- Tax est. 1.5%
- −$12 /mo · $150/yr
- Insurance
- −$4
- HOA
- −$0
- Vacancy / Maint / Mgmt
- −$223
- Net cashflow
- $771
Break-even live
Sensitivity live
| Price | -10% $778 | -5% $774 | +0% $771 | +5% $767 | +10% $764 |
|---|---|---|---|---|---|
| Rent | -10% $687 | -5% $729 | +0% $771 | +5% $813 | +10% $855 |
| Rate | -1.0pp $776 | -0.5pp $773 | base $771 | +0.5pp $768 | +1.0pp $766 |
UW: 25.0% down · 7.5% · 30yr · 1.5% tax · 5.0% vac · 8.0% maint · 8.0% mgmt
Financing live
Cash to close
- Down payment
- $2,500
- Closing costs
- $300
- Reserves months
- —
- Total cash needed
- —
Loan-product check · same deal, 3 products live
Conventional
25% down · 7.5% · 30yr
- Down + closing
- —
- Monthly P&I
- —
- Monthly cashflow
- —
- DSCR
- —
- Eligible?
- —
Personal DTI + credit; lowest rate.
DSCR
20% down · 8.5% · 30yr
- Down + closing
- —
- Monthly P&I
- —
- Monthly cashflow
- —
- DSCR
- —
- Eligible?
- —
No personal income docs; deal must DSCR.
Hard money
10% down · 12.0% · 12mo
- Down + closing
- —
- Monthly P&I
- —
- Monthly cashflow
- —
- DSCR
- —
- Eligible?
- —
Short-term bridge; refi at stabilization.
Listing history 6 events
-
2026-05-12status Pending 744-char remark
-
2026-05-01$10,000 Active 744-char remark
-
2014-09-04soldstatus $12,500 55-char remark
Show marketing remark (55 chars)
LOT RENT 210. TRASH INCLUDED. MOBILE REMODELED AUG 2014
-
2014-09-04soldstatus $12,500
Show marketing remark (55 chars)
LOT RENT 210. TRASH INCLUDED. MOBILE REMODELED AUG 2014
-
2014-09-04$12,500 55-char remark
Show marketing remark (55 chars)
LOT RENT 210. TRASH INCLUDED. MOBILE REMODELED AUG 2014
-
2014-09-04$12,500
Show marketing remark (55 chars)
LOT RENT 210. TRASH INCLUDED. MOBILE REMODELED AUG 2014
ⓘ Source: listings_history table (triggers on properties + properties_extension) + one-shot
backfill from property_details.listing_events for pre-trigger history.
Nearby sold comps map
Loading sold comps map…
Walkable amenities ~0.75 mi
Loading nearby amenities…
Taxation est. · year 1
- Rental income
- $12,757
- − Mortgage interest
- −$560
- − Property taxes
- −$150
- − Insurance
- −$50
- − Repairs & maintenance
- −$1,021
- − Management
- −$1,021
- − Depreciation
- −$291
- Taxable income
- $9,665
- Est. tax owed @ 24.0%
- −$2,320
- After-tax cash flow
- $6,929/yr
For passive investors: Depreciation is non-cash, so a rental often shows a tax loss while cash-flowing — sheltering income. Rental losses are passive: they offset passive income freely, and up to $25,000/yr can offset ordinary (W-2) income if you actively participate and your MAGI is under $100k (phasing out to $0 by $150k); unused losses carry forward. On sale, claimed depreciation is recaptured at up to 25%, and gains may owe capital-gains tax (a 1031 exchange can defer both). Figures are a year-1 estimate at your 24.0% rate — not tax advice; consult a CPA.
Schools (NCES district)
- District
- Central Fulton SD
- NCES district ID
- 4214850
- Math proficiency
- 36% ▼ -14.00%
- Reading proficiency
- 54% ▼ -12.00%
- Median HH income
- $45,014
- Composite
- 38.09/100
- National rank
- #4278
- State rank
- #278 of 539 in PA
Livability — Todd
No livability data for this city. (Only ~50 U.S. cities are tracked.)
Census & demographics
- Population (ZIP)
- 5,103
Population outlook (Fulton County) Hauer SSP2
- Today (2025)
- 13,762 people
- By 2030
- 13,167 · -4.3%
- By 2040
- 11,836 · -14.0%
- By 2050
- 10,342 · -24.9%
- By 2075
- 7,170 · -47.9%
- By 2100
- 4,581 · -66.7%
Race, ethnicity, and origin ACS 2023
- Neighborhood character
- Predominantly White (92%)
- Race & ethnicity
- White 92% Black 3% Two or more races 2% Hispanic / Latino 1%
- Common ancestry
- Lithuanian 4% Slovak 2% Italian 2%
- Foreign-born
- 1%
- Languages at home
- 98% English-only · French/Haitian/Cajun 1%
Political lean MEDSL · Fulton
- 2024 margin
- Solid R (+72.6) · D 13.5% · R 86.1%
- 2008→2024 swing
- -24.0pp toward R · 2008: -48.6pp · 2024: -72.6pp
- All cycles
- 2024: R+72.6 2020: R+72.0 2016: R+70.8 2012: R+56.6 2008: R+48.6
Not yet ingested
- Civics
- —
Market trends
- HPI YoY
- ▼ -46.60%
- Current HPI
- 136.17
- Rent YoY
- —
- Metro
- —
- State GDP YoY
- ▲ 1.68%
- F500 in state
- 34
Industry mix (Fortune 500 HQ in PA)
| Industry | F500 HQs | Revenue |
|---|---|---|
| Healthcare | 2 | $309B |
|
||
| Insurance | 2 | $27B |
|
||
| Telecommunications / Media | 1 | $124B |
|
||
| Industrial Distribution | 1 | $22B |
|
||
| Financial Services | 1 | $20B |
|
||
| Chemicals / Materials | 1 | $18B |
|
||
Price history
+22.4% since first listed7 events — show timeline
- 2026-06-08 Sold (MLS) $15,300 BRIGHT MLS
- 2026-05-12 Pending — BRIGHT MLS
- 2026-05-01 Listed $10,000 BRIGHT MLS
- 2014-09-04 Listed $12,500 BRIGHT MLS
- 2014-09-04 Listed $12,500 MRIS
- 2014-09-04 Sold (MLS) $12,500 BRIGHT MLS
- 2014-09-04 Sold (MLS) $12,500 MRIS
Property tax history
+1.4%/yrLatest (2025): $879 · +5.2% YoY. Source: county tax records.
Cash-flow waterfall
monthlySold comps — $/sqft
last 12 mo · ≤1 miLoading sold comps…