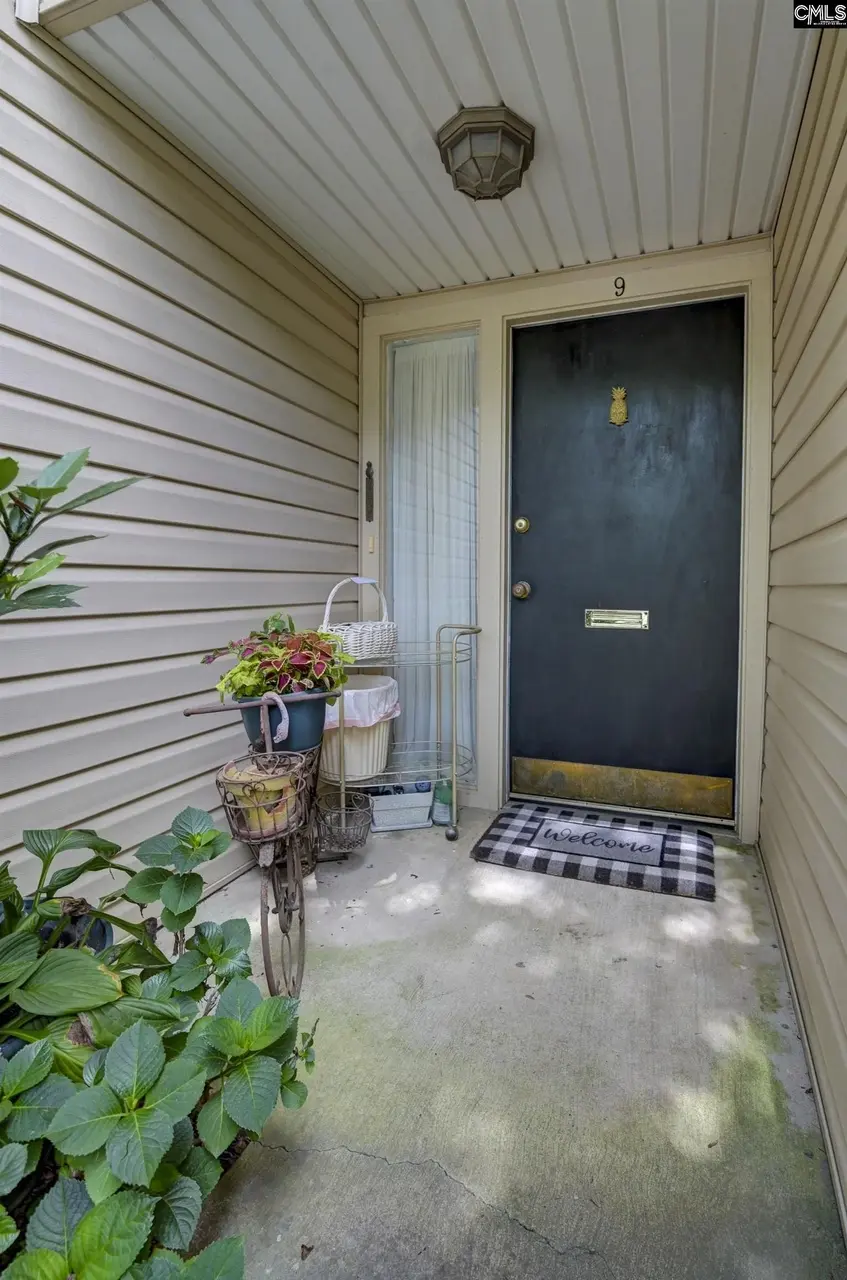
4443 Bethel Church Rd #9 · Forest Acres, SC
Flood risk No data
- FEMA flood zone
- —
- Chance of flooding over 30 yrs
- —
- Est. flood insurance / yr
- —
Fire risk No data
- Est. fire insurance / yr
- —
Heat risk No data
- Hot days now (above threshold)
- —
- Hot days in 30 yrs
- —
Wind risk No data
- Chance of severe wind over 30 yrs
- —
Air-quality risk No data
- Unhealthy air days now
- —
- Unhealthy air days in 30 yrs
- —
Risk factors via First Street. Map © Google.
Why this score? — see what drove the C grade
The composite is a weighted blend of 9 inputs, each scored 0–100. Each bar is that input's sub-score; the figure is the points it added to the 100-point composite (weight × sub-score).
- Cash flow +21.5/30.0
- 1% rule +10.0/10.0
- ARV discount +7.5/15.0
- DSCR +6.9/10.0
- Rent growth +3.7/5.0
- Livability +3.7/5.0
- Schools +2.6/10.0
- Condition / age +2.5/5.0
- Appreciation +0.0/10.0
$110,000
🖨 Deal sheet (PDF) 📄 Offer letter ✓ Due diligence
Listing remarks
Great opportunity in Forest Acres. 1850sf 3 bedroom and 3 full bathrooms end unit with a peaceful back patio overlooking a small creek, 2 assigned parking spaces in front of the unit and an additional guest parking space. The unit has had only 2 owners and has never been rented. The current owner has lived there 35 years and has lovingly maintained the interior with new light fixtures, ceiling fans, toilets, neutral paint and carpet, ceramic tile in the bathrooms, and porcelain tile in the foyer and kitchen. The first floor flows easily from one room to the next beginning in the foyer which leads to the spacious dining room, living room, and kitchen. the foyer has a large storage closet. Th
Key facts
- Large storage closet
- Guest parking space
- Peaceful back patio
Tags
Property features AI
Finance
- Other: Sidewalk community
- HOA & community: Has association; Association maintains front and back yard, landscaping, common and exterior areas, roads and sidewalks; Community amenities include clubhouse and pool; Association covers trash, water, sewer, pest control, and green area maintenance
Exterior
- Parking: 2 parking spaces
- Utilities: Public water; Public sewer
- Home design: 3-story end unit; House faces east
- Construction: Slab foundation
- Exterior features: Patio; Vinyl exterior; Paved road access
Interior
- Kitchen: Formica countertops; Tile flooring; Painted cabinets; Recessed lighting; Built-in range; Dishwasher; Disposal; Countertop microwave; Refrigerator
- Bedrooms: Master bedroom on third level with private bath, walk-in closet, tub/shower, ceiling fan, and carpeted floors; Second-floor bedroom with balcony/deck, shared bath, walk-in closet, and carpeted floors; Second-floor bedroom with balcony/deck, private bath, walk-in closet, and carpeted floors
- Flooring: Carpet in bedrooms and living areas; Tile in kitchen
- Bathrooms: Three full bathrooms (including one main full bath)
- Heating & cooling: Electric heating; Heat pump (serving second level); Multiple heating/cooling units
- Interior features: Attic storage; Ceiling fans; Smoke detector; Wood-burning fireplace (1)
- Laundry & utility: Washer and dryer included; Laundry located in closet off the kitchen (main level); Electric water heater
Neighborhood map
What this means for you Summary
Snapshot
- This is a 3-bed/2.0-bath condo listed at $110k.
Deal economics
- At list price, monthly cash flow is $166 ($2k/yr) — positive.
- The deal already cash-flows at list — no discount required.
- Meets the 1% rule at list price ($2k rent vs $110k).
- Recommended offer: $108k (1.5% below list) — sets the bar for market timing.
Location & tenants
- Location reads 73/100 on livability (#39 in SC) — a middle-class / working-renter tenant base. Strengths: housing A+, cost of living A, employment A-; Watch: crime D, amenities F, commute F.
- Richland 01 (urban): math 26% / reading 36% proficiency, ranked #54 of 80 in SC (top 68%) — families likely to look elsewhere, expect single-tenant / working-renter base with shorter leases; 64% free/reduced lunch — lower-income household profile, screen leases tightly.
- Zoned schools: Bradley Elementary (math 22% / reading 32%, grade F, #421 of 597 statewide, top 73%, 437 students, 100% FRL); W.J. Keenan High (math 54% / reading 77%, grade B, #83 of 196 statewide, top 43%, 725 students, 100% FRL) — zoned schools average 100% FRL vs 64% district-wide (36 pts higher); higher-poverty schools than district average — tighter screening recommended.
- Zoned-school proficiency averages 46% at this address vs 31% district-wide (+15 pts) — the actual schools serving this property are materially stronger than the Richland 01 average implies; a family-tenant draw the district grade alone would hide.
- Market conditions: Rents rising fast (+4.8%/yr); 114 active listings in the ZIP; 11 comparable units currently listed for rent nearby; rentals at typical pace (median 25d on market — plan ~3-4 weeks tenant-placement turnaround); solid renter incomes; 3,472 units permitted in Richland County in 2024 (1,096 in 5+ unit buildings).
Forward outlook
- Local home prices are declining (-3.0%/yr); year-one equity from $761 of loan paydown is wiped out by about $3k of value loss. Plan a longer hold.
- Richland County population projected at +30% by 2050 — long-run rental-demand tailwind backs the buy-and-hold thesis.
- At projected returns (-3.0% appreciation + 4.8% rent growth), your $31k cash investment doubles in ~10 years — after that, you're playing with house money.
Negotiation context
- It's been on market 15 days — a 2% lower offer ($108k) is reasonable based on typical stale-listing flexibility.
- Current owner paid $75k; 47% above their basis — modest negotiation headroom, anchor on the comps not their cost.
Risks & watch-outs
- Watch-outs: HOA is 26% of rent.
Questions for the listing agent
- Built in 1974 — when were the roof, HVAC, electrical panel, plumbing, and water heater last replaced?
- What does the HOA fee cover, when was the last increase, and are there any pending special assessments or reserve-fund shortfalls?
- Any open or pending special assessments — roof, HVAC, plumbing, elevator, façade? What's the per-unit balance and payoff schedule, and is the seller paying it off at close or rolling it to the buyer?
- Is there a deadline driving the sale (1031 exchange, divorce, estate, relocation)? That informs how much negotiation room exists.
- Schools are A-rated — typically a magnet for longer-tenancy family renters. What's the average tenant stay here, and is there a school-zone premium baked into asking?
- Crime grade is D in this area — have there been break-ins, vandalism, or insurance claims at this property in the last 3 years? What carrier currently insures it and at what premium?
- What's the average days-on-market for RENTAL listings here right now (not sales)? A rising rental-DOM trend means longer vacancies and softer asking-rent achievability than the comps imply.
- What's the recent tenant-quality profile in this submarket — average credit score on applications, eviction rate, late-payment / NSF rate, and stable-employment percentage? A property-management company in the area should have these aggregated.
- How much new apartment / multifamily construction is in the pipeline within 1–3 miles? Heavy new supply (>2% of stock underway) typically softens rents 12–24 months out; light construction supports rent growth.
Investment metrics
- 1% rule
- 1.55% ✓
- Cap rate
- 8.10%
- Cash-on-cash
- 6.46%
- DSCR
- 1.29
- GRM
- 5.4
CMA / ARV
No comps found within radius.
Projected returns pro-forma
-3.0% appreciation · 4.8% rent growth · sell at horizon
- IRR
- -3.2%
- Equity multiple
- 0.88×
- Total profit
- $-3,847
- Equity at exit
- $16,401
- IRR
- 9.3%
- Equity multiple
- 1.80×
- Total profit
- $24,749
- Equity at exit
- $9,511
Cash invested: $30,800 (down + closing). Projections, not guarantees.
Landlord ↔ Tenant lean methodology
- Overall (STATE)
- 90 Strongly Landlord-Friendly
- State South Carolina
- 90 Strongly Landlord-Friendly · R+6
- County
- — inherits STATE
- City
- — inherits STATE
ZIP-level market 29206
- Rents YoY
- 4.8%
- Active inventory
- 114
- Price-to-rent
- 5.4×
Monthly cashflow live
- Estimated rent
- $1,702 high interval (Pro) →
- Mortgage (P&I)
- −$577
- Tax from tax record
- −$121 /mo · $1,451/yr
- Insurance
- −$46
- HOA
- −$435
- Vacancy / Maint / Mgmt
- −$357
- Net cashflow
- $166
Break-even live
Sensitivity live
| Price | -10% $228 | -5% $197 | +0% $166 | +5% $135 | +10% $103 |
|---|---|---|---|---|---|
| Rent | -10% $31 | -5% $99 | +0% $166 | +5% $233 | +10% $300 |
| Rate | -1.0pp $221 | -0.5pp $194 | base $166 | +0.5pp $137 | +1.0pp $108 |
UW: 25.0% down · 7.5% · 30yr · 1.5% tax · 5.0% vac · 8.0% maint · 8.0% mgmt
Financing live
Cash to close
- Down payment
- $27,500
- Closing costs
- $3,300
- Reserves months
- —
- Total cash needed
- —
Loan-product check · same deal, 3 products live
Conventional
25% down · 7.5% · 30yr
- Down + closing
- —
- Monthly P&I
- —
- Monthly cashflow
- —
- DSCR
- —
- Eligible?
- —
Personal DTI + credit; lowest rate.
DSCR
20% down · 8.5% · 30yr
- Down + closing
- —
- Monthly P&I
- —
- Monthly cashflow
- —
- DSCR
- —
- Eligible?
- —
No personal income docs; deal must DSCR.
Hard money
10% down · 12.0% · 12mo
- Down + closing
- —
- Monthly P&I
- —
- Monthly cashflow
- —
- DSCR
- —
- Eligible?
- —
Short-term bridge; refi at stabilization.
Rent comps 11 comps
| Address | Beds | Baths | Sqft | Rent | $/sqft | DOM | Units | Dist |
|---|---|---|---|---|---|---|---|---|
| 4443 Bethel Church Rd #27 Columbia, SC | 3.0 | 2.5 | 1660 | $1,645 | $0.99 | 24d | 1 | 0.03mi |
| 4215 Bethel Church Rd Columbia, SC | 1.0–3.0 | 1.0–2.0 | 962 | $1,395 | $1.45 | 24d | 1 | 0.23mi |
| 3650 Deerfield Dr Columbia, SC | 3.0 | 2.0 | 2078 | $2,295 | $1.10 | 24d | 1 | 0.25mi |
| 4214 Bethel Church Rd Columbia, SC | 2.0–3.0 | 1.0–2.0 | 1068 | $1,429 | $1.34 | 12d | 9 | 0.25mi |
| 151 Renaissance Way Columbia, SC | 3.0 | 2.0 | 1200 | $1,400 | $1.17 | 24d | 1 | 0.34mi |
| 3117 Quitman St Columbia, SC | 3.0 | 2.0 | 1500 | $1,750 | $1.17 | 24d | 1 | 0.59mi |
| 1821 Atascadero Dr Columbia, SC | 3.0 | 2.0 | 1520 | $2,000 | $1.32 | 24d | 1 | 0.69mi |
| 5437 Ransom Dr Columbia, SC | 3.0 | 1.0 | 1056 | $1,531 | $1.45 | 24d | 1 | 0.96mi |
| 4833 Arcadia Rd Columbia, SC | 4.0 | 2.0 | 2217 | $2,400 | $1.08 | 15d | 1 | 1.31mi |
| 2050 N Beltline Blvd Columbia, SC | 1.0–2.0 | 1.0–1.5 | 831 | $1,042 | $1.25 | 15d | 6 | 1.35mi |
| 3145 Bronx Rd Columbia, SC | 3.0 | 1.5 | 1207 | $1,511 | $1.25 | 24d | 1 | 1.47mi |
HOA detail condo
- Monthly dues
- $435 · $5,220/yr
- Likely covers
- parking
- Assessments
- None detected in remarks — confirm with the listing agent.
Listing history 11 events
-
2026-06-18days on market $110,000 Active 15 DOM
-
2026-06-17days on market $110,000 Active 14 DOM
-
2026-06-16days on market $110,000 Active 13 DOM
-
2026-06-15days on market $110,000 Active 12 DOM
-
2026-06-14days on market $110,000 Active 10 DOM
-
2026-06-10days on market $110,000 Active 7 DOM
-
2026-06-09days on market $110,000 Active 6 DOM
-
2026-06-08days on market $110,000 Active 5 DOM
-
2026-06-07days on market $110,000 Active 4 DOM
-
2026-06-03remarks 699-char remark
-
2026-06-03$110,000 Active 1 DOM
ⓘ Source: listings_history table (triggers on properties + properties_extension) + one-shot
backfill from property_details.listing_events for pre-trigger history.
Tax reassessment forecast SC · Resets to sale price
- Current annual tax
- $1,451 · $121/mo
- Projected year-2 tax
- $1,451 · $121/mo
- Expected delta
- $0/yr ($0/mo · 0.0%)
ⓘ Screening estimate from a state-policy table — verify with the county assessor before closing.
Nearby sold comps map
Loading sold comps map…
Walkable amenities ~0.75 mi
Loading nearby amenities…
Taxation est. · year 1
- Rental income
- $20,421
- − Mortgage interest
- −$6,162
- − Property taxes
- −$1,451
- − Insurance
- −$550
- − Repairs & maintenance
- −$1,634
- − Management
- −$1,634
- − HOA
- −$5,220
- − Depreciation
- −$3,200
- Taxable income
- $571
- Est. tax owed @ 24.0%
- −$137
- After-tax cash flow
- $1,852/yr
For passive investors: Depreciation is non-cash, so a rental often shows a tax loss while cash-flowing — sheltering income. Rental losses are passive: they offset passive income freely, and up to $25,000/yr can offset ordinary (W-2) income if you actively participate and your MAGI is under $100k (phasing out to $0 by $150k); unused losses carry forward. On sale, claimed depreciation is recaptured at up to 25%, and gains may owe capital-gains tax (a 1031 exchange can defer both). Figures are a year-1 estimate at your 24.0% rate — not tax advice; consult a CPA.
Schools (NCES district)
- District
- Richland 01
- NCES district ID
- 4503360
- Math proficiency
- 26% ▼ -7.00%
- Reading proficiency
- 36% ▼ -5.00%
- Median HH income
- $38,931
- Composite
- 25.94/100
- National rank
- #7335
- State rank
- #54 of 80 in SC
Livability — Forest Acres
- Score
- 73/100
- State rank
- #39
- US rank
- #5064
Category grades
Schools grade is shown separately in the Schools card above.
Census & demographics
- Census place
- Forest Acres, SC
- County
- Richland County · 389,530 people
- City population
- 20,054
- Metro
- Columbia, SC
- Population (ZIP)
- 19,759
- Household income
- $91,847
- Rent vs Own
- Severe rent burden
- 697.0
Population outlook (Richland County) Hauer SSP2
- Today (2025)
- 459,667 people
- By 2030
- 487,524 · +6.1%
- By 2040
- 542,035 · +17.9%
- By 2050
- 595,371 · +29.5%
- By 2075
- 732,998 · +59.5%
- By 2100
- 820,415 · +78.5%
Race, ethnicity, and origin ACS 2023
- Neighborhood character
- Predominantly White (74%)
- Race & ethnicity
- White 74% Black 14% Two or more races 6% Hispanic / Latino 5% Asian 1%
- Common ancestry
- Italian 5% Serbian 4% Slovak 4%
- Foreign-born
- 3% · Canada, Guatemala, South Korea
- Languages at home
- 97% English-only · Spanish 1% Other Indo-European 1%
Political lean MEDSL · Richland
- 2024 margin
- Solid D (+34.6) · D 66.4% · R 31.8% · Other 1.8%
- 2008→2024 swing
- +5.7pp toward D · 2008: 28.9pp · 2024: 34.6pp
- All cycles
- 2024: D+34.6 2020: D+38.3 2016: D+32.9 2012: D+33.3 2008: D+28.9
Not yet ingested
- Civics
- —
Market trends
- HPI YoY
- ▼ -325.76%
- Current HPI
- 224.5418
- Rent YoY
- ▲ 4.80%
- Metro
- Columbia, SC
- State GDP YoY
- ▲ 4.51%
- F500 in state
- 2
Industry mix (Fortune 500 HQ in SC)
| Industry | F500 HQs | Revenue |
|---|---|---|
| Packaging | 1 | $7B |
|
||
Price history
+144.4% since first listed3 events — show timeline
- 2026-06-03 Listed $110,000 Consolidated MLS
- 2022-04-26 Sold (Public Records) $75,000 Public Records
- 1989-04-01 Sold (Public Records) $45,000 Public Records
Property tax history
+8.6%/yrLatest (2025): $1,451 · +2.3% YoY. Source: county tax records.
Cash-flow waterfall
monthlySold comps — $/sqft
last 12 mo · ≤1 miLoading sold comps…