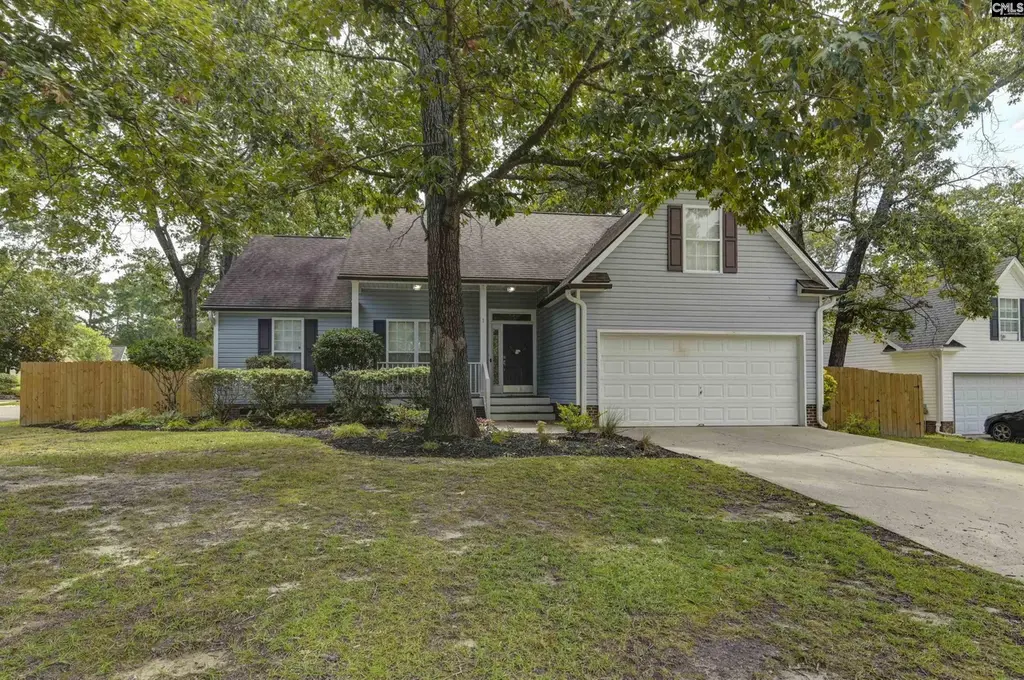
1 Cambridge Oaks Ct · Dentsville, SC
Flood risk 1/10 · Minimal
- FEMA flood zone
- X
- Chance of flooding over 30 yrs
- 0.0%
- Est. flood insurance / yr
- $435 – $905
Fire risk 2/10 · Minimal
- Est. fire insurance / yr
- $783 – $1,453
Heat risk 6/10 · Moderate
- Hot days now (above threshold)
- 7 days/yr
- Hot days in 30 yrs
- 16 days/yr
Wind risk No data
- Chance of severe wind over 30 yrs
- —
Air-quality risk No data
- Unhealthy air days now
- —
- Unhealthy air days in 30 yrs
- —
Risk factors via First Street. Map © Google.
Why this score? — see what drove the D- grade
The composite is a weighted blend of 9 inputs, each scored 0–100. Each bar is that input's sub-score; the figure is the points it added to the 100-point composite (weight × sub-score).
- Cash flow +11.2/30.0
- Appreciation +5.0/10.0
- Schools +3.6/10.0
- Livability +3.6/5.0
- ARV discount +3.4/15.0
- DSCR +3.3/10.0
- 1% rule +2.7/10.0
- Rent growth +2.5/5.0
- Condition / age +2.5/5.0
$250,000
🖨 Deal sheet (PDF) 📄 Offer letter ✓ Due diligence
Listing remarks
Ready to own a home of your own? Look no further. Tucked on the corner of a cul-de-sac, with a VOLUNTARY HOA, privacy fenced backyard, and two car garage this home is a dream. Rocking chair front porch, conveniently located to Ft. Jackson, Scout Motors, the interstate systems, this home is a real charmer. Inside, you will find mainly one level living with a dining area off the great room, wood burning fireplace, kitchen with eat in nook. Need a quiet getaway? Head upstairs to the FROG. 2019 Trane HVAC with smart thermostat, 2014 roof, 2019 water heater, and new fencing. It's truly ready for it's next owner. Disclaimer: CMLS has not reviewed and, therefore, does not endorse vendors who m
Key facts
- Dining area
- Two car garage
- One level living
Tags
Property features AI
Exterior
- Parking: Attached 2-car garage
- Security: Smoke detector
- Utilities: Public water; Public sewer
- Home design: Single-family home, 1.5 stories
- Construction: Vinyl exterior finish; Crawlspace foundation
- Exterior features: Front covered porch; Deck; Full gutters; Privacy wood fence at rear; Paved road
Interior
- Kitchen: Bay window and eat-in area; Formica countertops; Luxury vinyl plank flooring in kitchen; Free-standing, smooth surface self-cleaning range
- Bedrooms: Master bedroom on main level with garden tub, private bath, walk-in closet, tray ceilings and ceiling fan; Second bedroom on main level with ceiling fan and shared bath; Third bedroom on main level with ceiling fan and shared bath; Finished room over garage (FROG) on second level (no closet)
- Flooring: Luxury vinyl plank in kitchen (other flooring not specified)
- Bathrooms: Two full bathrooms
- Heating & cooling: Central heating (Gas Pac); Central cooling (Gas Pac)
- Interior features: Attic storage with pull-down access; Ceiling fans throughout; Garage door opener; Smoke detector; Wood-burning fireplace (1) with vaulted ceiling in great room; Vaulted ceilings in great room
- Laundry & utility: Laundry closet on main level
Neighborhood map
What this means for you Summary
Snapshot
- This is a 3-bed/2.0-bath single-family listed at $250k.
Deal economics
- At list price, monthly cash flow is $-96 ($-1k/yr) — negative.
- To cash-flow at today's rent, offer at most $233k (6.8% below list).
- To meet the 1% rule (rent ≥ 1% of price), the offer needs to be $192k (23.2% below list).
- Recommended offer: $192k (23.2% below list) — sets the bar for 1% rule.
Location & tenants
- Location reads 71/100 on livability (#50 in SC) — a middle-class / working-renter tenant base. Strengths: cost of living A+, health & safety A+, housing A; Watch: amenities D+, crime F, commute F.
- Richland 02 (suburban): math 35% / reading 47% proficiency, ranked #29 of 80 in SC (top 36%) — families likely to look elsewhere, expect single-tenant / working-renter base with shorter leases.
- Zoned schools: L. B. Nelson Elementary (math 39% / reading 43%, grade F, #276 of 597 statewide, top 48%, 567 students, 76% FRL); Spring Valley High (math 53% / reading 92%, grade B+, #46 of 196 statewide, top 24%, 2,187 students, 49% FRL) — zoned schools average 62% FRL vs 38% district-wide (24 pts higher); higher-poverty schools than district average — tighter screening recommended.
- Zoned-school proficiency averages 57% at this address vs 41% district-wide (+16 pts) — the actual schools serving this property are materially stronger than the Richland 02 average implies; a family-tenant draw the district grade alone would hide.
- Market conditions: 1 active listings in the ZIP; 8 comparable units currently listed for rent nearby; rentals at typical pace (median 16d on market — plan ~3-4 weeks tenant-placement turnaround); 3,472 units permitted in Richland County in 2024 (1,096 in 5+ unit buildings).
Forward outlook
- In year one you build about $9k of equity ($2k loan paydown + $8k appreciation (3.0% local appreciation)).
- Richland County population projected at +30% by 2050 — long-run rental-demand tailwind backs the buy-and-hold thesis.
- By year 4, paydown + projected appreciation supports a ~$31k cash-out refi (75% LTV) — recoverable capital for the next deal without selling this one.
Negotiation context
- It's been on market 68 days — a 6% lower offer ($235k) is reasonable based on typical stale-listing flexibility.
- 3 sale attempts since 3y ago with the ask held roughly flat each time — persistent listings suggest the price (not the market) is what's stuck; bring a comps-based counter.
Risks & watch-outs
- Climate carrying-cost: extreme-heat days projected 7→16/yr by 2055 (HVAC capex compounding) — expect insurance premiums to compound above CPI over the hold.
Questions for the listing agent
- What do current leases actually rent for vs. the listed asking? Can we see a recent rent roll and the last 12 months of T-12 income?
- It's been on market 68 days. Have you received any prior offers? Is the seller open to a 23% concession, seller financing, or rate buy-down credit?
- Why hasn't it sold? Are there any deal-killer items the seller is aware of (foundation, flood, title, zoning, code violations)?
- Is there a deadline driving the sale (1031 exchange, divorce, estate, relocation)? That informs how much negotiation room exists.
- Schools are D-rated, which usually means shorter tenancies and higher turnover. Who's the typical renter profile here, and what's been the actual vacancy rate?
- Crime grade is F in this area — have there been break-ins, vandalism, or insurance claims at this property in the last 3 years? What carrier currently insures it and at what premium?
- The area grade is low — what's the realistic commute time and amenity access for the typical tenant pool here? Any planned neighborhood developments (good or bad) we should know about?
- What's the average days-on-market for RENTAL listings here right now (not sales)? A rising rental-DOM trend means longer vacancies and softer asking-rent achievability than the comps imply.
- What's the recent tenant-quality profile in this submarket — average credit score on applications, eviction rate, late-payment / NSF rate, and stable-employment percentage? A property-management company in the area should have these aggregated.
- How much new for-sale + rental construction is in the pipeline within 1–3 miles? Heavy new supply typically softens prices + rents 12–24 months out; constrained supply supports both.
Investment metrics
- 1% rule
- 0.77% ✗
- Cap rate
- 5.83%
- Cash-on-cash
- -1.65%
- DSCR
- 0.93
- GRM
- 10.8
CMA / ARV
- ARV (on-the-fly)
- $229,220
- Comps found
- 1
Show comp detail 1 sale within ~0.75 mi
| Address | Dist | Beds/Ba | Sqft | Sold | Price | $/sf | Match |
|---|---|---|---|---|---|---|---|
| 144 Peaceful Ln | 0.37mi | 3/2.0 | 1,544 (-2%) | 19mo | $225,000 | $146 | 64 |
Match score weights: distance 35% · size 25% · config 20% · recency 20%. Top-matched comps best support the ARV.
Projected returns pro-forma
3.0% appreciation · 3.0% rent growth · sell at horizon
- IRR
- 6.0%
- Equity multiple
- 1.34×
- Total profit
- $23,959
- Equity at exit
- $112,411
- IRR
- 8.9%
- Equity multiple
- 2.34×
- Total profit
- $93,846
- Equity at exit
- $173,238
Cash invested: $70,000 (down + closing). Projections, not guarantees.
Landlord ↔ Tenant lean methodology
- Overall (STATE)
- 90 Strongly Landlord-Friendly
- State South Carolina
- 90 Strongly Landlord-Friendly · R+6
- County
- — inherits STATE
- City
- — inherits STATE
ZIP-level market 29223-5342
- Active inventory
- 1
- Price-to-rent
- 10.8×
Monthly cashflow live
- Estimated rent
- $1,921 high interval (Pro) →
- Mortgage (P&I)
- −$1,311
- Tax from tax record
- −$198 /mo · $2,382/yr
- Insurance
- −$104
- HOA
- −$0
- Vacancy / Maint / Mgmt
- −$403
- Net cashflow
- $-96
Break-even live
Sensitivity live
| Price | -10% $45 | -5% $-25 | +0% $-96 | +5% $-167 | +10% $-238 |
|---|---|---|---|---|---|
| Rent | -10% $-248 | -5% $-172 | +0% $-96 | +5% $-20 | +10% $56 |
| Rate | -1.0pp $30 | -0.5pp $-32 | base $-96 | +0.5pp $-161 | +1.0pp $-227 |
UW: 25.0% down · 7.5% · 30yr · 1.5% tax · 5.0% vac · 8.0% maint · 8.0% mgmt
Financing live
Cash to close
- Down payment
- $62,500
- Closing costs
- $7,500
- Reserves months
- —
- Total cash needed
- —
Loan-product check · same deal, 3 products live
Conventional
25% down · 7.5% · 30yr
- Down + closing
- —
- Monthly P&I
- —
- Monthly cashflow
- —
- DSCR
- —
- Eligible?
- —
Personal DTI + credit; lowest rate.
DSCR
20% down · 8.5% · 30yr
- Down + closing
- —
- Monthly P&I
- —
- Monthly cashflow
- —
- DSCR
- —
- Eligible?
- —
No personal income docs; deal must DSCR.
Hard money
10% down · 12.0% · 12mo
- Down + closing
- —
- Monthly P&I
- —
- Monthly cashflow
- —
- DSCR
- —
- Eligible?
- —
Short-term bridge; refi at stabilization.
Rent comps 8 comps
| Address | Beds | Baths | Sqft | Rent | $/sqft | DOM | Units | Dist |
|---|---|---|---|---|---|---|---|---|
| 495 Blue Garden Way Columbia, SC | 4.0 | 2.5 | 2075 | $2,224 | $1.07 | 4d | 1 | 0.58mi |
| 502 Blue Garden Way Columbia, SC | 4.0 | 2.5 | 1775 | $2,183 | $1.23 | 16d | 1 | 0.62mi |
| 916 N Brickyard Rd Columbia, SC | 3.0 | 2.0 | 1350 | $1,695 | $1.26 | 16d | 1 | 0.73mi |
| 109 Jaybird Ln Columbia, SC | 3.0 | 2.0 | 1250 | $1,679 | $1.34 | 4d | 1 | 0.96mi |
| 313 Brook Hollow Dr Columbia, SC | 3.0 | 3.0 | 1879 | $1,700 | $0.90 | 16d | 1 | 1.00mi |
| 136 Westport Dr Columbia, SC | 3.0 | 2.0 | 1303 | $1,769 | $1.36 | 23d | 1 | 1.26mi |
| 113 Millhouse Ct Columbia, SC | 3.0 | 2.0 | 1936 | $2,030 | $1.05 | 21d | 1 | 1.28mi |
| 108 Quinton Ln Columbia, SC | 3.0 | 2.0 | 1052 | $1,749 | $1.66 | 23d | 1 | 1.32mi |
Listing history 15 events
-
2026-06-05days on market $250,000 Active 68 DOM
-
2026-06-03days on market $250,000 Active 67 DOM
-
2026-06-03days on market $250,000 Active 66 DOM
-
2026-06-01days on market $250,000 Active 65 DOM
-
2026-05-31days on market $250,000 Active 64 DOM
-
2026-03-28$250,000 Active
-
2025-11-04price $250,000
-
2025-08-31$257,500 Active
-
2023-08-17soldstatus $241,000
-
2023-08-01status Pending
-
2023-07-17historical Active - Contingent
-
2023-07-14$230,000 Active
-
2010-05-24soldstatus $124,000
-
1999-03-01soldstatus $29,000
-
1997-10-10soldstatus $130,500
ⓘ Source: listings_history table (triggers on properties + properties_extension) + one-shot
backfill from property_details.listing_events for pre-trigger history.
Tax reassessment forecast SC · Resets to sale price
- Current annual tax
- $2,382 · $198/mo
- Projected year-2 tax
- $2,382 · $198/mo
- Expected delta
- $0/yr ($0/mo · 0.0%)
ⓘ Screening estimate from a state-policy table — verify with the county assessor before closing.
Climate risk First Street
- Flood 1/10 Low FEMA zone X · 0% chance over 30 yrs
- Wildfire 2/10 Low
- Heat 6/10 Major
Nearby sold comps map
Loading sold comps map…
Walkable amenities ~0.75 mi
Loading nearby amenities…
Taxation est. · year 1
- Rental income
- $23,053
- − Mortgage interest
- −$14,004
- − Property taxes
- −$2,382
- − Insurance
- −$1,250
- − Repairs & maintenance
- −$1,844
- − Management
- −$1,844
- − Depreciation
- −$7,273
- Taxable loss
- −$5,544
- Est. tax savings @ 24.0%
- +$1,331
- After-tax cash flow
- $178/yr
For passive investors: Depreciation is non-cash, so a rental often shows a tax loss while cash-flowing — sheltering income. Rental losses are passive: they offset passive income freely, and up to $25,000/yr can offset ordinary (W-2) income if you actively participate and your MAGI is under $100k (phasing out to $0 by $150k); unused losses carry forward. On sale, claimed depreciation is recaptured at up to 25%, and gains may owe capital-gains tax (a 1031 exchange can defer both). Figures are a year-1 estimate at your 24.0% rate — not tax advice; consult a CPA.
Schools (NCES district)
- District
- Richland 02
- NCES district ID
- 4503390
- Math proficiency
- 35% ▼ -15.00%
- Reading proficiency
- 47% ▼ -5.00%
- Median HH income
- $59,684
- Composite
- 36.2/100
- National rank
- #4730
- State rank
- #29 of 80 in SC
Livability — Dentsville
- Score
- 71/100
- State rank
- #50
- US rank
- #6940
Category grades
Schools grade is shown separately in the Schools card above.
Census & demographics
No demographic data for this ZIP.
Market trends
- HPI YoY
- —
- Current HPI
- —
- Rent YoY
- —
- Metro
- —
- State GDP YoY
- ▲ 4.51%
- F500 in state
- 2
Industry mix (Fortune 500 HQ in SC)
| Industry | F500 HQs | Revenue |
|---|---|---|
| Packaging | 1 | $7B |
|
||
Price history
+91.6% since first listed10 events — show timeline
- 2026-03-28 Listed $250,000 Consolidated MLS
- 2025-11-04 Price Changed $250,000 Consolidated MLS
- 2025-08-31 Listed $257,500 Consolidated MLS
- 2023-08-17 Sold (Public Records) $241,000 Public Records
- 2023-08-01 Pending — Consolidated MLS
- 2023-07-17 Contingent — Consolidated MLS
- 2023-07-14 Listed $230,000 Consolidated MLS
- 2010-05-24 Sold (Public Records) $124,000 Public Records
- 1999-03-01 Sold (Public Records) $29,000 Public Records
- 1997-10-10 Sold (Public Records) $130,500 Public Records
Property tax history
+5.8%/yrLatest (2025): $2,382 · +3.6% YoY. Source: county tax records.
Cash-flow waterfall
monthlySold comps — $/sqft
last 12 mo · ≤1 miLoading sold comps…