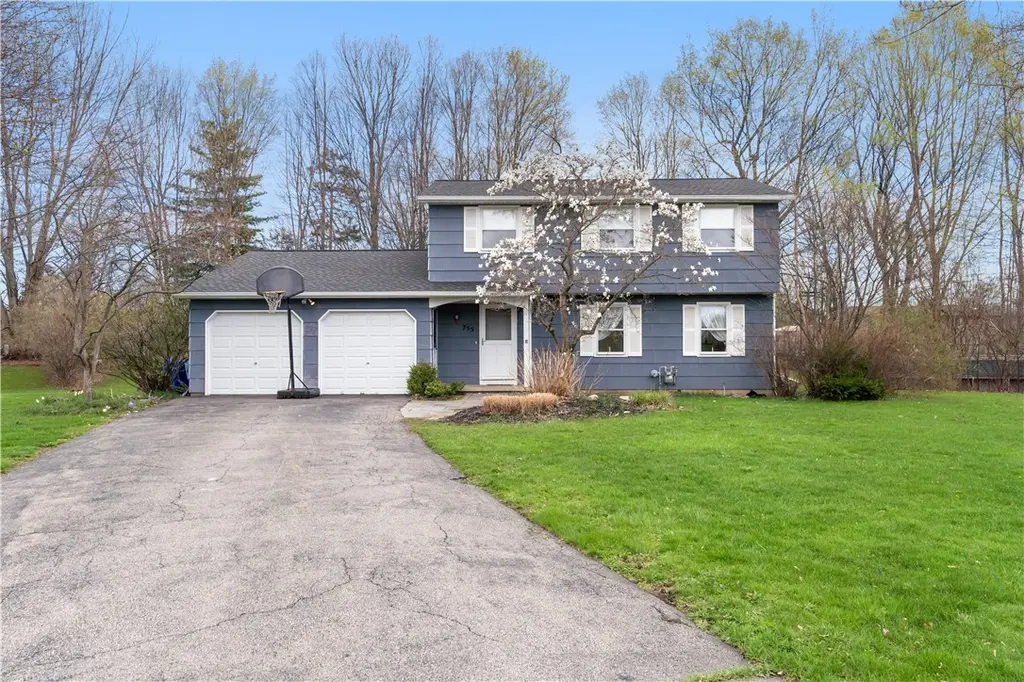
755 Tanya Cir · Webster, NY
Flood risk 1/10 · Minimal
- FEMA flood zone
- X (unshaded)
- Chance of flooding over 30 yrs
- 0.0%
- Est. flood insurance / yr
- $473 – $860
Fire risk 1/10 · Minimal
- Est. fire insurance / yr
- $691 – $1,283
Heat risk 2/10 · Minimal
- Hot days now (above 95°F)
- 7 days/yr
- Hot days in 30 yrs
- 16 days/yr
Wind risk 1/10 · Minimal
- Chance of severe wind over 30 yrs
- —
Air-quality risk 2/10 · Minimal
- Unhealthy air days now
- 1 days/yr
- Unhealthy air days in 30 yrs
- 2 days/yr
Risk factors via First Street. Map © Google.
Why this score? — see what drove the D grade
The composite is a weighted blend of 9 inputs, each scored 0–100. Each bar is that input's sub-score; the figure is the points it added to the 100-point composite (weight × sub-score).
- ARV discount +14.3/15.0
- Cash flow +7.4/30.0
- Schools +5.5/10.0
- Livability +3.8/5.0
- Rent growth +3.1/5.0
- 1% rule +2.5/10.0
- Condition / age +2.5/5.0
- DSCR +1.6/10.0
- Appreciation +0.0/10.0
$325,000
🖨 Deal sheet 📄 Offer letter ✓ Due diligence
Listing remarks MLS
Unique 3-bedroom home tucked away on a quiet cul-de-sac! This one-of-a-kind property features a versatile space that was once used as a bakery—offering incredible potential for an in-law suite, home business, studio, or whatever your vision may be. A rare opportunity to customize a space that truly fits your lifestyle or investment goals. Enjoy peace of mind with major updates already completed, including a new roof and furnace—both just 2 years old.
Key facts
- In-law suite
- New furnace
- Cul-de-sac
Tags
Neighborhood map
What this means for you Summary
Snapshot
- This is a 3-bed/1.5-bath single-family listed at $325k.
Deal economics
- At list price, monthly cash flow is $-417 ($-5k/yr) — negative.
- To cash-flow at today's rent, offer at most $251k (22.7% below list).
- To meet the 1% rule (rent ≥ 1% of price), the offer needs to be $243k (25.2% below list).
- Recommended offer: $243k (25.2% below list) — sets the bar for 1% rule.
- Cap rate 4.8% vs local median 2.9% in Webster — top-decile yield for the area; either an underpriced asset or a hidden risk that comps aren't pricing in. Stress-test before assuming the spread holds.
Location & tenants
- Location reads 76/100 on livability (#221 in NY, #3,471 nationally) — a middle-class / working-renter tenant base. Strengths: commute A+, housing A+, health & safety A; Watch: crime D+, amenities F.
- Webster Central School District (suburban): math 62% / reading 63% proficiency, ranked #184 of 590 in NY (top 31%) — acceptable for families but not a draw, mixed tenant base, ~2y average lease; only 12% free/reduced lunch — higher-income household profile.
- Market conditions: Rents rising (+2.4%/yr); 243 active listings in the ZIP; 4 comparable units currently listed for rent nearby; rentals leasing fast (median 4d on market — plan ~1-2 weeks tenant-placement turnaround); solid renter incomes; 1,169 units permitted in Monroe County in 2024 (591 in 5+ unit buildings).
Forward outlook
- Local home prices are declining (-3.0%/yr); year-one equity from $2k of loan paydown is wiped out by about $10k of value loss. Plan a longer hold.
- Monroe County population projected to shrink 6% by 2050 — rents likely to lag national; underwrite the cash flow, not the appreciation.
Negotiation context
- It's been on market 53 days — a 3% lower offer ($315k) is reasonable based on typical stale-listing flexibility.
Questions for the listing agent
- What do current leases actually rent for vs. the listed asking? Can we see a recent rent roll and the last 12 months of T-12 income?
- It's been on market 53 days. Have you received any prior offers? Is the seller open to a 25% concession, seller financing, or rate buy-down credit?
- Built in 1975 — when were the roof, HVAC, electrical panel, plumbing, and water heater last replaced?
- Is there a deadline driving the sale (1031 exchange, divorce, estate, relocation)? That informs how much negotiation room exists.
- Schools are B-rated — typically a magnet for longer-tenancy family renters. What's the average tenant stay here, and is there a school-zone premium baked into asking?
- Crime grade is D in this area — have there been break-ins, vandalism, or insurance claims at this property in the last 3 years? What carrier currently insures it and at what premium?
- The area grade is low — what's the realistic commute time and amenity access for the typical tenant pool here? Any planned neighborhood developments (good or bad) we should know about?
- What's the average days-on-market for RENTAL listings here right now (not sales)? A rising rental-DOM trend means longer vacancies and softer asking-rent achievability than the comps imply.
- What's the recent tenant-quality profile in this submarket — average credit score on applications, eviction rate, late-payment / NSF rate, and stable-employment percentage? A property-management company in the area should have these aggregated.
- How much new for-sale + rental construction is in the pipeline within 1–3 miles? Heavy new supply typically softens prices + rents 12–24 months out; constrained supply supports both.
Investment metrics
- 1% rule
- 0.75% ✗
- Cap rate
- 4.75%
- Cash-on-cash
- -5.50%
- DSCR
- 0.76
- GRM
- 11.1
CMA / ARV
- ARV (median comp)
- $382,570
- List price
- $325,000
- Delta
- -15.05%
- Verdict
- UNDERPRICED
- Comps
- 20 within 1.0 mi
Show comp detail 12 sales within ~0.75 mi
| Address | Dist | Beds/Ba | Sqft | Sold | Price | $/sf | Match |
|---|---|---|---|---|---|---|---|
| 734 Eastwood Cir | 0.19mi | 4/1.5 (+1) | 1,872 (+12%) | 3mo | $405,000 | $216 | 64 |
| 121 Anytrell Dr | 0.66mi | 3/1.5 | 1,636 (-2%) | 6mo | $430,000 | $263 | 61 |
| 770 Lauren Ct | 0.23mi | 3/2.0 | 1,840 (+10%) | 12mo | $353,000 | $192 | 60 |
| 1188 Hatch Rd | 0.51mi | 3/2.0 | 1,752 (+5%) | 8mo | $343,300 | $196 | 60 |
| 749 Mont Vista Ln | 0.24mi | 4/2.0 (+1) | 1,868 (+12%) | 6mo | $360,000 | $193 | 57 |
| 786 Lauren Ct | 0.13mi | 4/2.5 (+1) | 1,872 (+12%) | 12mo | $351,000 | $188 | 55 |
| 5 Woodrose Dr | 0.51mi | 3/2.5 | 1,871 (+12%) | 1mo | $475,000 | $254 | 52 |
| 671 Adeline Dr | 0.63mi | 4/2.0 (+1) | 1,537 (-8%) | 7mo | $324,500 | $211 | 45 |
| 22 Jewelberry Dr | 0.62mi | 3/2.5 | 1,841 (+10%) | 9mo | $410,000 | $223 | 42 |
| 899 Lothario Cir | 0.54mi | 4/2.5 (+1) | 1,808 (+8%) | 13mo | $501,000 | $277 | 42 |
| 1244 Hatch Rd | 0.59mi | 4/2.5 (+1) | 1,483 (-11%) | 8mo | $375,000 | $253 | 38 |
| 767 Bishops Ln | 0.59mi | 4/2.5 (+1) | 1,892 (+13%) | 12mo | $455,000 | $240 | 32 |
Match score weights: distance 35% · size 25% · config 20% · recency 20%. Top-matched comps best support the ARV.
Projected returns pro-forma
-3.0% appreciation · 2.38% rent growth · sell at horizon
- IRR
- -26.4%
- Equity multiple
- 0.11×
- Total profit
- $-80,658
- Equity at exit
- $48,459
- IRR
- -25.6%
- Equity multiple
- -0.21×
- Total profit
- $-110,191
- Equity at exit
- $28,100
Cash invested: $91,000 (down + closing). Projections, not guarantees.
Landlord ↔ Tenant lean methodology
- Overall (STATE)
- 15 Strongly Tenant-Friendly
- State New York
- 15 Strongly Tenant-Friendly · D+10
- County
- — inherits STATE
- City
- — inherits STATE
ZIP-level market 14580
- Rents YoY
- 2.4%
- Active inventory
- 243
- Price-to-rent
- 11.1×
Monthly cashflow live
- Estimated rent
- $2,431 medium interval (Pro) →
- Mortgage (P&I)
- −$1,704
- Tax from tax record
- −$498 /mo · $5,979/yr
- Insurance
- −$135
- HOA
- −$0
- Vacancy / Maint / Mgmt
- −$511
- Net cashflow
- $-417
Break-even live
UW: 25.0% down · 7.5% · 30yr · 1.5% tax · 5.0% vac · 8.0% maint · 8.0% mgmt
Financing live
Cash to close
- Down payment
- $81,250
- Closing costs
- $9,750
- Reserves months
- —
- Total cash needed
- —
Loan-product check · same deal, 3 products live
Conventional
25% down · 7.5% · 30yr
- Down + closing
- —
- Monthly P&I
- —
- Monthly cashflow
- —
- DSCR
- —
- Eligible?
- —
Personal DTI + credit; lowest rate.
DSCR
20% down · 8.5% · 30yr
- Down + closing
- —
- Monthly P&I
- —
- Monthly cashflow
- —
- DSCR
- —
- Eligible?
- —
No personal income docs; deal must DSCR.
Hard money
10% down · 12.0% · 12mo
- Down + closing
- —
- Monthly P&I
- —
- Monthly cashflow
- —
- DSCR
- —
- Eligible?
- —
Short-term bridge; refi at stabilization.
Rent comps 4 comps
| Address | Beds | Baths | Sqft | Rent | $/sqft | DOM | Units | Dist |
|---|---|---|---|---|---|---|---|---|
| 744 Royal Sunset Dr Webster, NY | 2.0 | 2.5 | 1233 | $2,411 | $1.96 | 3d | 1 | 0.26mi |
| 78 S Estate Dr Webster, NY | 4.0 | 2.0 | 1700 | $3,000 | $1.76 | 44d | 1 | 0.87mi |
| 77 Deerhurst Ln Webster, NY | 1.0–2.0 | 1.0–1.5 | 1070 | $2,000 | $1.87 | 3d | 21 | 1.10mi |
| 1205 Rousseau Dr Webster, NY | 1.0–3.0 | 1.0–2.0 | 1143 | $2,696 | $2.36 | 3d | 3 | 1.16mi |
Listing history 8 events
-
2026-06-09statusdays on market $325,000 Pending 53 DOM
-
2026-06-07days on market $325,000 Active 52 DOM
-
2026-06-05days on market $325,000 Active 49 DOM
-
2026-06-03days on market $325,000 Active 48 DOM
-
2026-06-03days on market $325,000 Active 47 DOM
-
2026-06-01days on market $325,000 Active 46 DOM
-
2026-05-31days on market $325,000 Active 45 DOM
-
2026-04-15$325,000 Active 466-char remark
Show marketing remark (466 chars)
Unique 3-bedroom home tucked away on a quiet cul-de-sac! This one-of-a-kind property features a versatile space that was once used as a bakery—offering incredible potential for an in-law suite, home business, studio, or whatever your vision may be. A rare opportunity to customize a space that truly fits your lifestyle or investment goals. Enjoy peace of mind with major updates already completed, including a new roof and furnace—both just 2 years old.
ⓘ Source: listings_history table (triggers on properties + properties_extension) + one-shot
backfill from property_details.listing_events for pre-trigger history.
Tax reassessment forecast NY · Partial reset (capped growth)
- Current annual tax
- $5,979 · $498/mo
- Projected year-2 tax
- $5,979 · $498/mo
- Expected delta
- $0/yr ($0/mo · 0.0%)
ⓘ Screening estimate from a state-policy table — verify with the county assessor before closing.
Climate risk First Street
- Flood 1/10 Low FEMA zone X (unshaded) · 0% chance over 30 yrs
- Wildfire 1/10 Low
- Heat 2/10 Low 7 d/yr ≥95°F today · 16 d/yr by 30 yrs out
- Wind 1/10 Low
- Air quality 2/10 Low 1 unhealthy d/yr today · 2 by 30 yrs out
Nearby sold comps map
Loading sold comps map…
Walkable amenities ~0.75 mi
Loading nearby amenities…
Taxation est. · year 1
- Rental income
- $29,175
- − Mortgage interest
- −$18,205
- − Property taxes
- −$5,979
- − Insurance
- −$1,625
- − Repairs & maintenance
- −$2,334
- − Management
- −$2,334
- − Depreciation
- −$9,455
- Taxable loss
- −$10,757
- Est. tax savings @ 24.0%
- +$2,582
- After-tax cash flow
- $-2,426/yr
For passive investors: Depreciation is non-cash, so a rental often shows a tax loss while cash-flowing — sheltering income. Rental losses are passive: they offset passive income freely, and up to $25,000/yr can offset ordinary (W-2) income if you actively participate and your MAGI is under $100k (phasing out to $0 by $150k); unused losses carry forward. On sale, claimed depreciation is recaptured at up to 25%, and gains may owe capital-gains tax (a 1031 exchange can defer both). Figures are a year-1 estimate at your 24.0% rate — not tax advice; consult a CPA.
Schools (NCES district)
- District
- Webster Central School District
- NCES district ID
- 3630360
- Math proficiency
- 62% ▼ -3.00%
- Reading proficiency
- 63% ▲ 6.00%
- Median HH income
- $71,221
- Composite
- 55.18/100
- National rank
- #1273
- State rank
- #184 of 590 in NY
Livability — Webster
- Score
- 76/100
- State rank
- #221
- US rank
- #3471
Category grades
Schools grade is shown separately in the Schools card above.
Census & demographics
- County
- Monroe County · 674,131 people
- City population
- 54,180
- Metro
- Rochester, NY
- Population (ZIP)
- 54,180
- Household income
- $98,310
- Rent vs Own
- Severe rent burden
- 1325.0
Population outlook (Monroe County) Hauer SSP2
- Today (2025)
- 759,460 people
- By 2030
- 757,154 · -0.3%
- By 2040
- 740,644 · -2.5%
- By 2050
- 714,443 · -5.9%
- By 2075
- 645,883 · -15.0%
- By 2100
- 547,084 · -28.0%
Race, ethnicity, and origin ACS 2023
- Neighborhood character
- Predominantly White (88%)
- Race & ethnicity
- White 88% Two or more races 5% Hispanic / Latino 3% Asian 3% Black 2%
- Common ancestry
- Romanian 4% Iranian 3% Subsaharan African 3%
- Foreign-born
- 8% · Canada, China
- Languages at home
- 91% English-only · Other Indo-European 3% Russian/Polish/Slavic 2% Spanish 2%
Political lean MEDSL · Monroe
- 2024 margin
- D (+19.1) · D 59.5% · R 40.5%
- 2008→2024 swing
- +1.4pp toward D · 2008: 17.7pp · 2024: 19.1pp
- All cycles
- 2024: D+19.1 2020: D+21.0 2016: D+14.1 2012: D+17.4 2008: D+17.7
Not yet ingested
- Civics
- —
Market trends
- HPI YoY
- ▼ -154.52%
- Current HPI
- 266.2145
- Rent YoY
- ▲ 2.38%
- Metro
- Rochester, NY
- State GDP YoY
- ▲ 2.60%
- F500 in state
- 92
Industry mix (Fortune 500 HQ in NY)
| Industry | F500 HQs | Revenue |
|---|---|---|
| Financial Services | 10 | $950B |
|
||
| Consumer Goods | 9 | $162B |
|
||
| Insurance | 4 | $225B |
|
||
| Telecommunications | 2 | $144B |
|
||
| Pharmaceuticals | 2 | $112B |
|
||
| Media / Entertainment | 2 | $69B |
|
||
Price history
1 event — show timeline
- 2026-04-15 Listed $325,000 UNYREIS
Property tax history
+3.1%/yrLatest (2025): $5,979 · +0.3% YoY. Source: county tax records.
Cash-flow waterfall
monthlySold comps — $/sqft
last 12 mo · ≤1 miLoading sold comps…