 9-Plex
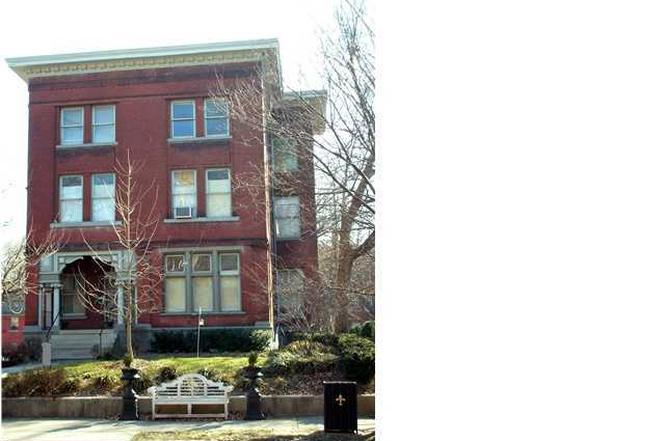
1337 S 4th St · Louisville, KY
Flood risk 6/10 · Moderate
- FEMA flood zone
- X (unshaded)
- Chance of flooding over 30 yrs
- 0.72%
- Est. flood insurance / yr
- $473 – $860
Fire risk 1/10 · Minimal
- Est. fire insurance / yr
- $839 – $1,559
Heat risk 5/10 · Moderate
- Hot days now (above 105°F)
- 7 days/yr
- Hot days in 30 yrs
- 20 days/yr
Wind risk 2/10 · Minimal
- Chance of severe wind over 30 yrs
- 1.0%
Air-quality risk 2/10 · Minimal
- Unhealthy air days now
- 1 days/yr
- Unhealthy air days in 30 yrs
- 3 days/yr
Risk factors via First Street. Map © Google.
Why this score? — see what drove the D- grade
The composite is a weighted blend of 9 inputs, each scored 0–100. Each bar is that input's sub-score; the figure is the points it added to the 100-point composite (weight × sub-score).
- Cash flow +13.0/30.0
- ARV discount +7.5/15.0
- Rent growth +4.0/5.0
- DSCR +3.9/10.0
- Livability +3.2/5.0
- 1% rule +2.9/10.0
- Condition / age +2.5/5.0
- Schools +2.3/10.0
- Appreciation +0.0/10.0
$1,200,000
🖨 Deal sheet (PDF) 📄 Offer letter ✓ Due diligence
Multi-family units
County records classify this as Multi-Family (5+ Unit). Listing-text estimate: 9 units. confirmed
5+ unit building — per-unit beds/baths from public records are typically unavailable; the breakdown below (if shown) is an estimate from the listing text.
Listing remarks MLS
Fantastic location overlooking Central Park surrounded by Bed and Breakfasts and Luxury Condos. This building is an incredible income producer with rarely ever any vacancies, plus five garages for additional income. Current monthly gross income is $4755 with great potential to increase. Same owners for over 33 yrs. This property is to be Sold as is.
Key facts
- Multifamily property
- On-site parking
- Laundry
Tags
Property features AI
Finance
- Other: Building area reported as 6,331 (source: Other); Living area reported as 8,421; Lot approximately 0.19 acres (about 8,394 sq ft); Not located in a flood plain; Directions: Traveling west on W Ormsby Ave, turn left onto S 4th Street and drive to the end of one block. The property is the first on your left after crossing Park Avenue, directly across from Central Park.
- HOA & community: No association fee
Exterior
- Parking: 4 parking spaces (uncovered)
- Utilities: Electricity connected
- Home design: Apartment property; Other architectural style; Shingle roof
- Construction: Brick construction; Built in 1885
- Exterior features: No exterior features listed
Interior
- Bedrooms: 12 total bedrooms (all listed on the 1st level)
- Bathrooms: 9 full bathrooms (listed on the 1st level)
- Heating & cooling: 9 furnaces
- Interior features: Basement present; Separate meters for units
Neighborhood map
What this means for you Summary
Snapshot
- This is a 9 × 2-bed/1.5-bath units multifamily listed at $1.20M.
Deal economics
- At list price, monthly cash flow is $-69 ($-827/yr) — negative. Per door: $-8/mo.
- To cash-flow at today's rent, offer at most $1.19M (1.0% below list).
- To meet the 1% rule (rent ≥ 1% of price), the offer needs to be $954k (20.5% below list).
- Recommended offer: $954k (20.5% below list) — sets the bar for 1% rule.
- Cap rate 6.2% vs local median 5.0% in Louisville — meaningfully above typical; check what's discounted (condition, days-on-market, listing class) to confirm the premium yield is real.
Location & tenants
- Location reads 63/100 on livability (#333 in KY) — a middle-class / working-renter tenant base. Strengths: cost of living A+, housing A+; Watch: employment C-, health & safety D+, crime F.
- Jefferson County (urban): math 19% / reading 35% proficiency, ranked #121 of 165 in KY (top 73%) — low school quality limits family demand, transient renter base, plan for 1-2y turnover.
- Zoned schools: Wheatley Elementary (math 2% / reading 8%, grade F, #670 of 676 statewide, top 100%, 318 students, 84% FRL); Highland Middle (math 10% / reading 41%, grade F, #181 of 217 statewide, top 84%, 801 students, 59% FRL); Iroquois High (math 12% / reading 8%, grade F, #245 of 254 statewide, top 97%, 1,090 students, 74% FRL) — zoned schools average 73% FRL vs 56% district-wide (17 pts higher); higher-poverty schools than district average — tighter screening recommended.
- Zoned-school proficiency averages 13% at this address vs 27% district-wide (-14 pts) — the specific schools serving this property underperform the Jefferson County average; the district grade overstates school quality for this exact location.
- Market conditions: Rents rising fast (+6.1%/yr); 76 active listings in the ZIP; lower-income renter base — watch delinquency; 2,836 units permitted in Jefferson County in 2024 (1,558 in 5+ unit buildings).
Forward outlook
- Local home prices are declining (-3.0%/yr); year-one equity from $8k of loan paydown is wiped out by about $36k of value loss. Plan a longer hold.
- Jefferson County population projected at +13% by 2050 — modest demand growth; plan on rents tracking national, not racing it.
Negotiation context
- It's been on market 327 days — a 12% lower offer ($1.06M) is reasonable based on typical stale-listing flexibility.
- 3 sale attempts since 19y ago with the ask held roughly flat each time — persistent listings suggest the price (not the market) is what's stuck; bring a comps-based counter.
- Current owner paid $290k; list at $1.20M implies a 314% gain — meaningful room to come down on a strong offer.
Risks & watch-outs
- Watch-outs: built in 1885 — expect roof / HVAC / electrical / plumbing capex.
- Climate carrying-cost: major flood risk; extreme-heat days projected 7→20/yr by 2055 (HVAC capex compounding) — expect insurance premiums to compound above CPI over the hold.
Questions for the listing agent
- What do current leases actually rent for vs. the listed asking? Can we see a recent rent roll and the last 12 months of T-12 income?
- It's been on market 327 days. Have you received any prior offers? Is the seller open to a 21% concession, seller financing, or rate buy-down credit?
- Can we see the unit-by-unit rent roll, current vacancy, and any below-market leases? What's the average tenancy length?
- What capital expenditures (roof, boiler, parking lot, exteriors) have been made in the last 5 years, and what's planned in the next 2?
- Built in 1885 — when were the roof, HVAC, electrical panel, plumbing, and water heater last replaced?
- Why hasn't it sold? Are there any deal-killer items the seller is aware of (foundation, flood, title, zoning, code violations)?
- Is there a deadline driving the sale (1031 exchange, divorce, estate, relocation)? That informs how much negotiation room exists.
- Schools are D-rated, which usually means shorter tenancies and higher turnover. Who's the typical renter profile here, and what's been the actual vacancy rate?
- Crime grade is F in this area — have there been break-ins, vandalism, or insurance claims at this property in the last 3 years? What carrier currently insures it and at what premium?
- The area grade is low — what's the realistic commute time and amenity access for the typical tenant pool here? Any planned neighborhood developments (good or bad) we should know about?
- What's the average days-on-market for RENTAL listings here right now (not sales)? A rising rental-DOM trend means longer vacancies and softer asking-rent achievability than the comps imply.
- What's the recent tenant-quality profile in this submarket — average credit score on applications, eviction rate, late-payment / NSF rate, and stable-employment percentage? A property-management company in the area should have these aggregated.
- How much new apartment / multifamily construction is in the pipeline within 1–3 miles? Heavy new supply (>2% of stock underway) typically softens rents 12–24 months out; light construction supports rent growth.
Investment metrics
- 1% rule
- 0.79% ✗
- Cap rate
- 6.22%
- Cash-on-cash
- -0.25%
- DSCR
- 0.99
- GRM
- 10.5
CMA / ARV
No comps found within radius.
Projected returns pro-forma
-3.0% appreciation · 6.06% rent growth · sell at horizon
- IRR
- -13.6%
- Equity multiple
- 0.50×
- Total profit
- $-168,865
- Equity at exit
- $178,924
- IRR
- -0.8%
- Equity multiple
- 0.94×
- Total profit
- $-21,612
- Equity at exit
- $103,754
Cash invested: $336,000 (down + closing). Projections, not guarantees.
Landlord ↔ Tenant lean methodology
- Overall (STATE)
- 83 Strongly Landlord-Friendly
- State Kentucky
- 83 Strongly Landlord-Friendly · R+16
- County
- — inherits STATE
- City
- — inherits STATE
ZIP-level market 40208
- Home prices YoY
- -23.3%
- Rents YoY
- 6.1%
- Active inventory
- 76
- Price-to-rent
- 94.4×
Monthly cashflow live
- Estimated rent
- $9,536 high interval (Pro) →
- Mortgage (P&I)
- −$6,293
- Tax from tax record
- −$809 /mo · $9,713/yr
- Insurance
- −$500
- HOA
- −$0
- Vacancy / Maint / Mgmt
- −$2,003
- Net cashflow
- $-69
Break-even live
Sensitivity live
| Price | -10% $610 | -5% $271 | +0% $-69 | +5% $-409 | +10% $-748 |
|---|---|---|---|---|---|
| Rent | -10% $-822 | -5% $-446 | +0% $-69 | +5% $308 | +10% $684 |
| Rate | -1.0pp $535 | -0.5pp $236 | base $-69 | +0.5pp $-380 | +1.0pp $-696 |
9-unit breakdown (identical units grouped — click to expand)
| Units | Beds | Baths | Est. rent |
|---|---|---|---|
| 9× units | 2 | 1.5 | $9,540 |
| #1 | 2 | 1.5 | $1,060 |
| #2 | 2 | 1.5 | $1,060 |
| #3 | 2 | 1.5 | $1,060 |
| #4 | 2 | 1.5 | $1,060 |
| #5 | 2 | 1.5 | $1,060 |
| #6 | 2 | 1.5 | $1,060 |
| #7 | 2 | 1.5 | $1,060 |
| #8 | 2 | 1.5 | $1,060 |
| #9 | 2 | 1.5 | $1,060 |
| Total (9 units) | $9,536 | ||
UW: 25.0% down · 7.5% · 30yr · 1.5% tax · 5.0% vac · 8.0% maint · 8.0% mgmt
Financing live
Cash to close
- Down payment
- $300,000
- Closing costs
- $36,000
- Reserves months
- —
- Total cash needed
- —
Loan-product check · same deal, 3 products live
Conventional
25% down · 7.5% · 30yr
- Down + closing
- —
- Monthly P&I
- —
- Monthly cashflow
- —
- DSCR
- —
- Eligible?
- —
Personal DTI + credit; lowest rate.
DSCR
20% down · 8.5% · 30yr
- Down + closing
- —
- Monthly P&I
- —
- Monthly cashflow
- —
- DSCR
- —
- Eligible?
- —
No personal income docs; deal must DSCR.
Hard money
10% down · 12.0% · 12mo
- Down + closing
- —
- Monthly P&I
- —
- Monthly cashflow
- —
- DSCR
- —
- Eligible?
- —
Short-term bridge; refi at stabilization.
Listing history 8 events
-
2025-07-03$1,200,000 Active
-
2024-04-10historical $795
-
2024-03-13price $795
-
2024-02-02$850
-
2023-07-16historical
-
2007-09-28soldstatus $290,000 351-char remark
Show marketing remark (351 chars)
Fantastic location overlooking Central Park surrounded by Bed and Breakfasts and Luxury Condos. This building is an incredible income producer with rarely ever any vacancies, plus five garages for additional income. Current monthly gross income is $4755 with great potential to increase. Same owners for over 33 yrs. This property is to be Sold as is.
-
2007-09-28soldstatus $290,000
Show marketing remark (351 chars)
Fantastic location overlooking Central Park surrounded by Bed and Breakfasts and Luxury Condos. This building is an incredible income producer with rarely ever any vacancies, plus five garages for additional income. Current monthly gross income is $4755 with great potential to increase. Same owners for over 33 yrs. This property is to be Sold as is.
-
2007-03-05$345,000 351-char remark
Show marketing remark (351 chars)
Fantastic location overlooking Central Park surrounded by Bed and Breakfasts and Luxury Condos. This building is an incredible income producer with rarely ever any vacancies, plus five garages for additional income. Current monthly gross income is $4755 with great potential to increase. Same owners for over 33 yrs. This property is to be Sold as is.
ⓘ Source: listings_history table (triggers on properties + properties_extension) + one-shot
backfill from property_details.listing_events for pre-trigger history.
Tax reassessment forecast KY · Resets to sale price
- Current annual tax
- $9,713 · $809/mo
- Projected year-2 tax
- $10,320 · $860/mo
- Expected delta
- +$607/yr (+$51/mo · 6.2%)
ⓘ Screening estimate from a state-policy table — verify with the county assessor before closing.
Climate risk First Street
- Flood 6/10 Major FEMA zone X (unshaded) · 72% chance over 30 yrs
- Wildfire 1/10 Low
- Heat 5/10 Major 7 d/yr ≥105°F today · 20 d/yr by 30 yrs out
- Wind 2/10 Low 100% chance of damaging wind over 30 yrs
- Air quality 2/10 Low 1 unhealthy d/yr today · 3 by 30 yrs out
Nearby sold comps map
Loading sold comps map…
Walkable amenities ~0.75 mi
Loading nearby amenities…
Taxation est. · year 1
- Rental income
- $114,432
- − Mortgage interest
- −$67,219
- − Property taxes
- −$9,713
- − Insurance
- −$6,000
- − Repairs & maintenance
- −$9,155
- − Management
- −$9,155
- − Depreciation
- −$34,909
- Taxable loss
- −$21,718
- Est. tax savings @ 24.0%
- +$5,212
- After-tax cash flow
- $4,385/yr
For passive investors: Depreciation is non-cash, so a rental often shows a tax loss while cash-flowing — sheltering income. Rental losses are passive: they offset passive income freely, and up to $25,000/yr can offset ordinary (W-2) income if you actively participate and your MAGI is under $100k (phasing out to $0 by $150k); unused losses carry forward. On sale, claimed depreciation is recaptured at up to 25%, and gains may owe capital-gains tax (a 1031 exchange can defer both). Figures are a year-1 estimate at your 24.0% rate — not tax advice; consult a CPA.
Schools (NCES district)
- District
- Jefferson County
- NCES district ID
- 2102990
- Math proficiency
- 19% ▼ -17.00%
- Reading proficiency
- 35% ▼ -11.00%
- Median HH income
- $47,885
- Composite
- 23.45/100
- National rank
- #7884
- State rank
- #121 of 165 in KY
Livability — Louisville
- Score
- 63/100
- State rank
- #333
- US rank
- #15887
Category grades
Schools grade is shown separately in the Schools card above.
Census & demographics
- Census place
- Louisville, KY
- County
- Jefferson County · 790,184 people
- City population
- 769,292
- Metro
- Louisville/Jefferson County, KY-IN
- Population (ZIP)
- 15,605
- Household income
- $39,560
- Rent vs Own
- Severe rent burden
- 1136.0
Population outlook (Jefferson County) Hauer SSP2
- Today (2025)
- 823,112 people
- By 2030
- 849,343 · +3.2%
- By 2040
- 895,696 · +8.8%
- By 2050
- 933,630 · +13.4%
- By 2075
- 1,028,262 · +24.9%
- By 2100
- 1,072,675 · +30.3%
Race, ethnicity, and origin ACS 2023
- Neighborhood character
- Diverse neighborhood (Simpson 0.56)
- Race & ethnicity
- White 62% Black 22% Two or more races 9% Hispanic / Latino 6% Asian 1%
- Hispanic origin (detail)
- Mexican 4%
- Common ancestry
- Italian 3% Lithuanian 2% Slovak 2%
- Foreign-born
- 5% · Canada, China, South Korea
- Languages at home
- 90% English-only · Spanish 3% French/Haitian/Cajun 1%
Political lean MEDSL · Jefferson
- 2024 margin
- D (+16.6) · D 57.4% · R 40.9% · Other 1.7%
- 2008→2024 swing
- +4.5pp toward D · 2008: 12.0pp · 2024: 16.6pp
- All cycles
- 2024: D+16.6 2020: D+20.1 2016: D+13.3 2012: D+11.1 2008: D+12.0
Not yet ingested
- Civics
- —
Market trends
- HPI YoY
- ▼ -72.97%
- Current HPI
- 240.6261
- Rent YoY
- ▲ 6.06%
- Metro
- Louisville/Jefferson County, KY-IN
- State GDP YoY
- ▲ 1.81%
- F500 in state
- 4
Industry mix (Fortune 500 HQ in KY)
| Industry | F500 HQs | Revenue |
|---|---|---|
| Healthcare | 1 | $118B |
|
||
| Food / Beverage | 1 | $7B |
|
||
Price history
+247.8% since first listed8 events — show timeline
- 2025-07-03 Listed $1,200,000 Metro Search MLS
- 2024-04-10 Rental Removed $795 APPFOLIO
- 2024-03-13 Price Changed $795 APPFOLIO
- 2024-02-02 Listed for Rent $850 APPFOLIO
- 2023-07-16 Rental Removed — APPFOLIO
- 2007-09-28 Sold (Public Records) $290,000 Public Records
- 2007-09-28 Sold (MLS) $290,000 Metro Search MLS
- 2007-03-05 Listed $345,000 Metro Search MLS
Property tax history
+8.8%/yrLatest (2025): $9,713 · +7.0% YoY. Source: county tax records.
Cash-flow waterfall
monthlySold comps — $/sqft
last 12 mo · ≤1 miLoading sold comps…