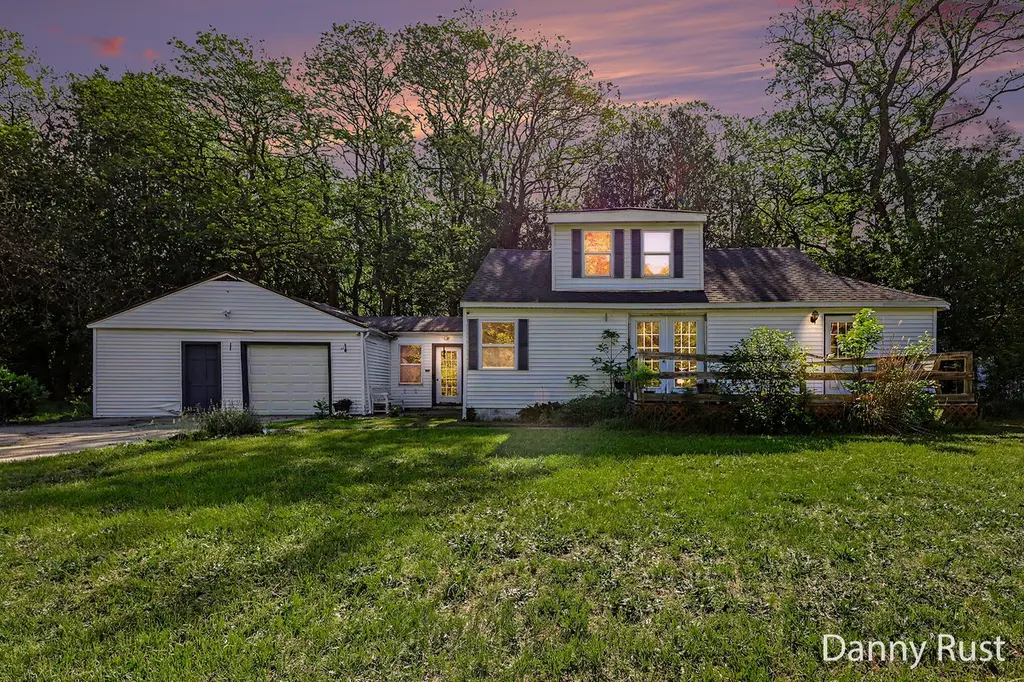
1430 Delz Dr · North Muskegon, MI
Flood risk 1/10 · Minimal
- FEMA flood zone
- X (unshaded)
- Chance of flooding over 30 yrs
- 0.0%
- Est. flood insurance / yr
- $507 – $1,088
Fire risk 2/10 · Minimal
- Est. fire insurance / yr
- $784 – $1,456
Heat risk 1/10 · Minimal
- Hot days now (above 93°F)
- 7 days/yr
- Hot days in 30 yrs
- 15 days/yr
Wind risk 1/10 · Minimal
- Chance of severe wind over 30 yrs
- —
Air-quality risk 4/10 · Minor
- Unhealthy air days now
- 4 days/yr
- Unhealthy air days in 30 yrs
- 5 days/yr
Risk factors via First Street. Map © Google.
Why this score? — see what drove the B grade
The composite is a weighted blend of 9 inputs, each scored 0–100. Each bar is that input's sub-score; the figure is the points it added to the 100-point composite (weight × sub-score).
- Cash flow +21.3/30.0
- ARV discount +15.0/15.0
- Appreciation +10.0/10.0
- DSCR +6.8/10.0
- 1% rule +5.5/10.0
- Livability +3.9/5.0
- Schools +3.2/10.0
- Rent growth +2.5/5.0
- Condition / age +2.5/5.0
$185,000
🖨 Deal sheet 📄 Offer letter ✓ Due diligence
Listing remarks MLS
Nestled on a quiet, peaceful dead-end drive in the highly desirable Reeths-Puffer School District, this Cape Cod-style home offers the perfect blend of a serene setting and an incredible location. You will love the close proximity to local schools, parks, and the beautiful shores of Lake Michigan. The property sits on an expansive lot featuring a large side yard that is ideal for gardening, outdoor activities, or creating your own private oasis. Inside, a functional floor plan includes a comfortable main-floor layout with a kitchen, dining area, living room, and bedrooms, all connected via a central breezeway to a spacious attached garage. This home is primed for its next chapter, featuring major high-ticket mechanical updates that provide incredible peace of mind for the lucky new owner. Move right in and enjoy the comfort of a newer furnace (2018), central air (2020), and a brand-new roof on the main house (2023). Ready for you to bring your own design ideas and personal flair, this
Key facts
- Central breezeway
- Newer furnace
- Private oasis
Tags
Property features AI
Exterior
- Parking: Attached garage (1 car)
- Utilities: Natural gas available and connected; Public water; Cable connected
- Home design: Cape Cod style; Single-family residence; Residential property
- Construction: Built in 1940; Vinyl siding; Composition roof; Crawl space basement
- Exterior features: Public water; Natural gas available and connected; Cable connected; Lot about 0.31 acres
Interior
- Bathrooms: 1 full bathroom
- Heating & cooling: Forced air heating; Has cooling
- Interior features: Fireplace; 7 total rooms
Neighborhood map
What this means for you Summary
Snapshot
- This is a 3-bed/1.0-bath single-family listed at $185k.
Deal economics
- At list price, monthly cash flow is $271 ($3k/yr) — positive.
- The deal already cash-flows at list — no discount required.
- Meets the 1% rule at list price ($2k rent vs $185k).
- Recommended offer: $182k (1.5% below list) — sets the bar for market timing.
- Cap rate 8.0% vs local median 4.1% in North Muskegon — top-decile yield for the area; either an underpriced asset or a hidden risk that comps aren't pricing in. Stress-test before assuming the spread holds.
Location & tenants
- Location reads 77/100 on livability (#129 in MI, #3,195 nationally) — a middle-class / working-renter tenant base. Strengths: crime A+, employment A+, cost of living A+; Watch: amenities F, commute F, health & safety F.
- Reeths-Puffer Schools (suburban): math 28% / reading 44% proficiency, ranked #254 of 540 in MI (top 47%) — families likely to look elsewhere, expect single-tenant / working-renter base with shorter leases.
- Market conditions: 142 active listings in the ZIP; 438 units permitted in Muskegon County in 2024 (115 in 5+ unit buildings).
Forward outlook
- In year one you build about $20k of equity ($1k loan paydown + $18k appreciation (10.0% local appreciation)).
- Muskegon County population projected to shrink 8% by 2050 — rents likely to lag national; underwrite the cash flow, not the appreciation.
- At projected returns (10.0% appreciation + 3.0% rent growth), your $52k cash investment doubles in ~3 years — after that, you're playing with house money.
- By year 2, paydown + projected appreciation supports a ~$32k cash-out refi (75% LTV) — recoverable capital for the next deal without selling this one.
Negotiation context
- It's been on market 17 days — a 2% lower offer ($182k) is reasonable based on typical stale-listing flexibility.
- 3 sale attempts with the ask held roughly flat each time — persistent listings suggest the price (not the market) is what's stuck; bring a comps-based counter.
- Current owner paid $145k; 28% above their basis — modest negotiation headroom, anchor on the comps not their cost.
Risks & watch-outs
- Watch-outs: built in 1940 — expect roof / HVAC / electrical / plumbing capex.
Questions for the listing agent
- Built in 1940 — when were the roof, HVAC, electrical panel, plumbing, and water heater last replaced?
- Is there a deadline driving the sale (1031 exchange, divorce, estate, relocation)? That informs how much negotiation room exists.
- Schools are A-rated — typically a magnet for longer-tenancy family renters. What's the average tenant stay here, and is there a school-zone premium baked into asking?
- What's the average days-on-market for RENTAL listings here right now (not sales)? A rising rental-DOM trend means longer vacancies and softer asking-rent achievability than the comps imply.
- What's the recent tenant-quality profile in this submarket — average credit score on applications, eviction rate, late-payment / NSF rate, and stable-employment percentage? A property-management company in the area should have these aggregated.
- How much new for-sale + rental construction is in the pipeline within 1–3 miles? Heavy new supply typically softens prices + rents 12–24 months out; constrained supply supports both.
Investment metrics
- 1% rule
- 1.05% ✓
- Cap rate
- 8.05%
- Cash-on-cash
- 6.27%
- DSCR
- 1.28
- GRM
- 7.9
CMA / ARV
- ARV (on-the-fly)
- $260,988
- Comps found
- 12
Show comp detail 12 sales within ~0.75 mi
| Address | Dist | Beds/Ba | Sqft | Sold | Price | $/sf | Match |
|---|---|---|---|---|---|---|---|
| 1504 Sunview St | 0.65mi | 3/1.5 | 1,378 (-4%) | 3mo | $221,490 | $161 | 59 |
| 1310 W Giles Rd | 0.68mi | 3/2.0 | 1,409 (-2%) | 4mo | $230,000 | $163 | 58 |
| 1165 Horton Rd | 0.48mi | 2/1.0 (-1) | 1,316 (-8%) | 10mo | $269,900 | $205 | 51 |
| 2288 W Giles Rd | 0.49mi | 3/1.0 | 1,230 (-14%) | 4mo | $185,000 | $150 | 50 |
| 1596 Nottingham Ct | 0.57mi | 3/1.5 | 1,296 (-10%) | 8mo | $270,000 | $208 | 49 |
| 1288 Aspacia St | 0.70mi | 3/1.5 | 1,296 (-10%) | 1mo | $142,800 | $110 | 48 |
| 1665 Gladstone Dr | 0.53mi | 3/1.5 | 1,344 (-6%) | 22mo | $244,100 | $182 | 44 |
| 1480 Horton Rd | 0.40mi | 3/1.0 | 1,611 (+12%) | 20mo | $182,000 | $113 | 44 |
| 1060 Horton Rd | 0.62mi | 3/1.5 | 1,512 (+5%) | 19mo | $295,000 | $195 | 44 |
| 957 Cheboygan Dr | 0.62mi | 3/1.5 | 1,353 (-6%) | 23mo | $270,000 | $200 | 40 |
| 1690 Petoskey Dr | 0.55mi | 3/2.0 | 1,540 (+7%) | 23mo | $373,900 | $243 | 38 |
| 1540 Dykstra Rd | 0.71mi | 2/1.5 (-1) | 1,638 (+14%) | 6mo | $290,000 | $177 | 31 |
Match score weights: distance 35% · size 25% · config 20% · recency 20%. Top-matched comps best support the ARV.
Projected returns pro-forma
10.0% appreciation · 3.0% rent growth · sell at horizon
- IRR
- 28.8%
- Equity multiple
- 3.28×
- Total profit
- $118,021
- Equity at exit
- $166,663
- IRR
- 25.1%
- Equity multiple
- 7.45×
- Total profit
- $334,042
- Equity at exit
- $359,414
Cash invested: $51,800 (down + closing). Projections, not guarantees.
Landlord ↔ Tenant lean methodology
- Overall (STATE)
- 62 Landlord-Friendly
- State Michigan
- 62 Landlord-Friendly · EVEN
- County
- — inherits STATE
- City
- — inherits STATE
ZIP-level market 49445
- Home prices YoY
- 7.2%
- Active inventory
- 142
- Price-to-rent
- 7.9×
Monthly cashflow live
- Estimated rent
- $1,951 medium interval (Pro) →
- Mortgage (P&I)
- −$970
- Tax from tax record
- −$223 /mo · $2,680/yr
- Insurance
- −$77
- HOA
- −$0
- Vacancy / Maint / Mgmt
- −$410
- Net cashflow
- $271
Break-even live
UW: 25.0% down · 7.5% · 30yr · 1.5% tax · 5.0% vac · 8.0% maint · 8.0% mgmt
Financing live
Cash to close
- Down payment
- $46,250
- Closing costs
- $5,550
- Reserves months
- —
- Total cash needed
- —
Loan-product check · same deal, 3 products live
Conventional
25% down · 7.5% · 30yr
- Down + closing
- —
- Monthly P&I
- —
- Monthly cashflow
- —
- DSCR
- —
- Eligible?
- —
Personal DTI + credit; lowest rate.
DSCR
20% down · 8.5% · 30yr
- Down + closing
- —
- Monthly P&I
- —
- Monthly cashflow
- —
- DSCR
- —
- Eligible?
- —
No personal income docs; deal must DSCR.
Hard money
10% down · 12.0% · 12mo
- Down + closing
- —
- Monthly P&I
- —
- Monthly cashflow
- —
- DSCR
- —
- Eligible?
- —
Short-term bridge; refi at stabilization.
Listing history 14 events
-
2026-06-19days on market $185,000 Active 17 DOM
-
2026-06-18price $185,000 Active 16 DOM
-
2026-06-18days on market $189,900 Active 16 DOM
-
2026-06-17days on market $189,900 Active 15 DOM
-
2026-06-16days on market $189,900 Active 14 DOM
-
2026-06-15days on market $189,900 Active 13 DOM
-
2026-06-14days on market $189,900 Active 11 DOM
-
2026-06-13days on market $189,900 Active 10 DOM
-
2026-06-10days on market $189,900 Active 8 DOM
-
2026-06-09days on market $189,900 Active 7 DOM
-
2026-06-08days on market $189,900 Active 6 DOM
-
2026-06-07days on market $189,900 Active 5 DOM
-
2026-06-03remarks 699-char remark
-
2026-06-03$189,900 Active 1 DOM
ⓘ Source: listings_history table (triggers on properties + properties_extension) + one-shot
backfill from property_details.listing_events for pre-trigger history.
Tax reassessment forecast MI · Partial reset (capped growth)
- Current annual tax
- $2,680 · $223/mo
- Projected year-2 tax
- $2,764 · $230/mo
- Expected delta
- +$85/yr (+$7/mo · 3.2%)
ⓘ Screening estimate from a state-policy table — verify with the county assessor before closing.
Climate risk First Street
- Flood 1/10 Low FEMA zone X (unshaded) · 0% chance over 30 yrs
- Wildfire 2/10 Low
- Heat 1/10 Low 7 d/yr ≥93°F today · 15 d/yr by 30 yrs out
- Wind 1/10 Low
- Air quality 4/10 Moderate 4 unhealthy d/yr today · 5 by 30 yrs out
Nearby sold comps map
Loading sold comps map…
Walkable amenities ~0.75 mi
Loading nearby amenities…
Taxation est. · year 1
- Rental income
- $23,411
- − Mortgage interest
- −$10,363
- − Property taxes
- −$2,680
- − Insurance
- −$925
- − Repairs & maintenance
- −$1,873
- − Management
- −$1,873
- − Depreciation
- −$5,382
- Taxable income
- $316
- Est. tax owed @ 24.0%
- −$76
- After-tax cash flow
- $3,172/yr
For passive investors: Depreciation is non-cash, so a rental often shows a tax loss while cash-flowing — sheltering income. Rental losses are passive: they offset passive income freely, and up to $25,000/yr can offset ordinary (W-2) income if you actively participate and your MAGI is under $100k (phasing out to $0 by $150k); unused losses carry forward. On sale, claimed depreciation is recaptured at up to 25%, and gains may owe capital-gains tax (a 1031 exchange can defer both). Figures are a year-1 estimate at your 24.0% rate — not tax advice; consult a CPA.
Schools (NCES district)
- District
- Reeths-Puffer Schools
- NCES district ID
- 2629540
- Math proficiency
- 28% ▼ -9.00%
- Reading proficiency
- 44% ▼ -4.00%
- Median HH income
- $55,223
- Composite
- 31.62/100
- National rank
- #5942
- State rank
- #254 of 540 in MI
Livability — North Muskegon
- Score
- 77/100
- State rank
- #129
- US rank
- #3195
Category grades
Schools grade is shown separately in the Schools card above.
Census & demographics
- City population
- 44,766
- Population (ZIP)
- 21,090
Population outlook (Muskegon County) Hauer SSP2
- Today (2025)
- 174,032 people
- By 2030
- 173,365 · -0.4%
- By 2040
- 168,877 · -3.0%
- By 2050
- 160,306 · -7.9%
- By 2075
- 134,426 · -22.8%
- By 2100
- 98,836 · -43.2%
Race, ethnicity, and origin ACS 2023
- Neighborhood character
- Predominantly White (86%)
- Race & ethnicity
- White 86% Two or more races 8% Hispanic / Latino 6% Black 2%
- Hispanic origin (detail)
- Mexican 5%
- Common ancestry
- Iranian 10% Romanian 4% Italian 3%
- Foreign-born
- 2% · Canada
- Languages at home
- 96% English-only · Spanish 4%
Political lean MEDSL · Muskegon
- 2024 margin
- Toss-up / Even · D 48.4% · R 50.2% · Other 1.5%
- 2008→2024 swing
- -31.1pp toward R · 2008: 29.3pp · 2024: -1.8pp
- All cycles
- 2024: R+1.8 2020: D+0.6 2016: D+0.9 2012: D+17.8 2008: D+29.3
Not yet ingested
- Civics
- —
Market trends
- HPI YoY
- ▲ 40.82%
- Current HPI
- 605.31
- Rent YoY
- —
- Metro
- —
- State GDP YoY
- ▲ 1.37%
- F500 in state
- 28
Industry mix (Fortune 500 HQ in MI)
| Industry | F500 HQs | Revenue |
|---|---|---|
| Automotive Parts | 3 | $48B |
|
||
| Automotive | 2 | $372B |
|
||
| Chemicals | 1 | $45B |
|
||
| Automotive Retail | 1 | $29B |
|
||
| Healthcare / Medical Devices | 1 | $23B |
|
||
| Automotive Technology | 1 | $20B |
|
||
Price history
+31.0% since first listed4 events — show timeline
- 2026-06-02 Listed $189,900 REALCOMP
- 2026-06-02 Listed $189,900 MiRealSource-MiMLS
- 2026-06-02 Listed $189,900 SW Michigan MLS
- 2023-05-04 Sold (Public Records) $145,000 Public Records
Property tax history
+5.0%/yrLatest (2025): $2,680 · +2.9% YoY. Source: county tax records.
Cash-flow waterfall
monthlySold comps — $/sqft
last 12 mo · ≤1 miLoading sold comps…