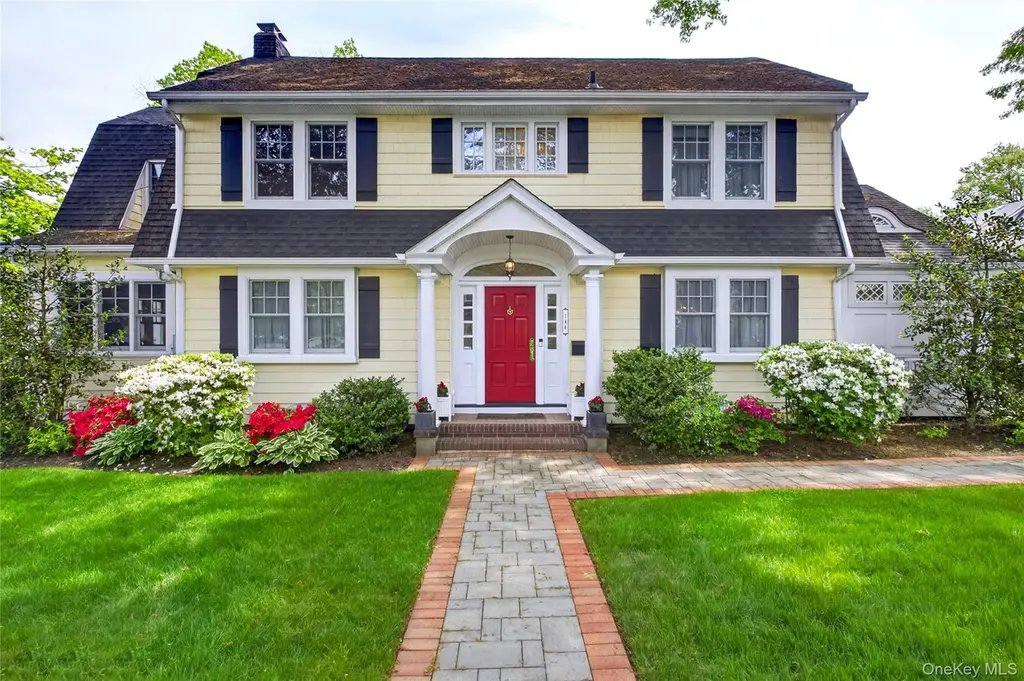
146 Onderdonk Ave · Manhasset, NY
Flood risk 1/10 · Minimal
- FEMA flood zone
- X (unshaded)
- Chance of flooding over 30 yrs
- 0.0%
- Est. flood insurance / yr
- $473 – $860
Fire risk 2/10 · Minimal
- Est. fire insurance / yr
- $691 – $1,283
Heat risk 6/10 · Moderate
- Hot days now (above 98°F)
- 7 days/yr
- Hot days in 30 yrs
- 16 days/yr
Wind risk 6/10 · Moderate
- Chance of severe wind over 30 yrs
- 27.0%
Air-quality risk 4/10 · Minor
- Unhealthy air days now
- 6 days/yr
- Unhealthy air days in 30 yrs
- 7 days/yr
Risk factors via First Street. Map © Google.
Why this score? — see what drove the C- grade
The composite is a weighted blend of 9 inputs, each scored 0–100. Each bar is that input's sub-score; the figure is the points it added to the 100-point composite (weight × sub-score).
- ARV discount +14.9/15.0
- Cash flow +8.5/30.0
- Schools +8.3/10.0
- Appreciation +7.7/10.0
- Livability +4.1/5.0
- Rent growth +2.5/5.0
- Condition / age +2.5/5.0
- DSCR +2.3/10.0
- 1% rule +2.2/10.0
$1,899,000
🖨 Deal sheet 📄 Offer letter ✓ Due diligence
Listing remarks
Updated 4-bedroom, 4.5-bath Colonial offering approximately 3,500 square feet in a prime Manhasset location. A coveted first-floor bedroom suite, five fully renovated full baths, and high-quality finishes throughout. Gracious layout ideal for entertaining, with a beautifully landscaped yard and detached two-car garage. Heated driveway and walkway for effortless year-round living. Steps to town, dining, the LIRR, and within the Manhasset School District.
Key facts
- Steps to town
- Landscaped yard
- Heated driveway
Tags
Property features AI
Exterior
- Parking: Detached driveway parking; 2-car garage
- Utilities: Cesspool sewer; Public trash collection
- Home design: Single-family residence; Living area based on plans
- Construction: Frame construction
- Exterior features: Frame construction; Not waterfront
Interior
- Kitchen: Dishwasher; Range; Refrigerator
- Bedrooms: Total rooms: 9 (includes bedrooms)
- Bathrooms: 4 full bathrooms; 1 half bathroom
- Heating & cooling: Central air conditioning; Natural gas heating
- Interior features: First-floor bedroom; First-floor full bathroom; Full basement
- Laundry & utility: Dryer
Neighborhood map
What this means for you Summary
Snapshot
- This is a 4-bed/4.5-bath single-family listed at $1.90M.
Deal economics
- At list price, monthly cash flow is $-2k ($-20k/yr) — negative.
- To cash-flow at today's rent, offer at most $1.60M (15.6% below list).
- To meet the 1% rule (rent ≥ 1% of price), the offer needs to be $1.37M (28.0% below list).
- Recommended offer: $1.37M (28.0% below list) — sets the bar for 1% rule.
- Cap rate 5.2% vs local median 2.2% in Manhasset — top-decile yield for the area; either an underpriced asset or a hidden risk that comps aren't pricing in. Stress-test before assuming the spread holds.
Location & tenants
- Location reads 82/100 on livability (#78 in NY, #1,199 nationally) — a professional / high-income tenant draw. Strengths: crime A+, commute A+, employment A+; Watch: amenities C-, cost of living F.
- Manhasset Union Free School District (suburban): math 86% / reading 84% proficiency, ranked #8 of 590 in NY (top 1%) — strong family-tenant draw, lease renewals of 3-5y typical; only 4% free/reduced lunch — higher-income household profile.
- Zoned schools: Munsey Park Elementary School (math 82% / reading 87%, grade A+, #93 of 2,108 statewide, top 6%, 863 students, 7% FRL); Manhasset Middle School (math 84% / reading 79%, grade A+, #22 of 729 statewide, top 3%, 521 students, 6% FRL); Manhasset Secondary School (math 100% / reading 87%, grade A+, #141 of 1,100 statewide, top 13%, 962 students, 8% FRL) — zoned schools at 7% FRL track the district average.
- Market conditions: 118 active listings in the ZIP; 3 comparable units currently listed for rent nearby; rentals leasing fast (median 6d on market — plan ~1-2 weeks tenant-placement turnaround); 824 units permitted in Nassau County in 2024 (153 in 5+ unit buildings).
Forward outlook
- In year one you build about $115k of equity ($13k loan paydown + $102k appreciation (5.4% local appreciation)).
- Nassau County population projected at +7% by 2050 — modest demand growth; plan on rents tracking national, not racing it.
- By year 2, paydown + projected appreciation supports a ~$185k cash-out refi (75% LTV) — recoverable capital for the next deal without selling this one.
Negotiation context
- Only 12 days on market — expect competitive offers; lowballing is unlikely to land.
- Current owner paid $350k; list at $1.90M implies a 443% gain — meaningful room to come down on a strong offer.
Risks & watch-outs
- Watch-outs: built in 1928 — expect roof / HVAC / electrical / plumbing capex.
- Climate carrying-cost: major wind risk, 27% chance of damaging wind over 30y; extreme-heat days projected 7→16/yr by 2055 (HVAC capex compounding) — expect insurance premiums to compound above CPI over the hold.
Questions for the listing agent
- What do current leases actually rent for vs. the listed asking? Can we see a recent rent roll and the last 12 months of T-12 income?
- Built in 1928 — when were the roof, HVAC, electrical panel, plumbing, and water heater last replaced?
- Is there a deadline driving the sale (1031 exchange, divorce, estate, relocation)? That informs how much negotiation room exists.
- Schools are A-rated — typically a magnet for longer-tenancy family renters. What's the average tenant stay here, and is there a school-zone premium baked into asking?
- What's the average days-on-market for RENTAL listings here right now (not sales)? A rising rental-DOM trend means longer vacancies and softer asking-rent achievability than the comps imply.
- What's the recent tenant-quality profile in this submarket — average credit score on applications, eviction rate, late-payment / NSF rate, and stable-employment percentage? A property-management company in the area should have these aggregated.
- How much new for-sale + rental construction is in the pipeline within 1–3 miles? Heavy new supply typically softens prices + rents 12–24 months out; constrained supply supports both.
Investment metrics
- 1% rule
- 0.72% ✗
- Cap rate
- 5.24%
- Cash-on-cash
- -3.78%
- DSCR
- 0.83
- GRM
- 11.6
CMA / ARV
- ARV (median comp)
- $2,273,668
- List price
- $1,899,000
- Delta
- -16.48%
- Verdict
- UNDERPRICED
- Comps
- 20 within 1.0 mi
Show comp detail 12 sales within ~0.75 mi
| Address | Dist | Beds/Ba | Sqft | Sold | Price | $/sf | Match |
|---|---|---|---|---|---|---|---|
| 84 Hillcrest Ave | 0.06mi | 4/3.5 | 2,773 (-13%) | 7mo | $1,630,000 | $588 | 66 |
| 30 4th St | 0.49mi | 4/4.5 | 3,417 (+8%) | 2mo | $2,500,000 | $732 | 63 |
| 42 Mora Ct | 0.54mi | 4/3.5 | 3,280 (+3%) | 4mo | $2,600,000 | $793 | 62 |
| 74 Eakins Rd | 0.52mi | 4/2.5 | 3,168 (-0%) | 7mo | $2,600,000 | $821 | 62 |
| 39 Hawthorne Pl | 0.44mi | 5/3.5 (+1) | 3,019 (-5%) | 4mo | $3,135,000 | $1,038 | 59 |
| 50 Highland Ter | 0.40mi | 4/3.5 | 3,500 (+10%) | 7mo | $2,380,000 | $680 | 54 |
| 106 Thayer Rd | 0.36mi | 5/3.0 (+1) | 2,793 (-12%) | 1mo | $2,725,000 | $976 | 52 |
| 38 Mason Dr | 0.52mi | 4/3.5 | 2,805 (-12%) | 3mo | $2,730,000 | $973 | 50 |
| 16 Andover Ln | 0.48mi | 5/3.5 (+1) | 2,948 (-7%) | 10mo | $2,200,000 | $746 | 48 |
| 88 Plandome Ct | 0.58mi | 4/5.5 | 3,600 (+13%) | 1mo | $3,550,000 | $986 | 46 |
| 50 Eakins Rd | 0.53mi | 4/2.5 | 2,726 (-14%) | 5mo | $2,450,000 | $899 | 40 |
| 45 Mason Dr | 0.53mi | 5/3.5 (+1) | 3,579 (+13%) | 8mo | $3,500,000 | $978 | 39 |
Match score weights: distance 35% · size 25% · config 20% · recency 20%. Top-matched comps best support the ARV.
Projected returns pro-forma
5.38% appreciation · 3.0% rent growth · sell at horizon
- IRR
- 10.7%
- Equity multiple
- 1.70×
- Total profit
- $372,518
- Equity at exit
- $1,120,374
- IRR
- 11.9%
- Equity multiple
- 3.26×
- Total profit
- $1,199,687
- Equity at exit
- $1,971,216
Cash invested: $531,720 (down + closing). Projections, not guarantees.
Landlord ↔ Tenant lean methodology
- Overall (STATE)
- 15 Strongly Tenant-Friendly
- State New York
- 15 Strongly Tenant-Friendly · D+10
- County
- — inherits STATE
- City
- — inherits STATE
ZIP-level market 11030
- Home prices YoY
- 1.9%
- Active inventory
- 118
- Price-to-rent
- 11.6×
Monthly cashflow live
- Estimated rent
- $13,672 medium interval (Pro) →
- Mortgage (P&I)
- −$9,959
- Tax from tax record
- −$1,724 /mo · $20,694/yr
- Insurance
- −$791
- HOA
- −$0
- Vacancy / Maint / Mgmt
- −$2,871
- Net cashflow
- $-1,673
Break-even live
UW: 25.0% down · 7.5% · 30yr · 1.5% tax · 5.0% vac · 8.0% maint · 8.0% mgmt
Financing live
Cash to close
- Down payment
- $474,750
- Closing costs
- $56,970
- Reserves months
- —
- Total cash needed
- —
Loan-product check · same deal, 3 products live
Conventional
25% down · 7.5% · 30yr
- Down + closing
- —
- Monthly P&I
- —
- Monthly cashflow
- —
- DSCR
- —
- Eligible?
- —
Personal DTI + credit; lowest rate.
DSCR
20% down · 8.5% · 30yr
- Down + closing
- —
- Monthly P&I
- —
- Monthly cashflow
- —
- DSCR
- —
- Eligible?
- —
No personal income docs; deal must DSCR.
Hard money
10% down · 12.0% · 12mo
- Down + closing
- —
- Monthly P&I
- —
- Monthly cashflow
- —
- DSCR
- —
- Eligible?
- —
Short-term bridge; refi at stabilization.
Rent comps 3 comps
| Address | Beds | Baths | Sqft | Rent | $/sqft | DOM | Units | Dist |
|---|---|---|---|---|---|---|---|---|
| 106 Thayer Rd Manhasset, NY | 5.0 | 3.0 | 2793 | $12,000 | $4.30 | 2d | 1 | 0.37mi |
| 72 Highland Ter Manhasset, NY | 4.0 | 2.0 | 2216 | $6,400 | $2.89 | 43d | 1 | 0.39mi |
| 18 Heights Rd Manhasset, NY | 5.0 | 4.5 | 4411 | $25,000 | $5.67 | 6d | 1 | 0.48mi |
Listing history 3 events
-
2026-05-14$1,899,000 Active 457-char remark
-
1995-11-02soldstatus $350,000
-
1984-12-01soldstatus $255,000
ⓘ Source: listings_history table (triggers on properties + properties_extension) + one-shot
backfill from property_details.listing_events for pre-trigger history.
Tax reassessment forecast NY · Partial reset (capped growth)
- Current annual tax
- $20,694 · $1,724/mo
- Projected year-2 tax
- $26,393 · $2,199/mo
- Expected delta
- +$5,700/yr (+$475/mo · 27.5%)
ⓘ Screening estimate from a state-policy table — verify with the county assessor before closing.
Climate risk First Street
- Flood 1/10 Low FEMA zone X (unshaded) · 0% chance over 30 yrs
- Wildfire 2/10 Low
- Heat 6/10 Major 7 d/yr ≥98°F today · 16 d/yr by 30 yrs out
- Wind 6/10 Major 27% chance of damaging wind over 30 yrs
- Air quality 4/10 Moderate 6 unhealthy d/yr today · 7 by 30 yrs out
Nearby sold comps map
Loading sold comps map…
Walkable amenities ~0.75 mi
Loading nearby amenities…
Taxation est. · year 1
- Rental income
- $164,068
- − Mortgage interest
- −$106,374
- − Property taxes
- −$20,694
- − Insurance
- −$9,495
- − Repairs & maintenance
- −$13,125
- − Management
- −$13,125
- − Depreciation
- −$55,244
- Taxable loss
- −$53,989
- Est. tax savings @ 24.0%
- +$12,957
- After-tax cash flow
- $-7,120/yr
For passive investors: Depreciation is non-cash, so a rental often shows a tax loss while cash-flowing — sheltering income. Rental losses are passive: they offset passive income freely, and up to $25,000/yr can offset ordinary (W-2) income if you actively participate and your MAGI is under $100k (phasing out to $0 by $150k); unused losses carry forward. On sale, claimed depreciation is recaptured at up to 25%, and gains may owe capital-gains tax (a 1031 exchange can defer both). Figures are a year-1 estimate at your 24.0% rate — not tax advice; consult a CPA.
Schools (NCES district)
- District
- Manhasset Union Free School District
- NCES district ID
- 3618270
- Math proficiency
- 86% ▬ 0.00%
- Reading proficiency
- 84% ▲ 2.00%
- Median HH income
- $166,795
- Composite
- 82.99/100
- National rank
- #17
- State rank
- #8 of 590 in NY
Livability — Manhasset
- Score
- 82/100
- State rank
- #78
- US rank
- #1199
Category grades
Schools grade is shown separately in the Schools card above.
Census & demographics
- Census place
- Manhasset, NY
- City population
- 17,703
- Population (ZIP)
- 17,703
Population outlook (Nassau County) Hauer SSP2
- Today (2025)
- 1,409,302 people
- By 2030
- 1,431,482 · +1.6%
- By 2040
- 1,471,607 · +4.4%
- By 2050
- 1,502,845 · +6.6%
- By 2075
- 1,575,403 · +11.8%
- By 2100
- 1,554,356 · +10.3%
Race, ethnicity, and origin ACS 2023
- Neighborhood character
- Predominantly White (67%)
- Race & ethnicity
- White 67% Asian 20% Hispanic / Latino 8% Two or more races 7% Black 1%
- Hispanic origin (detail)
- Puerto Rican 2% Cuban 1%
- Common ancestry
- Romanian 5% Scotch-Irish 3% Italian 2%
- Foreign-born
- 18% · China, South Korea, Canada
- Languages at home
- 74% English-only · Chinese 9% Other Indo-European 8% Korean 3%
Political lean MEDSL · Nassau
- 2024 margin
- Toss-up / Even · D 47.9% · R 52.1%
- 2008→2024 swing
- -12.6pp toward R · 2008: 8.4pp · 2024: -4.2pp
- All cycles
- 2024: R+4.2 2020: D+9.5 2016: D+5.3 2012: D+6.7 2008: D+8.4
Not yet ingested
- Civics
- —
Market trends
- HPI YoY
- ▲ 5.38%
- Current HPI
- 288.8947
- Rent YoY
- —
- Metro
- —
- State GDP YoY
- ▲ 2.60%
- F500 in state
- 92
Industry mix (Fortune 500 HQ in NY)
| Industry | F500 HQs | Revenue |
|---|---|---|
| Financial Services | 10 | $950B |
|
||
| Consumer Goods | 9 | $162B |
|
||
| Insurance | 4 | $225B |
|
||
| Telecommunications | 2 | $144B |
|
||
| Pharmaceuticals | 2 | $112B |
|
||
| Media / Entertainment | 2 | $69B |
|
||
Price history
+644.7% since first listed4 events — show timeline
- 2026-05-26 Pending — OneKey® MLS as Distributed by MLS Grid
- 2026-05-14 Listed $1,899,000 OneKey® MLS as Distributed by MLS Grid
- 1995-11-02 Sold (Public Records) $350,000 Public Records
- 1984-12-01 Sold (Public Records) $255,000 Public Records
Property tax history
+2.5%/yrLatest (2024): $20,694 · +2.4% YoY. Source: county tax records.
Cash-flow waterfall
monthlySold comps — $/sqft
last 12 mo · ≤1 miLoading sold comps…